Gold exploded higher on Friday, jumping over 1.3% against the Dollar as escalating tensions in the Middle East sparked risk aversion across financial markets.
U.S. airstrikes in Iraq have unnerved investors, ultimately boosting appetite for safe-haven assets like gold and the Japanese Yen. Given how the precious metal is trading around $1549 as of writing, bulls are clearly in the driving seat with further upside expected in the near term. While investor optimism over a US-China ‘phase one’ trade deal could limit Gold’s upside gains in the medium term, the metal remains supported by global growth concerns, a softer Dollar and Brexit among other geopolitical risk factors.
Focusing on the technical picture, Gold is bullish on the daily charts as there have consistently higher highs and higher lows. The solid breakout above $1535 should open a path towards $1555 in the near term. Should the precious metal secure a close above the $1555 resistance level, the next key point of interest will around $1600, a level not seen since 2013.
Pound stumbles in 2020
The British Pound has entered 2020 struggling to nurse deep wounds inflicted by fears of a no-deal Brexit.
Sterling has depreciated against every single G10 currency this week and is currently trading around 1.3060 against the Dollar. With the road ahead for the Pound filled with many obstacles and uncertainty, the path of least resistance points south.
In regards to the technical picture, the GBPUSD is bearish on the daily charts. Bears remain in control on the daily timeframe with the next key points of interest at 1.3000 and 1.2830.
Dollar jumps on risk aversion
Safe-haven currencies such as the Japanese Yen and Dollar appreciated on Friday as geopolitical tensions stimulated risk aversion.
The Greenback stood tall against other G10 currencies with the Dollar Index trading towards 96.76 as of writing. With uncertainty in the air and investors keep a safe-distance from riskier assets, the Dollar is poised to extend gains.
Technical traders will continue to observe how the Dollar Index behaves around 96.80. A breakout above this level should encourage a move towards 97.20.
Disclaimer: The content in this article comprises personal opinions and should not be construed as containing personal and/or other investment advice and/or an offer of and/or solicitation for any transactions in financial instruments and/or a guarantee and/or prediction of future performance. ForexTime (FXTM), its affiliates, agents, directors, officers or employees do not guarantee the accuracy, validity, timeliness or completeness, of any information or data made available and assume no liability as to any loss arising from any investment based on the same.
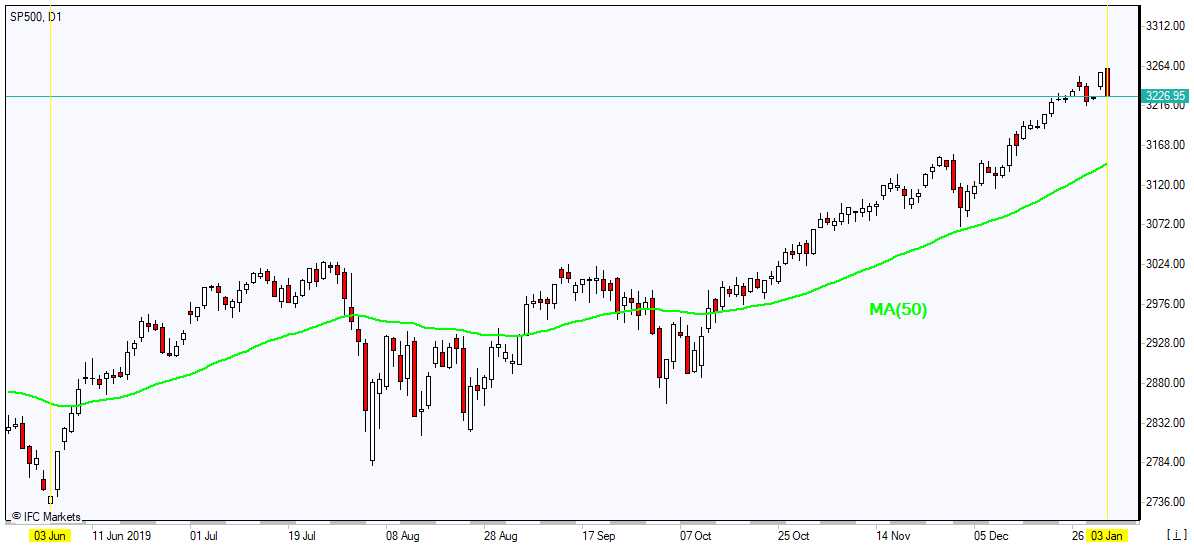
US stock market rally was intact on first trading session of new year on Thursday. The S&P 500 gained 0.8% to new record 3257.85. The Dow Jones industrial average advanced 1.2% to fresh record 28858.80. Nasdaq composite index rallied 1.3% to 9092.20. The dollar weakening reversed as the number of people applying for first time jobless benefits slipped to 222,000 last week: live dollar index data show the ICE US Dollar index, a measure of the dollar’s strength against a basket of six rival currencies, added 0.1% to 96.80 and is higher currently. Futures on three main US stock indices indicate lower openings today after news US strike killed a top Iranian general.
CAC 40 led European indexes rebound
European stock markets resumed advancing on Thursday after reopening following New Year holiday. GBP/USD turned higher yesterday while EUR/USD fell with both pairs lower currently. The Stoxx Europe 600 index ended 1% higher led by finance and technology stocks. Germany’s DAX 30 gained 1% to 13385.95. France’s CAC 40 rose 1.1% and UK’s FTSE 100 added 0.8% to 7604.3.
Australia’s All Ordinaries Index up while Asian indexes retreat
Asian stock indices are mixed today after news that head of Iran’s elite Quds Force was killed in an air attack at the Baghdad international airport. Japan’s markets are closed while yen accelerated its climeb against the dollar. Chinese stocks are retreating: the Shanghai Composite Index is down 0.05% and Hong Kong’s Hang Seng Index is 0.2% lower. Australia’s All Ordinaries Index however gained 0.6% as Australian dollar accelerated its slide against the greenback.
Brent jumps after US strike killing Iranian general
Brent futures prices are extending gains today. Prices ended higher yesterday following news reports Tuesday supporters of Iran-backed militias stormed the US Embassy in Baghdad: March Brent crude rose 0.4% to $66.25 a barrel on Thursday. Today at 17:00 CET the Energy Information Administration will release US Crude Oil Inventories after American Petroleum Institute Tuesday report that US crude supplies fell by 7.8 million barrels last week.
Gold rallied on heightened geopolitical risks
Gold prices rally today on fears of Iranian retaliation after US strike killed head of Iran’s elite Quds Force. Prices rose on Thursday: February gold gained 0.3% to $1528.10 an ounce.
Note: This overview has an informative and tutorial character and is published for free. All the data, included in the overview, are received from public sources, recognized as more or less reliable. Moreover, there is no guarantee that the indicated information is full and precise. Overviews are not updated. The whole information in each overview, including opinion, indicators, charts and anything else, is provided only for familiarization purposes and is not financial advice or а recommendation. The whole text and its any part, as well as the charts cannot be considered as an offer to make a deal with any asset. IFC Markets and its employees under any circumstances are not liable for any action taken by someone else during or after reading the overview.
The first part of our 2020 Outlook covered the Big Picture Backdrop for Precious Metals. This second part focuses on the fundamental and technical setup for gold and silver markets.
Precious metals markets enter the New Year with some impressive upside momentum. Are gold and silver poised to deliver big gains in 2020?
Before answering that question, let’s review the year-end closing prices and yearly gains the metals recorded in 2019:
Gold and silver each notched their best annual gains since 2010. Meanwhile. platinum emerged from its most deeply depressed levels since 2004 to make a run for a new bull market. And palladium posted record high after record high.
All in all, it was a constructive year for metals bulls – though it could have been better. Gold and silver finished strong but below their high points from early September (when gold traded just above $1,560 an ounce and silver hit $19.75).
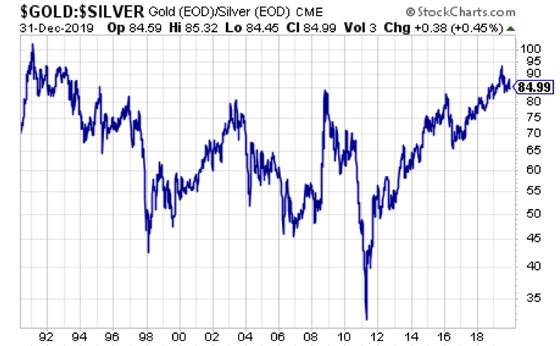
Gold:Silver Ratio Begins to Fall from Extreme High
One of the most remarkable technical developments of 2019 was the gold:silver ratio spiking to 95:1 – its highest level since the early 1990s. It finished the year at 85:1.
A continued decline in the gold:silver ratio toward more historically normal levels would entail not only an outperformance in silver – but also likely a bull market in both gold and silver.
The last powerful decline in the gold:silver ratio from 2009 to 2011 translated into silver surging up over $49/oz and gold making a record high at $1,900/oz.
Spotlight on Silver
Silver may be the metal to watch (and own) in 2020. If global industrial and investment demand picks up even slightly, supply will struggle to keep pace.
In fact, silver mining supply is heading in the opposite direction. The Silver Institute’s World Silver Survey shows production falling at an annual rate of 2%.
Mines have been depleting their silver reserves and haven’t had the incentive to develop new projects given low spot prices and geological challenges due to declining ore grades.
According to Katusa Research, “The average head grade has fallen by over 50% since 2010. This is not a good situation for a miner. In a world where input and production costs are rising yet profit per tonne of rock has fallen by 50%, this poses serious long-term potential problems.”
Investing in a miner is always in iffy proposition, even if you do your homework. The busts tend to outweigh the booms.
And in the case of silver miners, most are primarily in the business of mining other metals (such as lead, copper, nickel, zinc, or gold) – and only mine silver as a byproduct.
The lack of a healthy primary silver mining industry can work to the advantage of physical silver investors. It means that supply will remain constrained in the years ahead.
Even if higher spot prices begin to make mining silver more profitable, the beaten and battered industry won’t have the immediate capacity to grow production to any significant degree. It will take years of rebuilding.
In the meantime, once silver breaks above overhead technical resistance from $20-$21/oz, the path should be clear for a run toward its old record high.
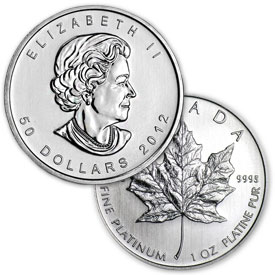
The Platinum Wild Card
The other metal with big upside potential in the 2020s is platinum. It has gotten clobbered by palladium in recent years. But the extreme price disparity between the two now makes platinum a compelling alternative for automakers and other industrial users.
“Platinum had fallen out of favor among investors after Volkswagen AG’s emissions-cheating scandal in 2015 prompted commuters to turn away from diesel vehicles. The market has overestimated the decline in demand for autocatalysts,” reports Bloomberg (via Mining.com)
“By 2025, about 850,000 metric tons of palladium used in autocatalysts could be substituted with platinum…”
For now, though, platinum remains in a supply surplus while high-flying palladium is in a chronic deficit. An investment in platinum should therefore be regarded as somewhat speculative.
Although further downside in price is likely limited, platinum could spend much of 2020 basing out before substitution kicks in to push prices much higher.
The Gold Safe Haven
As always, precious metals investors should first stake out core positions in gold and silver. They are money, first and foremost.
Monetary demand for gold – led by central banks in Russia, China, and elsewhere – is likely to remain strong in 2020.
Even if the global economy falters and causes industrial demand for the white metals to slip, gold buying won’t necessarily go down. It could even increase on a flight to safety.
Gold may not look “cheap” at over $1,500/oz, but it is cheap relative to the U.S. stock market. And the protection physical gold provides from the risks of financial turmoil is invaluable.
The Money Metals News Service provides market news and crisp commentary for investors following the precious metals markets.
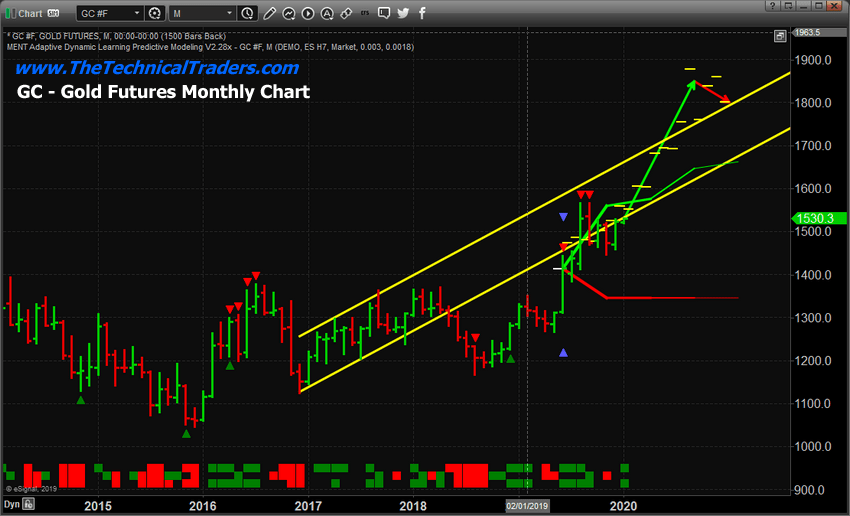
The Gold rally we predicted to happen in late 2018 took place, almost perfectly, based on our ADL predictive modeling systems results. This rally took place in May through September 2019 and pushed Gold up to levels near $1600. The rest of the year, Gold consolidated near $1500 as a strong US Stock Market rally took hold in Q4 of 2019. Our original prediction was that Gold would rally to levels near $1750 before the end of 2019 based on our Adaptive Dynamic Learning predictive modeling system (ADL). This did not happen in 2019 as out ADL modeling systems suggested, but it appears Gold is setting up for another massive upside rally in 2020.
Taking a look at our ADL predictive modeling systems on Monthly charts for Gold and Silver, we see two very interesting suggestions setting up :
_ First, Gold may attempt a rally to a level above $1700 before March/April 2020 and potentially extend this rally to well above $1850 by August/September 2020.
_ Second, Silver appears to lag behind this Gold rally by about 7 to 8 months. Silver does not appear to want to start a rally will well after July or August 2020.
If we consider what happened in 2008/09 with the global credit market crisis, both Gold and Silver contracted lower near the start of this crisis (in late 2008). Eventually, Gold began to move higher in August/September 2009 (well into the crisis event). Silver didn’t really start to accelerate higher will August 2010 – a full 12 months after the Gold rally started.
Our ADL system is suggesting that the Silver rally will lag behind the gold rally by about 10 to 14 months given the ADL predictions for price activity in 2020. Thus, Gold may continue to rally much higher fairly early in 2020, yet we won’t see much upside movement in Silver till after July 2020.
Monthly Gold ADL Chart
This first Monthly Gold ADL chart highlights the ADL predictive modeling systems suggestion related to future price targets. We can see the upside move in Gold should begin with an upside target near $1600~1625 over the next 60+ days. After that, the rally should accelerate higher in April/May 2020 with another move higher towards $1700~1725. By August/September 2020, Gold should attempt a rally to levels above $1800~1850 and then begin to consolidate above $1800 for a few months.
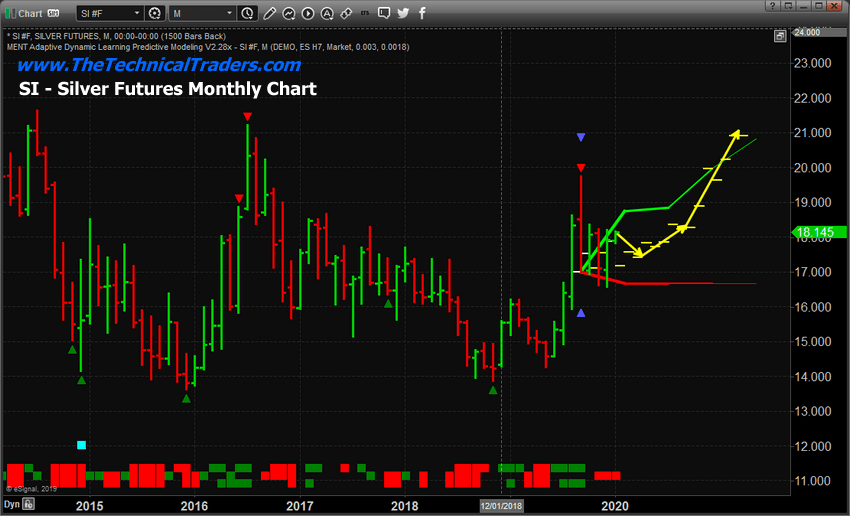
Silver Monthly ADL Chart
This Silver Monthly ADL chart suggests that Metals will react very similar in 2020 to what happened in 2008-09. While Gold began to rally in August 2009, Silver did not begin to accelerate higher till August/September 2010. This delay in the understanding that Silver presents valid protection against risk may take place in this current upside rally in Gold. If the ADL predictions are accurate, then Silver will continue to provide buying opportunities for many months near $17.50~$18 before a major upside price advance begin.
By July 2020, Our ADL predictive modeling system is suggesting Silver will advance to levels above $18.25, then begin a major price advance to levels above $19~20 fairly quickly. Please keep in mind the scope of these predictions related to the global markets and the US Presidential elections. We read into this that a lot of chaos/turmoil may be taking place in the US/World after June/July 2020.
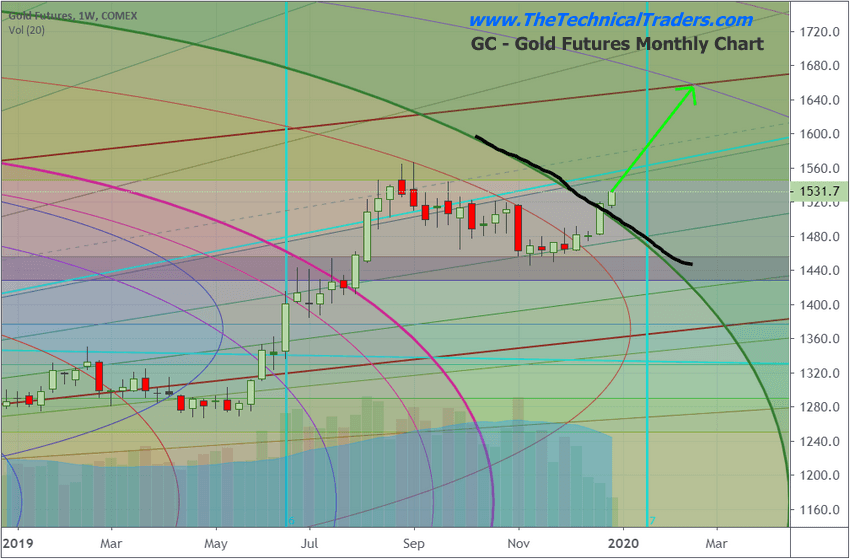
Weekly Gold Chart
This last chart is a Weekly Gold chart highlighting our Fibonacci Price Amplitude Arcs and the major resistance level that has just been broken in Gold. The heavy GREEN arc and the BLACKLINE that we’ve drawn on this chart represent massive resistance originating from the lows near August 2018 in Gold. We believe this resistance level, once broken, will prompt a major upside price move in Gold to levels closer to or above $1700. If this price advance in Gold aligns well with our ADL predictions, then we believe fear will continue to drive future a future price advance in Gold and that fear may be related to continued Global stock market concerns and the US elections.
2020 may be a very good year for precious metals traders who are able to identify solid entry trades for these moves. If our ADL predictions are accurate, Gold should rally over 25% before the end of 2020. Silver may rally as much as 15% before the end of 2020. The timing of these moves suggests Gold traders will have opportunities for bigger price advanced early in 2020 and will begin a larger upside price move after February/March 2020. Silver will begin an upside price move after basing near the March/April 2020.
2020 is going to be a fantastic year for skilled technical traders. Join us and our valued members in finding great trades and incredible opportunities in the markets by joining TheTechnicalTraders.com.
Hong Kong’s trade and current account balances improved more than forecast. Will the HK50 increase continue?
Hong Kong economic data in the last couple of weeks were better than expected: both current account and balance of trade improved more than forecast. The current account surplus increase was bigger in the third quarter of 2019 over same period a year ago than forecast: to HKD 74.45 billion in Q3 of 2019 from HKD 48 billion a year earlier, amounting to 10.3% of the GDP, when HKD 48 billion surplus was expected. And the trade deficit narrowed to HKD 26.2 billion in November from HKD 45 billion a year earlier, instead of HKD 46 billion deficit forecast. Improving trade data are bullish for HK50. Tomorrow the retail sales report will be published. Disappointing retail sales data are a downside risk when a slowing of decline for November is expected.
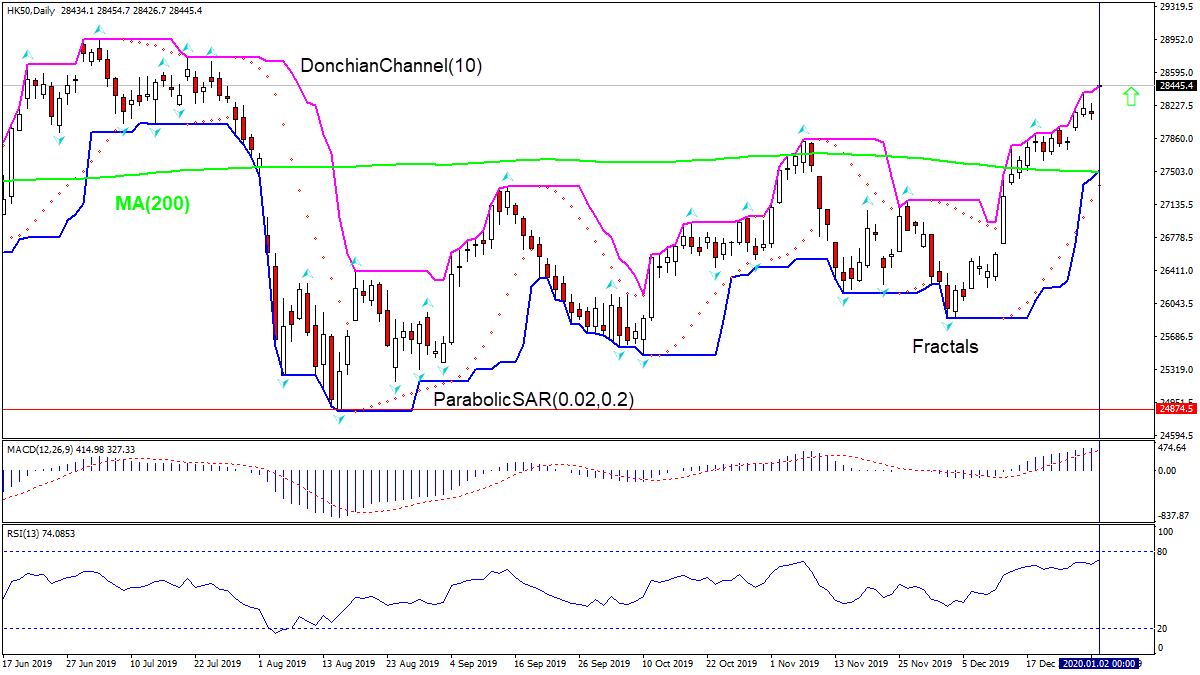
On the daily timeframe HK50: D1 is continuing to gain after a rebound following the decline to 11-month low in the beginning of August.
The Donchian channel indicates uptrend: it is tilted upward.
The MACD indicator has risen above the signal line and the gap is widening, this is a bullish signal.
The RSI oscillator is close to overbought zone but hasn’t crossed into it yet.
We believe the bullish momentum will continue after the price breaches above the upper Donchian boundary at 28454.7. This level can be used as an entry point for placing a pending order to buy. The stop loss can be placed below the lower Donchian boundary at 27513.40. After placing the pending order the stop loss is to be moved every day to the next fractal low, following Parabolic signals. Thus, we are changing the expected profit/loss ratio to the breakeven point. If the price meets the stop-loss level (27513.4) without reaching the order (28454.7) we recommend cancelling the order: the market sustains internal changes which were not taken into account.
China’s central bank lived up to expectations and lowered its reserve requirement ratio for large banks by another 50 basis points, freeing up 800 billion yuan in funds in a move the bank described as “a countercyclical adjustment” that increases the source of funds for financial institutions to directly support the real economy.
The People’s Bank of China (PBOC) cut the ratio for large financial institutions to 12.50 percent, it’s seventh cut in that ratio since April 2018 when it lowered it for the first time since 2016 from 17.0 percent.
Today’s cut in the reserve requirement, which takes effect Jan. 6, comes after Premier Li Keqiang on Dec. 23 said the government was studying further cuts in reserve requirements, among other measures, to lower borrowing costs for small businesses, cementing expectations that PBOC will continue its easing cycle in 2020.
PBOC said on its website the cut in the ratio would lower banks’ overall cost of funds by around 15 billion yuan annually, and small and medium-sized banks along with rural institutions would receive over 120 billion yuan of long-term funds to help local businesses.
PBOC added the cut “is by no means an indiscriminate stimulus measure” but helps offset changes in the run-up to the Spring Festival, or Long Lunar holidays, later this month when demand for cash typically rises.
It added such countercyclical adjustments of monetary policy are “appropriate and sound,” and the monetary policy stance remains unchanged.
The cut in the reserve requirement comes days after the PBOC told financial institutions to use the Loan Prime Rate (LPR), which is already used to price 90 percent of new loans, to price all new loans beginning this month and convert existing loans to LPR from March to August.
Last August PBOC reformed its system for setting LPR and designated it as the new benchmark rate for all loans. Initially LPR was set at 4.25 percent, 10 percent below the old benchmark lending rate at 4.35 percent, and 6 points below the LPR that had been unchanged since October 2013.
Under the new mechanism, which is based on the rate that 18 institutions offer their best customers, LPR is published on the 20th of ever month and the 1-year LPR was then lowered by 5 basis points in September and then another 5 points in November to its current rate of 4.15 percent.
By Orbex – Forex is by far the largest financial market out there. It outstrips the stock market by a couple of orders of magnitude.
Of course, banks are not going to stay on the sidelines of such a large amount of money. In fact, Forex is largely driven by banks, more specifically central banks!
There is a lot more to Forex than just currency exchange for speculative purposes. And having a good understanding of this can help you be a more profitable FX trader.
Banks are the largest players in the forex world. Sometimes, they have enough power to directly affect the value of currencies.
So, what’s going on?
Most Forex Trading is Not Forex Trading
Unlike other markets that are driven primarily by investors looking for a financial return by buying (and selling) assets, Forex has a very large practical component to it.
Firstly, the most logical is the need for multinational corporations around the world to pay for goods and services that they buy overseas. Global trade is one of the primary drivers of currency values. Over $5 trillion in products and services are bought and sold around the world and counting.
Bigger than that are banks balancing their holdings, especially central banks. Every time an asset is bought or sold, funds move from one bank account to another.
When, for example, a Saudi oil billionaire decides to buy stock in the US using money in his account in the UK, the banks involved in the operation have to balance their holdings of dollars and pounds.
It’s the Rules
The banks have to maintain a certain amount of assets to comply with regulations. But, when the value of those assets changes because the price of the currency changes, the bank has to buy and sell certain amounts of it to “trim” their assets to meet their balance sheet.
On a much smaller scale, something similar happens when you travel overseas. When you buy souvenirs and food in a foreign currency using your credit card, that starts a chain of transactions.
This chain leads the credit card company, the bank, and depending on the local rules, even the central bank, to balance their currency holdings.
It’s Just the Big Guys
Banks will also trade their clients’ assets at their request. This is why you can get a Forex account in most major banks.
However, they generally are interested only in large transactions. And most banks require initial deposits that are out of range of most budding FX traders.
Hence the existence of retail brokers who allow you to access the Forex markets without having to deal with the often onerous banking regulations.
In the end, though, whether you are trading with a Forex broker or with a bank, the vast majority of trading in the markets is done by banks. They are the ones who are responding to technical and regulatory needs, and not simply speculating on the market.
This causes the Forex market to be more “logical”. It makes it less prone to wide speculatory swings than other asset classes. On the other hand, that means profitability is more down to diligent trading than finding some obscure trick to luck your way into riches.
The last trading day of the year marked a rough month for the dollar on the back of technical and risk appetite factors above than anything else.
Christmas trading has been typically soft throughout the years, but that was not the case for 2019. A series of breakouts were seen, and they were not attributed to geopolitics.
That being said, trade war and Brexit headlines are going to take their toll in January.
Euro Up on Dollar Weakness
Despite having risen against a weaker dollar amid recent Fed caution and weaker eco data, the euro started the year soft.
The trade war was seen as positive for the dollar, owed to safe-have flows. This could weigh on the euro over the next few weeks as Trump pushes for a January 15 phase one trade deal.
In addition, there is an assumption that Lagarde is ready to launch a dual interest rate policy in order to provide a more effective QE. This is a strategy that points to a somewhat more powerful stimulus since interest rate cuts haven’t really boosted the European economy.
EURUSD Breakout Running Out of Steam
The prices of eurodollar reached a multi-month high at 1.1239 last Tuesday, suggesting that 2020 could provide further upside. Both indicators point to a correction at least in the short-term, if not a reversal.
With 1.12 round support taken out once already, the chances of additional weakness are increasing. This could take prices down to 1.1175, provided any bullish attempt is rather soft.
Brexit Uncertainty Caps Pound Gains
Boris Johnson’s election win reduced political uncertainty near the end of a challenging year. However, Britain has a huge decision to make by the end of January. This should keep any upside limited to previously taken-out levels until Brexit gives way to significant flows.
GBPUSD Tests Golden Ratio Near 1.33
Recent political developments have helped the pound move higher over the past few trading sessions, trading near 2018 highs. The correction down to 1.29 could, however, weigh on cable more than expected.
With 1.3285 tested, bears could lead the markets lower towards 1.29 once again. This assumes that 1.33 round resistance holds firm in case of a bullish takeover attempt.
Gold Bid As Markets Expect Better Growth in 2020
A weaker dollar and upbeat 2020 expectations powered the yellow metal to September highs on Tuesday. Traders are anticipating stronger economies on the back of a trade deal as expectations of a Jan 15 deal increase.
Despite political risks deteriorating, keep in mind that global easing fears could easly add up on the latest demand.
XAUUSD Bulls Take a Breather From $1515 High
Gold hit a two-month high in the last trading session of the decade, closing on a technical advantage above the 1515 support. The next level for bulls is near the 1550 round resistance. However, a short-term take-profit could be seen pulling prices back towards 1509. A break above 1525 would suggest otherwise, however.
By Orbex – The weekly crude oil inventories report is delayed this week due to the New Year’s Day holiday. So, the report will be released tomorrow instead of the usual Wednesday release date.
Last week, the EIA reported a 5.5 million barrel drawdown which took markets by surprise and helped crude prices continue to rally.
The market is now forecasting a subsequent 3.1 million barrel drawdown which should see prices higher again.
Oil Higher on Trade Deal News
The recent upside in oil prices has largely been driven by relief over the trade deal between the US and China.
Last month, the two sides announced that they have agreed to sign the phase-one trade deal which was initially laid out in October. The market had been expecting an announcement, which came just ahead of the December 15th date for the next round of US tariffs.
The reaction to the deal has been clearly visible in crude markets. Traders are buying oil in anticipation of increased demand thanks to more trade projected between the US and China.
The trade war took a heavy toll on crude prices last year. This was before the strong ten-dollar rally that followed the initial news of the deal in October.
Talks are due to move onto the second phase of the deal this month. This should continue to keep crude prices supported.
OPEC Cuts Supporting
Aside from the US-China developments, the oil market has also been boosted by the increase in OPEC production cuts.
The announcement came last month in response to ailing prices and a subdued demand outlook. The 13-member producer cartel stated that it will increase cuts from 1.2 million barrels per day to 1.7 million barrels per day. The increase was agreed upon by OPEC as well as a group of allied nations led by Russia.
The current cuts are due to run until the end of Q1. However, if OPEC deems it necessary, they could extend them.
That being said, there are concerns that Russia might pull out of the deal. These come following comments from the Russia Energy Minister last week stating that Russia will look to gradually leave the agreement over 2020.
For now, however, with the trade negotiations and OPEC production cuts, the near-term outlook remains bullish for crude. Therefore, prices are likely to remain supported.
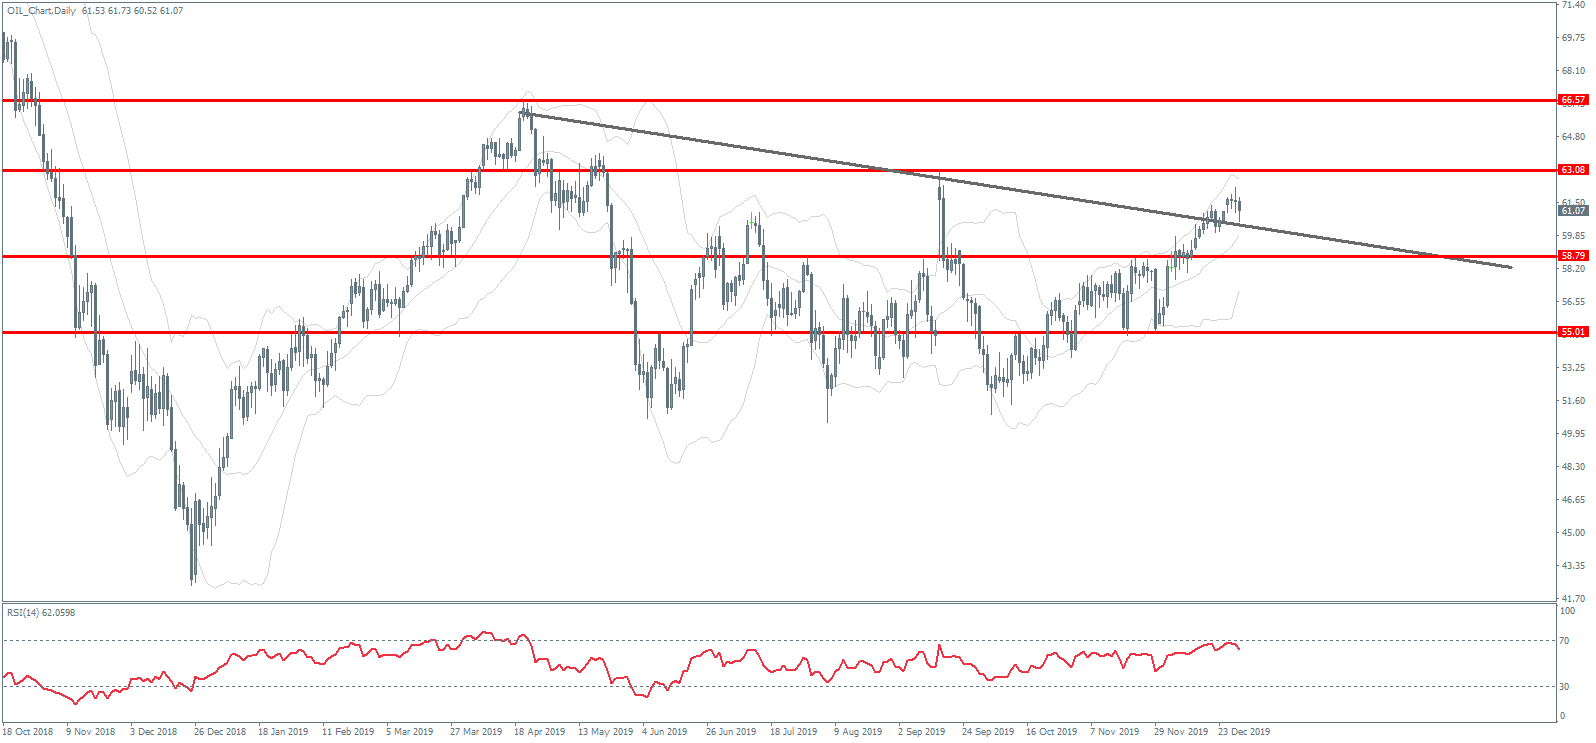
Technical Perspective
The rally in crude has seen price breaking back above the bearish trend line from 2019 highs. The trendline has held one retest so far. While above here, focus is on a challenge of the 63.08 level next. If we break back above that level, the next objective will be the 2019 highs around 66.57.
To the downside, the main support is sitting at the 55 level with some interim support around prior broken highs around 58.80.
The US dollar has started the first proper trading day of 2020 in the green with price recovering following a drift lower over fallow New Year’s Day trading which saw very light volumes.
Data sets released so far this week have done little to help the dollar. On Monday, the Chicago PMI was better than expected. However, the reading remained below the 50 level.
On Tuesday, CB consumer confidence came in weaker than expected. Traders now wait for the ISM manufacturing reading tomorrow along with the FOMC meeting minutes. USD index trades 96.28 last.
Euro Falls on Manufacturing Weakness
EURUSD has been lower today, weighed on by a resurgent US dollar as well as a slew of disappointing data readings. German and eurozone manufacturing PMIs releases this morning both remained in contractionary territory.
While the eurozone reading was slightly better than expected, at just 46.3, the sector is still severely weak. EURUSD trades 1.20 last.
Data Miss Hits GBP
GBPUSD trades lower today also as the final manufacturing reading for December was revised lower to 47.5 from 47.6. Despite the data weakness, GBPUSD remains close to recent highs as optimism around Brexit keeps sentiment underpinned. GBPUSD trades 1.3212 last, just off the recent 1.3283 highs.
Risk Rallies on Trade Deal News
Risk assets have been firmly higher today in response to President Trump’s announcement that the US and China will sign off on the phase-one trade deal on January 15th.
Writing on Twitter, Trump also said that he will be going to Beijing at a later date to begin talks on phase two. The market has been highly encouraged by this strong start to the year with SPX500 rallying back up to 3247.33 last.
JPY & Gold Lower
Safe havens have had a soft start to 2020 trading with gold slightly lower against USD and JPY firmly lower as a result of the strong rally in risk assets. USDJPY is retesting the broken 108.84 level now, having rallied off the recent 108.47 lows. XAUUSD trades 1520.23 last, still sitting below the 1522.75 level for now.
Crude Consolidation Continues
Oil prices have been a little deflated today, despite the positive news on the US-China trade deal. For now, it seems the strength in USD is having a limiting effect on crude.
The EIA report is delayed this week due to the New Year’s Day holiday and will instead be released tomorrow. Following last week’s 5.5 million barrel drawdown, the market now projects a further 3.1 million barrel drawdown which should keep prices supported. Crude trades 61.07 last.
Loonie Recovers But Still Weak
USDCAD has been a little firmer today as a result of stickiness in oil prices and a firmer USD. However, the recent sell-off has seen price hurtling down through the 1.3037 support. The key domestic data focus today will be Canadian manufacturing data, seen at 51.4 last month.
AUD Down on Data Miss
AUDUSD has been under pressure today also. Despite the strong rally in risk assets as a result of the news on a US-China trade deal, AUDUSD has pulled back to .6995 last. Overnight, commodity price data came in below expectations at -2.1% which, coupled with a firmer USD, is weighing on the Aussie here.