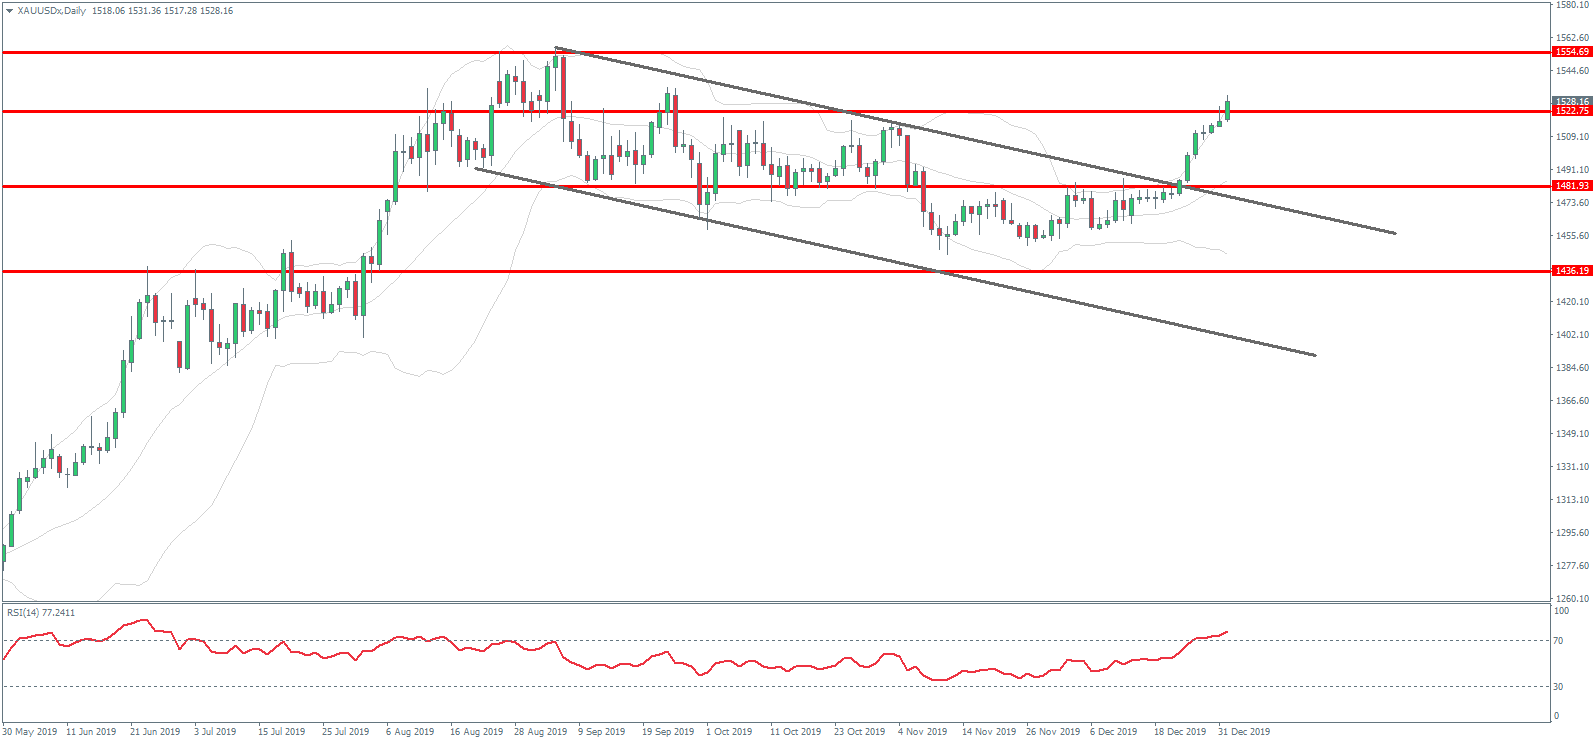
The yellow metal has had a strong start to the first week of 2020. Prices broke out above the 1522.75 level for the first time since September 2019.
The move came on the back of a slide lower in both USD and US equities in response to fears of military conflict between the US and Iran. Tensions rose due to the US accusing Iran of being behind the attack on the US embassy in Iraq. These fears are driving safe-haven inflows into gold currently.
Away from these geopolitical risks, the key driver for metals in the short term remains the trade negotiations between the US and China. Trump declared this week that the two leaders will officially sign the phase-one trade deal on January 15th. He added that the two leaders would soon meet up in Beijing to progress talks onto the next round of negotiations aimed at delivering a second phase of the deal.
The FOMC meeting minutes due later today will be closely watched by metals traders.
At its last meeting, the Fed kept rates on hold. However, it noted that it would be monitoring incoming data. The takeaway here is that there is room for further easing from the Fed if data starts to trend lower again.
If the meetings reveal a greater level of concern among Fed members, this will likely weigh on USD, keeping gold prices supported.
Technical Perspective
The rally in gold prices this week has seen price breaking out above the 1522.75 level. This level is a key long term pivot in gold. Following the breakout from the bull flag structure, the outlook is now firmly bullish for gold. And we expect a challenge of the 1554.69 level next.
Silver
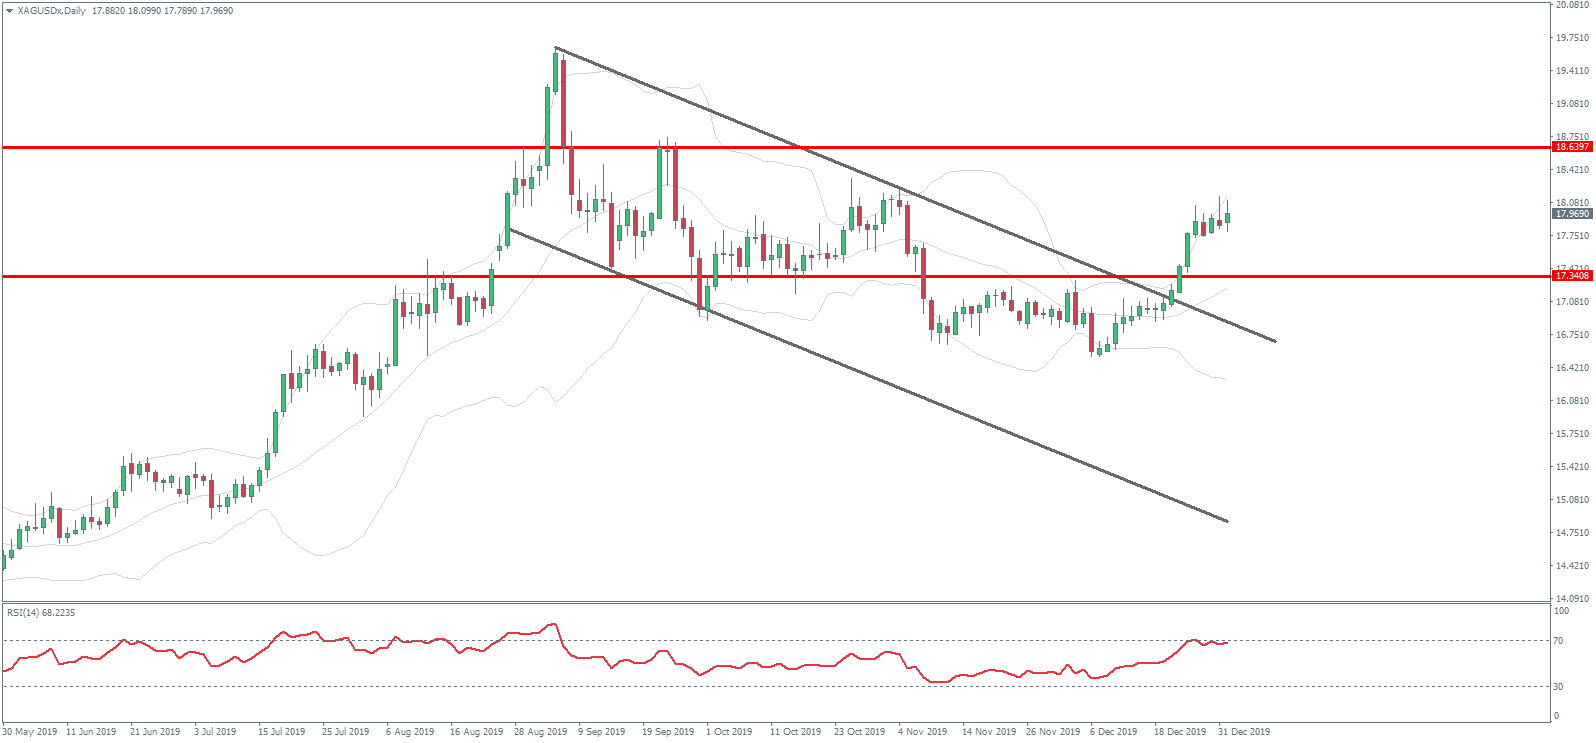
Silver prices enjoyed a strong start to the year also, tracking the moves in gold to trade higher over the week.
Silver has benefitted from weakness in USD recently. News of the trade deal has also supported the metal, offering some light at the end of the tunnel for global manufacturing.
Factory activity around the globe has trended sharply lower over the last year due to the trade war. So, businesses are now hopeful for a pick up as the trade war starts to wind down.
Technical Perspective
The continued rally in silver prices is seeing price head back up towards the 18.6397 level. As with gold, the breakout of the bull flag structure keeps focus firmly on further upside from here. Any retracement lower should find support at a test of the 17.3408 level.
Rick Mills of Ahead of the Herd breaks down the investment thesis behind his belief silver prices are poised to gallop ahead.
Silver is expected to begin the next decade newly burnished, through a combination of higher industrial and investment demand, and tightened supply owing to mine production issues and output cuts.
As December winds down and precious metals trade volumes dwindle, market analysts, including us at Ahead of the Herd, are crunching the numbers from 2019 and looking ahead to what the New Year might bring.
A Banner Year
Without hesitation we can say that 2019 has been an excellent year for gold and silver. Both metals traded flat during the first half, then bolted significantly higher after the U.S. Federal Reserve reversed course and began cutting interest rates instead of raising them. Starting in July, the Fed lowered rates three times before freezing the (benchmark) federal funds rate at a range of 1.51.75% in November.
That, along with similarly dovish policies among other central banks, a record $17 trillion of negative-yielding sovereign bonds, fresh safe-haven demand due to tensions with Iran, and a lack of progress on trade talks, to name key issues, powered precious metals to new heights.
Spot gold and silver both peaked in early September at a respective $1,552/ounce and $19.67/ounce. Metals Focus, a precious metals firm quoted by Kitco, estimates silver will average 3% higher this year compared to 2018. While gold has outperformed silver over the past 12 months, rising around 15% to silver’s 11%, some market observers are picking silver to be the precious metal to beat in 2020.
One analyst who spoke to Kitco is sanguine on silver due to its industrial component. “We are optimistic on the prospect for gold, but we think it will pay off more for those who are to purchase silver. We think the industrial demand side of the equation will improve later in the year,” a commodities strategist at TD Securities said earlier in the week.
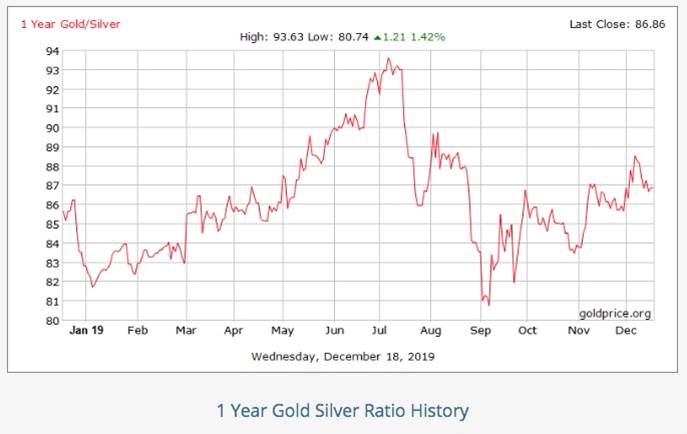
The same analyst thinks the gold-silver ratio in 2020 could improve for silveralthough the current ratio of 86:1 is below the 26-year high reached in June.
The gold-silver ratio is simply the amount of silver one can buy with an ounce of gold. To find the ratio, divide the current gold price by the price of silver.
On June 12, the gold-silver ratio hit a 26-year high by breaking through the 90-ounce markmeaning it took over 90 ounces of silver to purchase one ounce of gold. The higher the number, the more undervalued is silver. Or, to put it another way, the farther gold is pulling away from silver, valued in dollars per ounce.
The gold-silver ratio tells us, as precious metals investors, which is undervalued (or overvalued), silver or gold? For example, at the current ratio of 86:1, a trader who has an ounce of gold could sell his gold for 86 ounces of silver.
The main factors that will determine silver’s fate next year are: whether or not there is a full resolution to the US-China trade war (a complete deal, to follow the recent phase one agreement, would be bullish for the world economy, and boost demand for all metals, including silver); global growth prospects, particularly in sickly Europe; the relative strength of the U.S. dollar; bond yields; and whether central banks continue to keep a firm lid on interest rates.
Since very little gold is used by industry, it trades as an investment commoditymoving up and down in relation to factors like the dollar, inflation, interest rates and sovereign bond yields.
It’s estimated around 60% of silver is utilized in industrial applications, leaving only 40% for investing. And of the 60% demanded by industry, 8 of 10 ounces is either used up in manufactured products, or discarded in landfills.
This also explains silver’s volatility. Because the investment market for silver is so small (60% is locked up in industrial uses), it swings up and down wildly, with relatively low volumes. A lower dollar, and continued economic and political turbulence (consider the upcoming Brexit date and the unfolding impeachment process in the U.S.), would support silver prices.
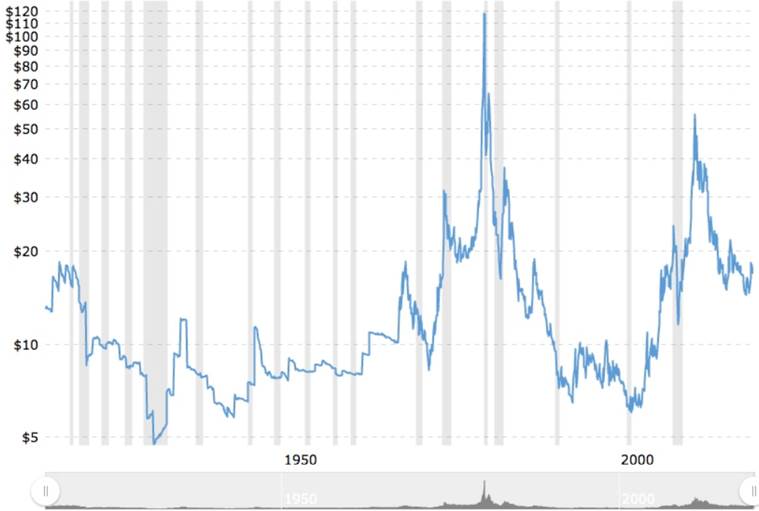
While silver’s performance has disappointed investors for going on a decade, many forget it rose spectacularly between 2000 and 2010, climbing well over 900%, and easily outpacing gold, which only gained 600% during the same time frame. In April 2011, spot silver hit $55.59 an ounce, more than triple its current value.
Also, consider this: last year some 840 million ounces (Moz) of silver were produced worldwide, compared to 108 Moz of gold. Assigning $14/ounce for silver and $1,400/ounce for gold works out to a $13 billion-a-year industry versus $156 billion annually for goldmaking the gold market 11 times larger than silver.
Demand Drivers
Underpinning silver’s fine showing this year and, likely, into next, are a number of important uses, beyond what people normally think of when they imagine silver, as for example jewelry or investable silver coins/ bars.
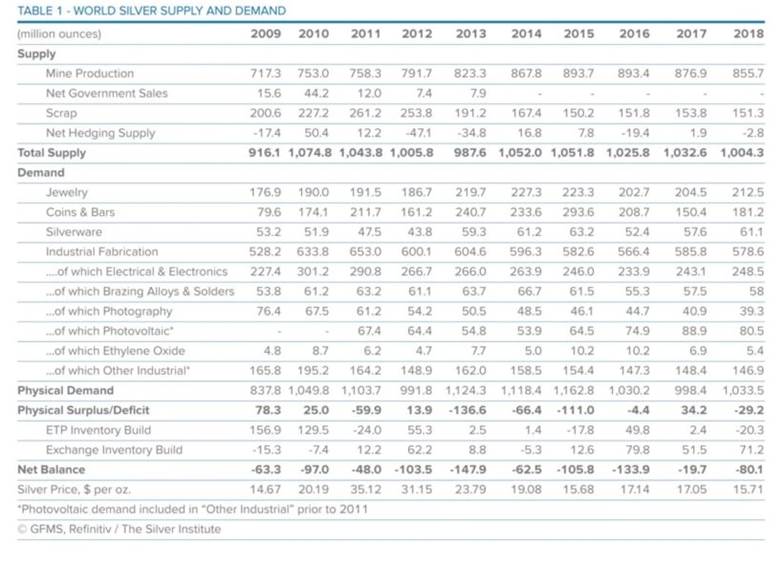
A record amount of silver was sought in 2018. According to the Silver Institute’s annual survey, total physical demand last year rose 4% to 1,033.5 million ouncesa three-year high. The need for silver was driven mostly by purchases of bars and coins, jewelry and silverware, particularly in India.
Reuters reported high gold prices had many Indian buyers turning to lower-priced silver for their bling. The country consumed 16% more silver jewelry in 2018 (76.5 million ounces) and bought 160% more silver investment bars, lifting overall jewelry demand 4% to 212.5 million ounces, and global bar and coin investment 20% to 181.2 Moz.
Silver’s unique properties make it ideal for a number of industrial applicationsalmost as many as oil. The metal is strong, malleable, and conducts heat and electricity better than any other material. Gold also has these properties but it is too expensive to use in circuit boards, solar panels, electric cars, etc.
Over 50% of silver demand comes from industrial uses like solar panels, electronics, the automotive industry and photographic applications.
The solar power industry currently accounts for 13% of silver’s industrial demand.
Indeed, more and more silver will be demanded for its use in solar photovoltaic cells, as countries move further toward adopting renewable energy sources. Around 20 grams of silver are required to build a solar panel. The Silver Institute predicts 100 gigawatts of new solar facilities will be constructed per year between 2018 and 2022, which would more than double the world’s 2017 capacity of 398 gigawatts.
As demand for silver in its various forms powers higher, finding enough metal is becoming a challenge. Last year’s silver supply of 1.004.3 billion ounces failed to meet physical demand of 1.033 billion ounces, leaving a 29.2 Moz deficit.
According to Americas Gold and Silver, a Toronto-based precious metals producer, between 2017 and 2018, silver production across the sector fell 15%, the volume of processed ore slid 14%, and there was a 13% increase in the cash costs per ounce of silver. It’s important to note here that the average head grade at silver mines has fallen by over 50% since 2010cutting into miners’ profitability.
The solution is to find new high-grade production, but the problemlike for goldis finding enough world-class, multimillion-ounce deposits to make up for the lower grades and lesser mine output.
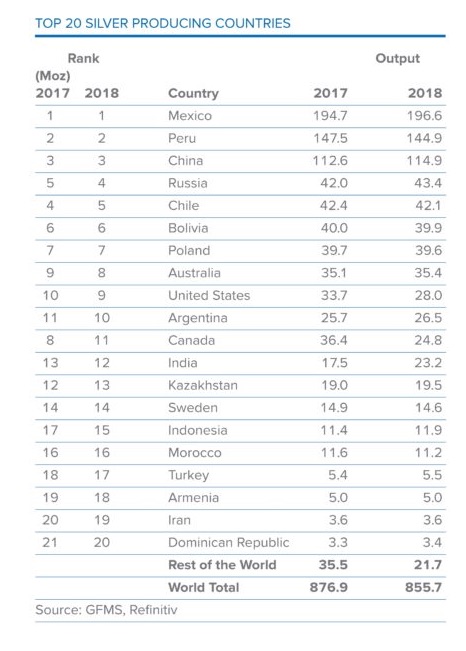
Silver production fell by 2% last year to 855.7 Moz, the third consecutive drop after 13 years of uninterrupted supply growth. The 2019 World Silver Survey attributed the loss to falling production at lead and zinc mines; 75% of silver is mined as a byproduct, mostly of gold, copper, lead and zinc.
As for 2019, mine supply from the top three silver-producing countries, Peru, Chile and Mexico, all dropped in the first half of this year. Data collected from each country showed Peru’s H1 silver production was down 10%, Chile’s fell 7% and Mexico’s saw a 4% decrease from January to May.
Four of the top five silver producers have shown considerable declines in mine supply, including Russia’s number one producer, Polymetal International PLC (POLY:LON), whose production during H1/19 tumbled 14%. In October, the world’s largest silver miner, Fresnillo Plc (FRES:LSE), admitted its annual silver and gold guidance would be at the lower end of an already reduced target, after reporting a fall in output during the third quarter, because of lower ore grades. Q3 silver production fell 14.5% and gold production slumped nearly 7%.
Globally, silver output in 2019 is expected to decline to 913.5 Moz.
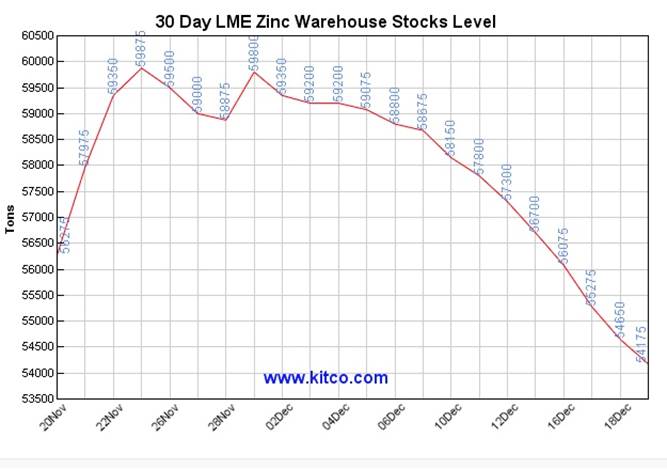
The 2018 narrative of shrinking silver supply due to falling production at lead and zinc mines, where silver is mined as a byproduct, is just as relevant. As of November 2019, zinc and lead are both in terribly short supply in London Metal Exchange warehouses. At just 27,800 tonnes, zinc stocks are at their lowest in 20 years. Lead stocks are higher at 70,075 tonnes, but have not rebuilt significantly from July’s decade low of 55,475 tonnes, CNBC reported.
The International Lead and Zinc Study Group blames supply bottlenecks for keeping lead and zinc (and silver) in deficit this year. The group widened its 2019 expected zinc supply deficit to 178,000 tonnes, from its earlier 121,000 tonnes prediction.
Conclusion
Recall that only 25% of silver production originates from primary silver mines. The rest is mined as a byproduct of gold, copper, zinc and lead deposits. Silver exploration companies with pure-play silver projects are therefore rare, and typically trade at a premium to gold equities.
Companies with polymetallic mines that produce silver as a byproduct are also highly desirable as an investment, especially during the current period of falling silver mine production.
Industrial demand for silver, particularly photovoltaics, is heading up, and should get another lift if and when the trade war with China is put to rest. Investment demand for silver also looks solid, with no end in sight to the low-interest-rate policy direction of central banks.
Add higher demand to shrinking supply, lower grades and less silver byproduct credits from falling lead and zinc mine production, we see a floor forming under silver prices, evidenced by a year-to-date gain of 8.6%.
Gold prices are holding up very well in the face of a phase one trade deal with China, a continued strong dollar and higher interest rates in the US then elsewhere. At Ahead of the Herd, we do not believe the gold price is going to fallquite the opposite actually.
During the last 20 years the gold-to-silver ratio has been 60:1. Which makes the current ratio of 86 very high historically, 47:1 over the twentieth century, and nearly 50% above the 20-year average of the twenty-first.
“Come on, Silver! Let’s go, big fellow! Hi–yo, Silver! Away!” Lone Ranger
Hi-yo silver, away. Indeed.
Richard (Rick) Mills, AheadoftheHerd.com, lives on a 160-acre farm in northern British Columbia. Richard’s articles have been published on over 400 websites, including: Wall Street Journal, USA Today, National Post, Lewrockwell, Montreal Gazette, Vancouver Sun, CBSnews, Huffington Post, Beforeitsnews, Londonthenews, Wealthwire, Calgary Herald, Forbes, Dallas News, SGT report, Vantagewire, India Times, Ninemsn, Ib times, Businessweek, Hong Kong Herald, Moneytalks, SeekingAlpha, BusinessInsider, Investing.com, MSN.com and the Association of Mining Analysts.
Disclosure: 1) Statements and opinions expressed are the opinions of Rick Mills and not of Streetwise Reports or its officers. Rick Mills is wholly responsible for the validity of the statements. Streetwise Reports was not involved in the content preparation. Rick Mills was not paid by Streetwise Reports LLC for this article. Streetwise Reports was not paid by the author to publish or syndicate this article. 2) This article does not constitute investment advice. Each reader is encouraged to consult with his or her individual financial professional and any action a reader takes as a result of information presented here is his or her own responsibility. By opening this page, each reader accepts and agrees to Streetwise Reports’ terms of use and full legal disclaimer. This article is not a solicitation for investment. Streetwise Reports does not render general or specific investment advice and the information on Streetwise Reports should not be considered a recommendation to buy or sell any security. Streetwise Reports does not endorse or recommend the business, products, services or securities of any company mentioned on Streetwise Reports. 3) From time to time, Streetwise Reports LLC and its directors, officers, employees or members of their families, as well as persons interviewed for articles and interviews on the site, may have a long or short position in securities mentioned. Directors, officers, employees or members of their immediate families are prohibited from making purchases and/or sales of those securities in the open market or otherwise from the time of the interview or the decision to write an article until three business days after the publication of the interview or article. The foregoing prohibition does not apply to articles that in substance only restate previously published company releases.
Charts and graphics provided by the author.
Legal Notice/Disclaimer: Ahead of the Herd newsletter, aheadoftheherd.com, hereafter known as AOTH. Please read the entire Disclaimer carefully before you use this website or read the newsletter. If you do not agree to all the AOTH/Richard Mills Disclaimer, do not access/read this website/newsletter/article, or any of its pages. By reading/using this AOTH/Richard Mills website/newsletter/article, and whether or not you actually read this Disclaimer, you are deemed to have accepted it. Any AOTH/Richard Mills document is not, and should not be, construed as an offer to sell or the solicitation of an offer to purchase or subscribe for any investment. AOTH/Richard Mills has based this document on information obtained from sources he believes to be reliable but which has not been independently verified. AOTH/Richard Mills makes no guarantee, representation or warranty and accepts no responsibility or liability as to its accuracy or completeness. Expressions of opinion are those of AOTH/Richard Mills only and are subject to change without notice. AOTH/Richard Mills assumes no warranty, liability or guarantee for the current relevance, correctness or completeness of any information provided within this Report and will not be held liable for the consequence of reliance upon any opinion or statement contained herein or any omission. Furthermore, AOTH/Richard Mills assumes no liability for any direct or indirect loss or damage or, in particular, for lost profit, which you may incur as a result of the use and existence of the information provided within this AOTH/Richard Mills Report. AOTH/Richard Mills is not a registered broker/financial advisor and does not hold any licenses. These are solely personal thoughts and opinions about finance and/or investments no information posted on this site is to be considered investment advice or a recommendation to do anything involving finance or money aside from performing your own due diligence and consulting with your personal registered broker/financial advisor. You agree that by reading AOTH/Richard Mills articles, you are acting at your OWN RISK. In no event should AOTH/Richard Mills liable for any direct or indirect trading losses caused by any information contained in AOTH/Richard Mills articles. Information in AOTH/Richard Mills articles is not an offer to sell or a solicitation of an offer to buy any security. AOTH/Richard Mills is not suggesting the transacting of any financial instruments but does suggest consulting your own registered broker/financial advisor with regards to any such transactions.
The markets opened with a bang on the first trading day of the year.
US equity indices followed their global counterparts. The gains came after President Trump said that he would be signing a trade deal with China on the 15th of January. Following this, negotiations will continue for the second phase of the deal.
Euro Eases Off a 4-Month High
The euro was declining on Thursday as the markets reopened after the holiday week. Economic data on the day saw the manufacturing PMI numbers for December.
Data from IHS Markit showed that manufacturing PMI rose slightly to 46.3 from 45.9 in November, beating estimates.
EURUSD Back at Support
The currency pair’s retreat saw prices retesting the price level of 1.1193 – 1.1177 level. If support is formed here, then we anticipate another leg to the upside. But, if the support fails to hold, then we expect the declines to push lower. EURUSD could be at risk of testing the lower support at 1.1131.
Sterling Gives Up Gains
The pound sterling is trading lower, giving back most of its gains from the week before. The monthly manufacturing PMI report saw activity rising slightly to 47.5 from 47.4 in November. The data continues to indicate weak sentiment in the UK’s manufacturing sector.
GBPUSD Likely to Stay Range-Bound for the Moment
The currency’s decline will likely see a shift to sideways trading in the near term. With GBPUSD trading within 1.3226 and 1.3100, a breakout from this level is needed.
The bias remains mixed for the moment. However, to the downside, the lower support at 1.2960 will likely come into play. To the upside, GBPUSD will face resistance off 13 Dec highs at 1.3491.
Gold’s Bullish Momentum Holds for Now
The precious metal continued its surge with prices rising to fresh highs of 1527 on an intraday basis. The gains come despite the equity markets rising as well. Positive news reports on the China trade deal also failed to keep prices in check.
XAUUSD Could Come Under Risk of a Correction
The current price action indicates that there is scope for prices to correct lower. To the upside, the rally will be capped at 1534. To the downside, the price level at 1514 will act as initial support. A breakdown below this level will likely push prices lower. The next lower support is at 1483.
USD ends the week firmly higher as a worrying escalation in tensions between the US and Iran has seen equities under pressure and USD higher on safe-haven inflows. Looking ahead today, we have the ISM manufacturing reading for December followed by the December FOMC meeting minutes. However, the impact of these might be muted in the wake of geopolitical developments. USD index trades 96.69 last.
EUR Lower
EURUSD has come under heavy selling pressure today in light of the rally in USD. Domestic data weakness over the week has also weighed on EUR with a slew of EZ member-states seeing weak readings.
Both German and eurozone manufacturing PMIs came in below expectations earlier in the week. EURUSD trades 1.1142 last, back below the 1.1166 level for now.
GBP Down
GBPUSD has also been lower today as the theme of a stronger USD dominates the final trading day of the week. Earlier in the week, UK manufacturing data was better than expected.
However, the sector remains in negative territory. For now, focus remains on Brexit negotiations which are due to move into the next phase at the end of the move. GBPUSD trades 1.3078 last, still above 1.2967 as of writing.
SPX500 Retreats
Risk assets have come under heavy selling pressure this morning following reports that the US has killed the top Iranian general in a drone strike overnight. The move has greatly increased fears of a full-scale military conflict with Iran declaring that it will seek revenge on the US. SPX500 trades 3224.43 last.
Gold Up, JPY Down
Safe havens have had a mixed day today. While gold has been higher against USD, JPY has been weaker given the extent of the rally in USD and the preference to use the greenback as a safe haven at this point.
XAUUSD trades 1545.81 last, rallying firmly above the 1522.75 level now. USDJPY trades 108.12 last, with price rallying back up off the recent 107.91 lows.
Crude Rallies on Middle East War Fears
Oil prices have been firmly higher today. Despite the moves lower in risk assets, the prospect of further military conflict in the Middle East raises supply concerns, keeping crude prices supported here.
Later today, traders will get the delayed EIA inventories report which is expected to show a further drawdown in US crude stores and should send oil higher still. Crude trades 63.30 last.
Loonie Holding Ground
USDCAD has managed to trade in the green today. Despite the rally in crude prices, it seems that strength in USD is taking center stage today. Canadian manufacturing data released this week showed the sector plummeting to four-month lows last month which is also weighing on CAD. USDCAD trades 1.2988 last.
AUD Down
AUDUSD has been heavily lower today as the sad story of the bushfires in Australia raises fears over damage to the economy following the massive damage suffered b the environment. The rally in USD is adding further pressure here with AUDUSD trading .6936 last, nearing support at the .6926 level.
Sector expert Bob Moriarty takes a look at drivers in the bull market and sees a bear in the wings.
While I happen to be a giant fan of the Daily Sentiment Index (DSI), I also use a bunch of other signals. The DSI is the single best indicator I’ve found but there are dozens of other measures of investor sentiment. If you are a contrarian, you search constantly for some way of figuring out what investors are thinking.
Investing at a profit is actually simple. The mob is always wrong. Always wrong. Figure out what the mob is thinking and do the opposite.
The DSI for the S&P and the NASDAQ has been hovering around the 8590 range for the past two months. That’s not a screaming signal, such as I wrote about a year ago when the market crashed. However, a lot of other indicators are indicating major problems ahead.
In mid-November the stock market rally that began in March 2009 became the best performing, as well as the longest, bull market since World War II. It’s gone higher since then, touching 3,245 on the S&P late last week. As of Friday, Dec. 27, the NASDAQ had been up ten days in a row. That’s the kind of move that gores bulls.
I tried to make a point in my last book that markets go up and markets go down. That seems both simple and obvious, but investors tend to believe they can invest using a rear view mirror. They cannot.
Bull markets breed bear markets. When you have the longest and best performing bull market in history, it’s both illogical and poor investing to bet on those conditions to continue. We will have a bear market. It’s not a question of if, just a question of when.
I believed the crash would begin in October and actions of the Fed indicated that they, too, saw a crash around the corner. On Sept. 16, the Fed panicked when the Overnight Repo rate shot up to over 10%. They have poured hundreds of billions of dollars into the Repo market in an effort to provide liquidity to an increasingly unstable market, and ballooned their balance sheet by $406 billion.
The Fed is not calling their pumping money into the system quantitative easing (QE) 4 or QE Infinity. They are calling it a duck. Because if it walks like a duck and quacks like a duck, it’s really QE. The Repo market is nothing but another canary in the coal mine. The canaries are dropping like flies.
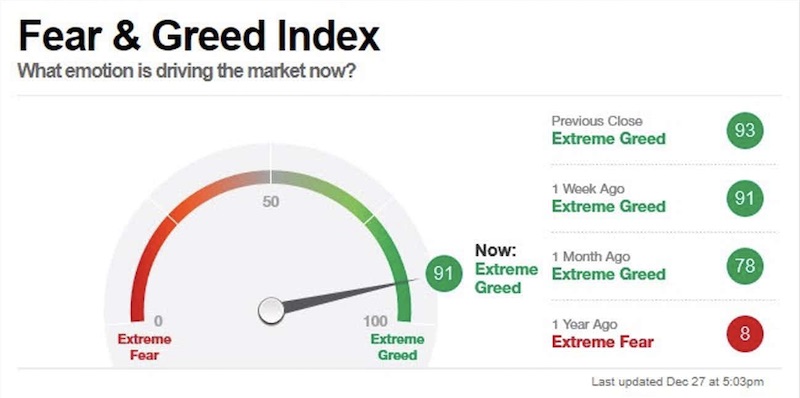
When markets bottom, the level of fear is palpable. But when markets top, complacency rules. One year ago when the markets took a tumble, the fear index was at 8, showing extreme fear. A few days ago we had a reading of 93, saying extreme greed or complacency. That’s more extreme than the market bottom I called correctly one year ago.
The price of gold and silver often run contrary to that of the general stock market, but ignoring all the danger signals coming from the COTs, the metals continue higher.
Something has changed: the central banks are buying more gold than they have in years. As the Dutch central bank has spoken on the record, when the system fails, gold will help provide a solution. “If the entire system collapses, the gold stock provides a collateral to start over. Gold gives confidence in the power of the central bank’s balance sheet. That gives a safe feeling.”
The world finds itself awash in $250 trillion in debt, which anyone who can add and subtract will understand can never be repaid. We have more bubbles forming than that of a six-year-old taking a bubble bath. One day soon those bubbles will begin to burst.
I’ve said for years that the key to investing success is to buy when an investment is cheap and to sell when it is dear. Virtually all asset classes are absurdly priced. The stock market earned more in 2012 than today, yet has doubled. When complacency is so common that the greed index is more opposite what the fear index was on December 24, 2018, a crash is nigh.
Be very, very fearful. One measure of the any top or bottom is that Mister Market does whatever it needs to do to cost the greatest number of people the most money. Few pundits see what is coming around the corner. That’s when tops happen.
As the everything bubble pops, the financial system will destroy most investors because they are unprepared. When you become greedy, get ready for a world of hurt.
Bob Moriarty founded 321gold.com, with his late wife, Barbara Moriarty, more than 16 years ago. They later added 321energy.com to cover oil, natural gas, gasoline, coal, solar, wind and nuclear energy. Both sites feature articles, editorial opinions, pricing figures and updates on current events affecting both sectors. Previously, Moriarty was a Marine F-4B and O-1 pilot with more than 832 missions in Vietnam. He holds 14 international aviation records.
Disclosure: 1) Statements and opinions expressed are the opinions of Bob Moriarty and not of Streetwise Reports or its officers. Bob Moriarty is wholly responsible for the validity of the statements. Streetwise Reports was not involved in the content preparation. Bob Moriarty was not paid by Streetwise Reports LLC for this article. Streetwise Reports was not paid by the author to publish or syndicate this article. 2) This article does not constitute investment advice. Each reader is encouraged to consult with his or her individual financial professional and any action a reader takes as a result of information presented here is his or her own responsibility. By opening this page, each reader accepts and agrees to Streetwise Reports’ terms of use and full legal disclaimer. This article is not a solicitation for investment. Streetwise Reports does not render general or specific investment advice and the information on Streetwise Reports should not be considered a recommendation to buy or sell any security. Streetwise Reports does not endorse or recommend the business, products, services or securities of any company mentioned on Streetwise Reports. 3) From time to time, Streetwise Reports LLC and its directors, officers, employees or members of their families, as well as persons interviewed for articles and interviews on the site, may have a long or short position in securities mentioned. Directors, officers, employees or members of their immediate families are prohibited from making purchases and/or sales of those securities in the open market or otherwise from the time of the interview or the decision to write an article until three business days after the publication of the interview or article. The foregoing prohibition does not apply to articles that in substance only restate previously published company releases.
US economic data improved in the last couple of weeks of past year. Will the SP500 stock index continue rising?
US data lately were positive on balance: personal spending and income rose more than expected in November, goods trade deficit narrowed when widening was expected, and Case-Shiller home price index for 20 major metropolitan areas ticked up to 2.2% over year in October from a 2.1% rise in September. US personal income advanced 0.5% over month in November 2019 when 0.3% growth was forecast, and consumer spending rose 0.4% over month when steady 0.3% growth was expected. The trade deficit on goods narrowed to $63.19 billion in November 2019 from $66.8 billion in the previous month when a rise to $68.75 billion was forecast. On the negative side orders for durable goods fell 2% in November, however orders excluding transportation were unchanged while orders excluding defense rose 0.8% over month after stagnant October. At the same time both new home and pending home sales rose over month in November. Against this background of positive dynamics the achievement of interim trade agreement on a phase one deal between the US and China provided additional support to risk appetite. Continuing economic growth is bullish for US equities market.
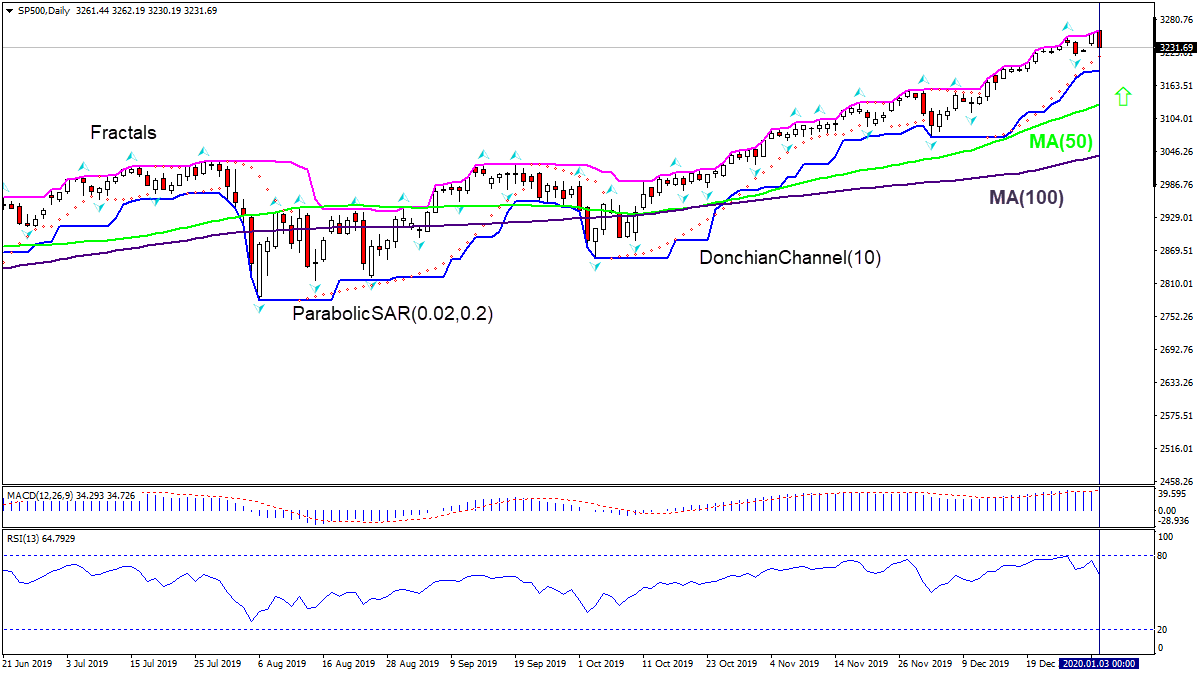
On the daily timeframe SP500: D1 has pulled back after closing at record. Price is above both fifty-day and hundred-day moving averages MA(50) and MA(100) which are both rising.
The Donchian channel indicates uptrend: it is widening up.
The MACD indicator has risen above the signal line and the gap is widening, this is a bullish signal.
The RSI oscillator was close to overbought zone but hasn’t crossed into it.
We believe the bullish momentum will continue after the price breaches above the upper Donchian boundary at 3262.19. This level can be used as an entry point for placing a pending order to buy. The stop loss can be placed below the lower Donchian boundary at 3188.04. If the price meets the stop-loss level (3188.04) without reaching the order (3262.19) we recommend cancelling the order: the market sustains internal changes which were not taken into account.
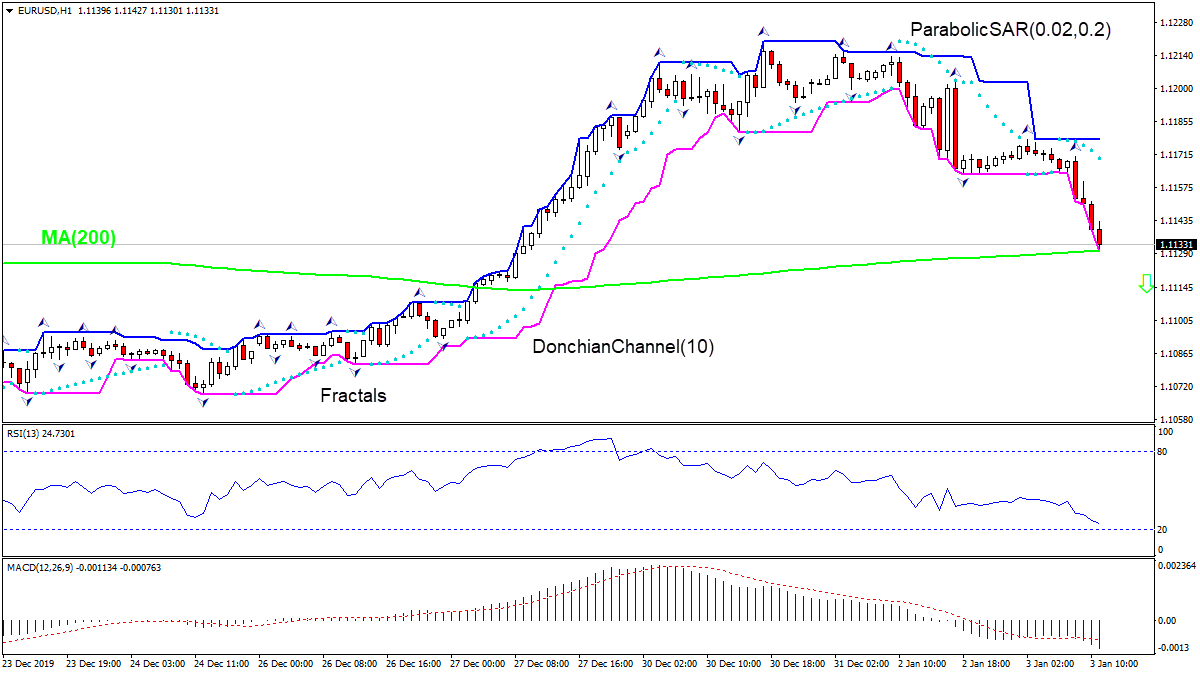
German unemployment rose more than expected in December. Will the EURUSD continue declining?
On 1-hour timeframe EURUSD: H1 is in downtrend, testing the 200-period moving average MA(200) which is level. The RSI indicator is about to reach the oversold zone.
By OilPrice.com – Nigeria has long been known for its oil riches.
Angola has too, but decades of entrenched corruption have chased foreign investors away.
Now Namibia is joining the African oil conversation with one of the most oil-friendly regimes on the continent. It’s offering 5% royalties on what might just be a very productive shale play in Reconnaissance Africa’s (RECO.V) Kavango Basin.
Emerging markets are where oil upside might be found these days but navigating them is a challenge.
Nigeria: How To Push Away Investors
Take Nigeria, for instance.
As Africa’s largest producer of oil, Nigeria has outsized status in the hydrocarbons world. But the party is coming to an end from an investor’s standpoint.
Nigeria is home to about 37 billion barrels in oil reserves. And while it’s got some 32 active oil rigs out there, only 81 wells were completed last year – down from 141 in 2014.
Since oil prices started tumbling in 2014, the government has been taking more from oil companies, with back taxes and new legislation. Now, it wants majors Chevron, Shell and French Total SA to pay them around $62 billion. It claims in was short-changed under a revenue-sharing agreement dating back to the 1990s.
Chevron (NYSE:CVX) is seeking to sell several Nigerian oilfields, and it isn’t the first: Exxon and Shell (NYSE:RDS.A) have both been reducing their footprint in the country.
And it might get worse.
Now, Nigeria is proposing new legislation that would increase taxation on the oil industry. The bill would add another 3-10 percent in royalty rates at oil prices between $50 and $80 per barrel. Nigeria’s current system gives Nigeria between 60 percent and 70 percent of all deepwater revenues, which includes taxes, royalties, along with state-run Nigerian National Petroleum Corporation’s share of production.
Angola: Reforms That Might Not Be Enough
Angola, too, is a tough sell right now. Even though it’s Africa’s second-largest producer, it’s been mired in decades of highly entrenched corruption, and while there is a new regime in power and reforms are on the books, investors aren’t 100-percent sold on the idea.
Angola is hoping to sell stakes in state-run Sonangol oil company and a string of other energy companies. To do that, it’s banking on major economic reforms to attract investors and bring in much-needed cash.
No one’s forgotten the gross mismanagement of Sonangol under its previous leadership, though, so the Angolan government is going to have to make people believe things have changed. Sonangol has a history it needs to overcome.
The goal is an IPO for Sonangol in 2022. Beyond that, the government is also hoping to lure investors into stakes in Puma Energy, the China-Sonangol oil venture, and the Ivory Coast SIR refinery. But it’s only been two years since we saw a change of regime in Angola, and investors don’t seem thoroughly convinced just yet.
In 2017, Joao Lourenco took power, ending the four-decade power play of Jose Eduardo dos Santos, along with his daughter’s destructive leadership of Sonangol. But two years may not be enough time to convince investors.
The government has made it easier for investors to repatriate money via commercial banks; it’s made it possible to invest in the sector without a local partner; and it cut taxes on some oilfields by 50%, creating an independent body for managing oil and gas concessions. The first litmus test will likely come later this year with the attempted sale of stakes in the SIR refinery.
But in the meantime, some bigger potential has emerged on the continent:
Namibia: Starting From Zero
Namibia – a country that has never produced a barrel – is the newest venue reaching the investment radar screen.
That’s because it has potential for new discoveries at a time when they are increasingly hard to come by.
Even better when it’s in an investor-friendly regime.
The so-called “Land of the Brave” has has an oil and gas friendly regime with only 5% royalties.
That’s why Exxon (NYSE:XOM) recently acquired an additional 7 million net acres from the government for a block extending from the shoreline to about 135 miles offshore in water depths up to 13,000 feet, with exploration activities to begin by the end of this year.
What Exxon’s banking on is that Namibia, which according to theory once fit together with Brazil, shares the same geology as Brazil’s pre-salt basins, Santos and Campos, which have already proved resource-rich, according to Deloitte.
But there’s also something onshore that has good potential.
Shale, and a basin that’s similar in size to the Eagle Ford basin in Texas.
Welcome to the Kavango Basin.
Namibia’s Kavango Basin is part of the Karoo SuperGroup geology, and it’s also considered to have the same depositional environment as Shell’s Whitehill Permian shale play in South Africa.
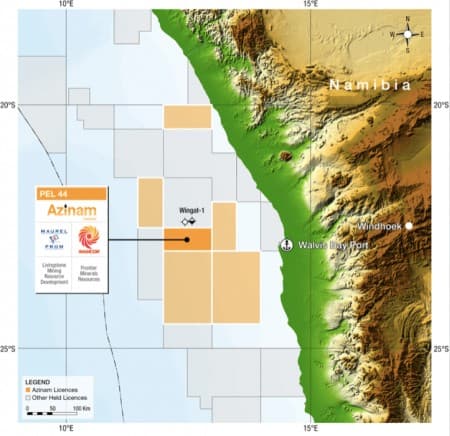
Kavango is a 6.3-million-acre basin that potentially holds undeveloped shale and conventional plays. The entire basin is owned by a junior company called Reconnaissance Energy Africa (RECO.V) that recently received a 90% interest in the Petroleum Exploration Permit for the Kavango basin. The remaining 10% is owned by the Namibian state petroleum company.
The exploration permit is for 25,000 square kilometers (6.3 million acres). Usually, many companies hold the rights to such a large area whereas the Kavango is held by one company, Reconnaissance Energy Africa.
The reason for Reconnaissance Energy Africa (RECO.V) to take a chance on this is the fact that Kavango likely holds similar geology, deposited by the same Permian seaway, as Shell’s massive Permian shale play in South Africa, one of the top 10 shale plays in the world.
Recon is targeting for the same Permian shales at the lower portion of the Karoo Supergroup.
So far, Recon’s interpretation suggests that Kavango could be a big shale play in the Karoo Supergroup of rocks.
When it comes to exploration, Africa is one of the final frontiers for oil investors. And if it’s a junior explorer who makes a discovery and ends up sitting on a viable shale play, that becomes leverage for investors.
Not only do they own the entire basin, but Reconnaissance Energy Africa (RECO.V) also has a 4-year exploration license for the basin, leading to a 25-year production license if there is a commercial production discovery.
The first well at Kavango is planned to be drilled in the second quarter of 2020, and this junior explorer Recon (RECO.V) is hoping for good results.
Other companies looking to find the next oil frontier:
Halliburton (NYSE:HAL) is one of the largest oilfield services companies in the world. The company has secured its place in the oil and gas industry. But it didn’t happen overnight. The oilfield services sector is highly competitive and ripe with innovation. In order to stay ahead, companies must be on the absolute cutting edge of technology. And that’s exactly what Halliburton has done.
Schlumberger (NYSE:SLB) posted strong financials for the second quarter, with both revenue and earnings beating expectations. The oilfield services giant was hit hard by the oil market downturn, but will be one of the biggest beneficiaries of the rebound. The international market is set to improve, meaning Schlumberger will profit on the shale drilling rush, but also on more drilling around the world.
Husky Energy Inc (TSX:HSE): This integrated oil and gas company out of Western Canada lives up to its name, fierce and driven for success. It’s already got a presence in some of the most well-known oil regions on the planet, but it hasn’t stopped there. It’s even positioned itself in Europe, Africa and as remote as the South China Sea.
Suncor Energy (TSX:SU): As one of the biggest names in energy, Suncor has adopted a number of high tech solutions for finding, pumping, storing, and delivering its resources. While its primarily based out of North America, its assets in Africa and the Middle East should not be ignored. Though the oil downturn has weighed on the company’s share price this year, many analysts are pointing to a turnaround, from which Suncor is likely to benefit.
Tourmaline Oil Corp (TSX:TOU) is another Canadian resource producer focusing on exploration, production, development and acquisition within Western Canadian Sedimentary Basin. The company is in possession of an extensive undeveloped land position with long-term growth opportunities and a large multi-year drilling inventory. Tourmaline’s strong leadership make the company a promising pick for investors looking to take advantage of the tremendous Canadian oil opportunities which are due for a strong rebound as oil prices inch higher.
Imperial Oil (TSX:IMO) still has some of the lowest cost producing oil sands in Canada and that is going to pay off as oil prices continue to rise and new tech breakthroughs bring breakeven prices even lower. The management is well known for being conservative, but that certainly shouldn’t put investors off in a time when recovery is the buzzword of the day and consistency is sure to be rewarded.
Gibson Energy (TSX:GEI): has a long history in Canada’s oil and gas game. Established in 1953, Gibson knows the industry inside and out. The company has a diverse portfolio which includes transportation, storage, processing, marketing and distribution of oil, condensates, oilfield waste, refined products and natural gas. With Gibson’s huge array of assets and its multi-platform sales strategies, investors look to Gibson with confidence.
**IMPORTANT! BY READING OUR CONTENT YOU EXPLICITLY AGREE TO THE FOLLOWING. PLEASE READ CAREFULLY**
Forward-Looking Statements. Statements contained in this document that are not historical facts are forward-looking statements that involve various risks and uncertainty affecting the business of Recon. Such statements can be generally, but not always, identified by words such as “expects”, “plans”, “anticipates”, “intends”, “estimates”, “forecasts”, “schedules”, “prepares”, “potential” and similar expressions, or that events or conditions “will”, “would”, “may”, “could” or “should” occur. All estimates and statements with respect to Recon’s operations, its plans and projections, oil prices, recoverable oil, production targets, production and other operating costs and likelihood of oil recoverability are forward-looking statements under applicable securities laws and necessarily involve risks and uncertainties including, without limitation: risks associated with oil and gas exploration, development, exploitation and production, geological risks, marketing and transportation, availability of adequate funding, volatility of commodity prices, imprecision of reserve and resource estimates, environmental risks, competition from other producers, government regulation, dates of commencement of production and changes in the regulatory and taxation environment. Actual results may vary materially from the information provided in this document, and there is no representation that the actual results realized in the future will be the same in whole or in part as those presented herein. Other factors that could cause actual results to differ from those contained in the forward-looking statements are also set forth in filings that Recon and its technical analysts have made, We undertake no obligation, except as otherwise required by law, to update these forward-looking statements except as required by law.
Exploration for hydrocarbons is a speculative venture necessarily involving substantial risk. Recon’s future success will depend on its ability to develop its current properties and on its ability to discover resources that are capable of commercial production. However, there is no assurance that Recon’s future exploration and development efforts will result in the discovery or development of commercial accumulations of oil and natural gas. In addition, even if hydrocarbons are discovered, the costs of extracting and delivering the hydrocarbons to market and variations in the market price may render uneconomic any discovered deposit. Geological conditions are variable and unpredictable. Even if production is commenced from a well, the quantity of hydrocarbons produced inevitably will decline over time, and production may be adversely affected or may have to be terminated altogether if Recon encounters unforeseen geological conditions. Adverse climatic conditions at such properties may also hinder Recon’s ability to carry on exploration or production activities continuously throughout any given year.
DISCLAIMERS
ADVERTISEMENT. This communication is not a recommendation to buy or sell securities. Oilprice.com, Advanced Media Solutions Ltd, and their owners, managers, employees, and assigns (collectively “the Company”) may in the future be paid by the profiled company to disseminate future communications if this communication proves effective. In this case the Company has not been paid for this article. But the potential for future compensation is a major conflict with our ability to be unbiased, more specifically:
This communication is for entertainment purposes only. Never invest purely based on our communication. We have not been compensated but may in the future be compensated to conduct investor awareness advertising and marketing for TSXV:RECO. Therefore, this communication should be viewed as a commercial advertisement only. We have not investigated the background of the company. Frequently companies profiled in our alerts experience a large increase in volume and share price during the course of investor awareness marketing, which often end as soon as the investor awareness marketing ceases. The information in our communications and on our website has not been independently verified and is not guaranteed to be correct.
SHARE OWNERSHIP. The owner of Oilprice.com owns shares of this featured company and therefore has an additional incentive to see the featured company’s stock perform well. The owner of Oilprice.com will not notify the market when it decides to buy more or sell shares of this issuer in the market. The owner of Oilprice.com will be buying and selling shares of this issuer for its own profit. This is why we stress that you conduct extensive due diligence as well as seek the advice of your financial advisor or a registered broker-dealer before investing in any securities.
NOT AN INVESTMENT ADVISOR. The Company is not registered or licensed by any governing body in any jurisdiction to give investing advice or provide investment recommendation.
ALWAYS DO YOUR OWN RESEARCH and consult with a licensed investment professional before making an investment. This communication should not be used as a basis for making any investment.
PAST PERFORMANCE IS NOT INDICATIVE OF FUTURE RESULTS. Investing is inherently risky. Don’t trade with money you can’t afford to lose. This is neither a solicitation nor an offer to Buy/Sell securities. No representation is being made that any account will or is likely to achieve profits similar to those discussed.
The EUR/USD currency pair has been declining. The trading instrument has set new local lows. At the moment, EUR/USD quotes are testing local support of 1.11650. Round level of 1.12000 is the nearest resistance. The current technical pattern signals a further correction of the EUR/USD currency pair. Sentiment in financial markets has improved amid prospects for a settlement of the trade conflict between Washington and Beijing. Donald Trump set January 15 as the date of signing the phase one trade deal with China. We expect important economic releases. We recommend opening positions from key levels.
The Economic News Feed for 03.01.2020:
– Labor market report in Germany at 10:55 (GMT+2:00);
– ISM manufacturing PMI in the US at 17:00 (GMT+2:00).
The price has fixed below 100 MA, which signals the power of sellers.
The MACD histogram is in the negative zone, but above the signal line, which gives a weak signal to sell EUR/USD.
Stochastic Oscillator is in the neutral zone, the %K line is below the %D line, which indicates the bearish sentiment.
Trading recommendations
Support levels: 1.11650, 1.11400, 1.11100
Resistance levels: 1.12000, 1.12350
If the price fixes below 1.11650, further correction of the EUR/USD quotes is expected. The movement is tending to 1.11400-1.11200.
An alternative could be the growth of the EUR/USD currency pair to 1.12250-1.12500.
The GBP/USD currency pair
Technical indicators of the currency pair:
Prev Open: 1.32482
Open: 1.31367
% chg. over the last day: -0.81
Day’s range: 1.31054 – 1.31602
52 wk range: 1.1959 – 1.3516
The bearish sentiment is prevailing on the GBP/USD currency pair. During yesterday’s and today’s trading sessions, the drop in quotes exceeded 130 points. The trading instrument has reached local lows. The British pound is currently consolidating in the range of 1.31000-1.31600. The GBP/USD currency pair has the potential for further decline. Market participants expect up-to-date information on Brexit. Positions should be opened from key levels.
At 11:30 (GMT+2:00), construction PMI will be published in the UK.
Indicators do not give accurate signals: the price has crossed 100 MA.
The MACD histogram is in the negative zone and continues to decline, which indicates the bearish sentiment.
Stochastic Oscillator has reached the oversold zone, the %K line has crossed the %D line. There are no signals at the moment.
Trading recommendations
Support levels: 1.31000, 1.30550, 1.30000
Resistance levels: 1.31600, 1.32250
If the price fixes below the round level of 1.31000, further decline in GBP/USD quotes is expected. The movement is tending to 1.30600-1.30400.
An alternative could be the growth of the GBP/USD currency pair to 1.32000-1.32300.
The USD/CAD currency pair
Technical indicators of the currency pair:
Prev Open: 1.29858
Open: 1.29851
% chg. over the last day: -0.01
Day’s range: 1.29755 – 1.29993
52 wk range: 1.2949 – 1.3566
The USD/CAD currency pair has become stable after a continuous fall. The trading instrument is currently consolidating. Unidirectional trend is not observed. The key range is 1.29600-1.30100. Demand for the Canadian dollar is still at a fairly high level amid positive dynamics of oil prices. We do not exclude a further decline in the USD/CAD currency pair. We recommend opening positions from key levels.
The news feed on the Canada’s economy is calm.
Indicators do not give accurate signals: the price has crossed 50 MA.
The MACD histogram is near the 0 mark. There are no signals at the moment.
Stochastic Oscillator is near the overbought zone, the %K line has crossed the %D line. There are no accurate signals.
Trading recommendations
Support levels: 1.29600, 1.29200
Resistance levels: 1.30100, 1.30500, 1.30800
If the price fixes below the support level of 1.29600, a further drop in the USD/CAD quotes is expected. The movement is tending to 1.29300-1.29100.
An alternative could be the growth of the USD/CAD currency pair to 1.30400-1.30600.
The USD/JPY currency pair
Technical indicators of the currency pair:
Prev Open: 108.727
Open: 108.558
% chg. over the last day: -0.14
Day’s range: 108.005 – 108.630
52 wk range: 104.45 – 113.53
There are aggressive sales on the USD/JPY currency pair. During yesterday’s and today’s trading session, the drop in quotes exceeded 60 points. At the moment, the trading instrument is testing a round level of 108.000. The 108.300 mark is already a “mirror” resistance. Demand for “safe haven” currencies is still high due to rising tensions in the Middle East. The USD/JPY quotes have the potential for further decline. Today, we recommend paying attention to economic reports from the US. Positions should be opened from key levels.
Japan’s financial markets are closed due to the holiday.
Indicators signal the power of sellers: the price has fixed below 50 MA and 100 MA.
The MACD histogram is in the negative zone and below the signal line, which gives a strong signal to sell USD/JPY.
Stochastic Oscillator is in the neutral zone, the %K line is above the %D line, which indicates the bullish sentiment.
Trading recommendations
Support levels: 108.000, 107.600
Resistance levels: 108.300, 108.500, 108.850
If the price fixes below the round level of 108,000, a further drop in the USD/JPY quotes is expected. The movement is tending to 107.700-107.500.
An alternative could be the growth of the USD/JPY currency pair to 108.500-108.700.
The US dollar retreated from local lows and started gaining strength against major currencies. The dollar index (#DX) closedin the green yesterday (+ 0.49%). Support for the US currency was provided by sudden clarity in the trade relations between the USA and China. Keep in mind that the US President D. Trump confirmed that the conclusion of the first stage of the negotiations will be held on January 15.
Mixed economic data from the US was also released yesterday. The number of initial jobless claims fell to 222K, while experts expected 225K. However, the manufacturing activity index (PMI) in the US fell in December to 52.4 instead of the forecasted value of 52.5.
Business activity indices for the manufacturing sectors of Germany and the UK were also published yesterday. The index of business activity in the manufacturing sector (PMI) in Germany amounted to 43.7 in December and was better than the predicted value of 43.4. The index of business activity in the manufacturing sector (PMI) in the UK amounted to 47.5 in December and turned out to be worse than the forecasted value of 47.6.
Prices for oil continue to rise due to tensions in the Middle East. At the moment, WTI crude oil futures are testing $62.95 per barrel. At 18:00 (GMT+2:00), a report on the crude oil inventories will be published.
Market Indicators
The US stock market is in a bullish mood: #SPY (+0,94%), #DIA (+1,23%), #QQQ (+1,67%).
Yields on 10-year US government bonds declined. At the moment, the indicator is at 1.83-1.84%.
The Economic News Feed for 03.01.2020:
– Change in the number of unemployed in Germany – 10:55 (GMT+2:00);
– Business activity index in the construction sector (PMI) of the UK – 11:30 (GMT+2:00);
– ISM’s business activity index in the manufacturing sector (PMI) of the USA – 17:00 (GMT+2:00).