By IFCMarkets
Improving trade data bullish for HK50
Hong Kong’s trade and current account balances improved more than forecast. Will the HK50 increase continue?
Hong Kong economic data in the last couple of weeks were better than expected: both current account and balance of trade improved more than forecast. The current account surplus increase was bigger in the third quarter of 2019 over same period a year ago than forecast: to HKD 74.45 billion in Q3 of 2019 from HKD 48 billion a year earlier, amounting to 10.3% of the GDP, when HKD 48 billion surplus was expected. And the trade deficit narrowed to HKD 26.2 billion in November from HKD 45 billion a year earlier, instead of HKD 46 billion deficit forecast. Improving trade data are bullish for HK50. Tomorrow the retail sales report will be published. Disappointing retail sales data are a downside risk when a slowing of decline for November is expected.
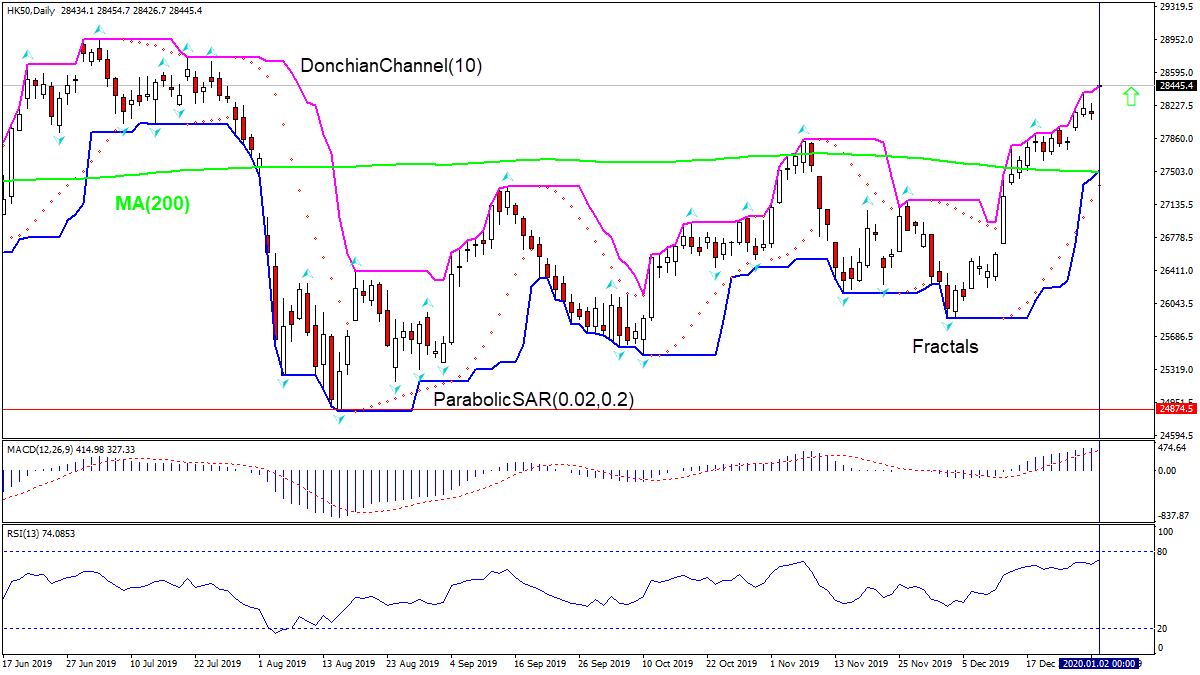
On the daily timeframe HK50: D1 is continuing to gain after a rebound following the decline to 11-month low in the beginning of August.
- The Parabolic indicator gives a buy signal.
- The Donchian channel indicates uptrend: it is tilted upward.
- The MACD indicator has risen above the signal line and the gap is widening, this is a bullish signal.
- The RSI oscillator is close to overbought zone but hasn’t crossed into it yet.
We believe the bullish momentum will continue after the price breaches above the upper Donchian boundary at 28454.7. This level can be used as an entry point for placing a pending order to buy. The stop loss can be placed below the lower Donchian boundary at 27513.40. After placing the pending order the stop loss is to be moved every day to the next fractal low, following Parabolic signals. Thus, we are changing the expected profit/loss ratio to the breakeven point. If the price meets the stop-loss level (27513.4) without reaching the order (28454.7) we recommend cancelling the order: the market sustains internal changes which were not taken into account.
Free Reports:
 Get Our Free Metatrader 4 Indicators - Put Our Free MetaTrader 4 Custom Indicators on your charts when you join our Weekly Newsletter
 Get our Weekly Commitment of Traders Reports - See where the biggest traders (Hedge Funds and Commercial Hedgers) are positioned in the futures markets on a weekly basis.
Technical Analysis Summary
| Order | Buy |
| Buy Stop | Above 28454.7 |
| Stop loss | Below 27513.4 |
Market Analysis provided by IFCMarkets