Euro Zone Struggling Once More with Debt

Source: ForexYard

Though the USD is gaining ground on the euro, the blame lies not on US strength but in euro zone weakness. The EUR failed to break above key resistance levels and promptly dropped as a result, pushing the EUR/USD pair back towards 1.4375 as of this morning.

Economic News

USD – US Dollar Bullish as Euro Zone Struggles with Debt Woes

The US dollar has continued to make gains against most of its currency rivals in trading as we head into this week’s start. Though the USD is gaining ground on the euro, the blame lies not on US strength but in euro zone weakness. The EUR failed to break above key resistance levels and promptly dropped as a result, pushing the EUR/USD pair back towards 1.4375 as of this morning.

The GBP/USD underwent a similar bearish twist, as the pair spiked up over the past week to trade near 1.6385 before coming down gradually this morning, trading right at the 1.6300 price mark at 6:00 GMT. The greenback was also able to push higher versus the Japanese yen, as the island economy continues to struggle with reconstruction efforts meant to stave off further nuclear disasters.

With a light news day ahead, traders will likely be watching the series of speeches being delivered from members of the Federal Open Market Committee (FOMC) as they speak about regulatory reform, risk management and economic outlook. Each of these speeches carries the potential to affect currency values as speculators attempt to analyze any hints at interest rate changes.

EUR – EUR Bearish on Regional Debt Concerns

The euro has turned bearish against most of its currency rivals after the pair failed to breach key resistance levels and then fell on renewed concern over sovereign debt. The EUR/USD has fallen to 1.4375 as of this morning and does not appear to be revealing any signal of correcting back up in the near future. The EUR/JPY has also revealed sudden weakness, reaching down towards 119.13 in today’s early morning trading.

The region continues to grapple with debt concerns from Portugal and Spain, but area-specific shifts in risk appetite have helped drive the EUR’s surge last week. Soaring oil prices also supported the euro as the US dollar came under pressure, but such strength may have overextended the euro and is now applying heavy weights to its value.

With only a minor confidence report expected out of the euro zone, the 17-nation single currency is expected to maintain its current course against its currency rivals in the hours ahead. Tomorrow’s news should be much more affecting on the region’s currency values, but as for today traders may want to look to the USD for market direction.

JPY – JPY Trading Higher as Europe Suffers Strains

The Japanese yen rose against its major counterparts in early Asian deals on Monday. Presently, the yen is trading at 82.88 against the U.S. dollar and 135.07 versus the pound. Against the euro, the yen is trading much higher at 119.13, compared to an early Asian session’s multi-month low of 123.35.

Growing concerns regarding Japan have driven the JPY lower recently amid deteriorating fundamentals out of the island economy. But those weakening fundamentals are being offset by debt concerns out of Europe as the European Monetary Union (EMU) persists in dealing with a burgeoning debt crisis that simply won’t dissipate. For today traders will want to look to the USD for market direction, but so long as Europe continues to fear rising debt out of Spain and Portugal, going long on the yen may continue to remain appealing.

Oil – Crude Oil Price Climbing; Strong USD in its Way

Oil prices have turned upward heading into this week, with the price elevating itself beyond $109 a barrel as of this morning. Continued fighting in Libya is partially behind the sell-resistance among global commodities like oil. Concerns about Japan’s reconstruction, declining production, and ever-present nuclear crisis are also pushing economic fundamentals in a direction favoring the purchase of physical assets.

The only counterforce to enter the market at the start of this week, however, was a resurgent USD versus its main rival, the EUR. If the dollar can continue to make gains, buyers may begin to shift out of oil purchases as they become too expensive. Traders will be eyeing further events in the Middle East this week as the risk of crude oil supply disruptions could continue to spread throughout the region, especially as protests in Syria become more volatile.

Technical News

EUR/USD

In overnight trading the pair dipped below the short term support at 1.4365 and is back above this level at the opening of European trading. Traders should be looking to buy the euro on a dip to the rising trend line from the January low and the 20-day moving average. The two coincide near 1.4300.

GBP/USD

The pair’s weekly low at 1.6225 coincided with the previous trend line off the 2007 high and rising weekly stochastics hint at further gains. As such, the pair could move higher with initial targets at 1.6460 followed by 1.6880.

USD/JPY

Downside momentum is building as the pair is unable make any new highs. A move below 82.80 would target 82.00 with a further move towards the 80.20 level. Resistance is located at 83.50 and 84.00.

USD/CHF

Last week the pair dipped below the 0.8900 level but failed to make a close below it, a signal that this support level may temporarily hold. Rising daily stochastics point to a move higher, potentially to the previous lower channel line off of the October low which comes in today at 0.9070.

The Wild Card

NZD/USD

The pair failed to move above the 0.8000 resistance line and pulled back to 0.7930. A big round number may have a psychological effect on traders and can serve as a resistance or support level. Both weekly and daily stochastics are overbought and a pullback in the pair may be in order before a retest of 0.8000. Forex traders may find buying opportunities at the support level of 0.7830 with a target at the 2008 high at 0.8200.

Forex Market Analysis provided by ForexYard.

© 2006 by FxYard Ltd

Disclaimer: Trading Foreign Exchange carries a high level of risk and may not be suitable for all investors. There is a possibility that you could sustain a loss of all of your investment and therefore you should not invest money that you cannot afford to lose. You should be aware of all the risks associated with Foreign Exchange trading.

Daily Market Review for the 18.04.2011

NZD/USD

Time: 07:30  Rate: 0.7945

Strategy: short

Considerations:

Weekly time frame:

Wolf deviation in the indicators – potential for short in a shorter time range.

As can be seen by the graph bellow:  


Daily time frame:

Opening of the week on the downward graph after a continuous upward movement of 880 pips

There was no third retracement in the upward movement

The resistance point of the high – 0.7980 5 of November 2010 (purple line)

The round resistance point – 0.8000

The level of 127.2 Fibonacci in 0.8018 of the downward movement C-D

As can be seen by the graph bellow:


4 hour time frame:

Short in the breakdown of the candle’s low (black dashed line)

First target the retracement area of 23.6% Fibonacci + round number 0.7800

Second potential retracement target 38.2% Fibonacci 0.7670

As can be seen by the graph bellow:


Potential Trade:

Short in the candle’s low breakdown 0.7920

Stop: 0.8030

First target: 0.7800

Second target: 0.7670

AUD/JPY

Time: 08:30  Rate:8765

Strategy: Short

Daily time frame

Considerations:    

Stop in an important Fibonacci level (161.8%)

Continuous upward movement of 21% without retracement

Reversal Japanese pattern called “black cloud”

As of now, CC150 >100 entrance to short in the condition CC150 <100

Technical retracement target (38.2% Fibonacci) 84.20

As can be seen by the graph bellow:    


4 hour time frame:

CC150 < 0

Enter in the breakdown of 86.85

Completed pattern AB=CD to a short target 85.40 (potential D point)

As can be seen by the graph bellow:


Potential Trade:

Short in the breakdown 86.85 in condition CC150<100 in the daily time frame

Stop over the last high (4 hour time frame)

First target: 86.85

Second target: 84.20  


RISK DISCLAIMER

Forex trading involves high risk. Before any trade, you should consider carefully the investment objectives and the level of risk. The data sent by mail is not necessarily real-time data or precise. Real-Forex is not liable for the losses resulting from the utilization of the data. Real-Forex (Finnocorp Trading Solution Ltd

.) is not liable for losses or damages as a result of reliance on the information provided by e-mail or on the overall data, quotes, charts, signals buy / sell. It is hereby clarified that the investor must be aware of risks involved in trading in financial markets, which is a form of investment that may contain potential risks.

Real-Forex team

Trade like the pro’s with a true ECN Forex broker

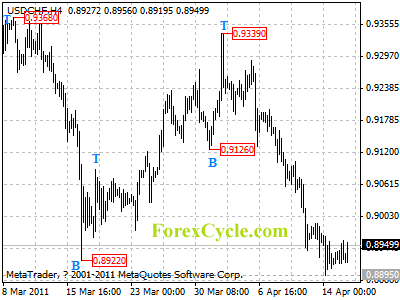
USDCHF remains in downtrend from 0.9339

USDCHF remains in downtrend from 0.9339, and the fall extended to as low as 0.8895, the price action from 0.8895 is treated as minor consolidation of downtrend. Another fall would likely be seen after consolidation, and next target would be at 0.8800 zone. Resistance is at 0.8975, only break above this level will indicate that lengthier consolidation of downtrend is underway, then range trading between 0.8895 and 0.9050 could be seen to follow.

usdchf

Daily Forex Forecast

Lopez Holdings Corporation (LPZ) Makes A Swing Up

Lopez Holdings Corporation which used to be Benpres Holdings Corporation hit the 2nd place in today’s most active stocks in value traded. For those who do not know, this company serves as the holding company of the Lopez family for investments in major development sectors such as broadcasting (ABS-CBN) and cable (Sky Cable); telecommunications (Bayan Tel); power generation and distribution (First Philippine Holdings, Energy Development Corporation); and banking among others.

LPZ which is its stock symbol in the Philippine Stock Exchange went up today by 5.19% to PHP5.67. This gain propelled the breakout from the 1-month symmetrical triangle chart pattern with heavy volume. Based on the size of this of this triangle, we could get a minimum upside target price of PHP6.10 within a month as seen in the chart above.

In the bigger picture, the 1-month symmetrical triangle apparently looks like the handle of a 4-month cup and handle formation. This could also look a like an inverted head and shoulders or even a rectangle pattern for others.  Regardless of what this consolidation may look like, as long as the PHP5.75 resistance gets cleared out, we could get a conservative target price OF PHP6.90. I got this by adding the height of the consolidation to the possible breakout point. However, before it gets to that level, it first needs to clear out the 11-year all-time high of PHP6.60. In case things don’t go well for the stocks, the immediate support could be the 2-month uptrend. If that breaks, the next support could be the 2-year uptrend.

More on LaidTrades.com

USDCHF MACD Divergence

USDCHF is showing bullish divergence on the daily charts. The US Dollar index is also approaching major support so this divergence could be a useful confluent factor for any trader looking to long the Swissie. The current area is aligned with the recent swing low 0.8918 which gave a near 400 pip bounce when hit.

I will personally be looking for one push lower at these levels followed by a price action reversal signal before considering a long. With EURUSD also hitting the 1.4500 level a small corrective move for the Dollar is certainly not out of the question.

Price action early next week should give an indication of the major currencies short term direction as all of the majors are at significant levels.

For further updates check my fx currency trading blog.

U.S. Industrial Production Up 0.8% In March

Industrial production increased 0.8% nationwide in March, according to a report released by the Federal Reserve today. That was higher than the 0.6% increase economists had expected. Manufacturing makes up 75% of the measure, with mining and utility output constituting the remainder. Output of motor vehicle production climbed 3% in March after rising 4.6% in the month prior. All 12 Federal Reserve districts reported a pickup in manufacturing since the March report, with regional industries expanding including auto and auto parts, commercial aircraft and fabricated metal products, the Fed said. Manufacturing industries account for 11% of the economy, and the industry added 17,000 workers in March for the 5th straight monthly gain.

Empire State Manufacturing Index Highest In A Year

The Federal Reserve Bank of New York’s general economic index showed a rise to 21.7 in April from 17.5 in March. Economists had actually expected a decline in activity, with the median estimate for the index to report at 15.5. The so-called Empire State Index covers New York, northern New Jersey, and southern Connecticut, and measures manufacturing strength in the region. Gauges measuring orders, sales, and employment all improved this month, sign American companies are benefiting from increased business investment and the continued strong growth in developing economies. A measure of factory employment rose to 23.1, reaching its highest level since May of 2004, up from 9.1. The measure of new orders climbed to a yearly high of 22.3 from 5.8, and a measure of factory shipments jumped to 28.3 from 1.6. Prices also increased, with the index for raw material costs increasing to 57.7, the highest since August of 2008, from 53.3 in March, and the index for prices received rising to 26.9 from 20.8.

Technical Tips – Spot Gold Testing New All-Time High

By Russell Glaser

Spot gold prices rose to a new all-time high yesterday. On rising momentum, prices should continue to rally with an initial target at $1,500.

Looking at the daily chart, spot gold prices fell back to the early March high at $1,444 before moving higher to a new all-time high at $1,479. Prices could continue to move higher with a target at the big round number of $1,500.

To the downside, the late March lows at $1,410 should prove to be resistive as well as the mid-March low of $1,380, a level that the rising trend line from the July low is encroaching upon. A break below $1,308 would unravel the longs and signal a reversal of the bullish trend.

Gold_Daily


Forex Market Analysis provided by ForexYard.

© 2006 by FxYard Ltd

Disclaimer: Trading Foreign Exchange carries a high level of risk and may not be suitable for all investors. There is a possibility that you could sustain a loss of all of your investment and therefore you should not invest money that you cannot afford to lose. You should be aware of all the risks associated with Foreign Exchange trading.