Forex Update: US Consumer Prices advance in April by 0.4%. Dollar on rise in FX Trade today

By CountingPips.com

U.S. Consumer Prices increased slightly less than unexpected in April as energy and food price rises continued to push the index higher, according to a report released today by the U.S. Department of Labor. The Consumer Price Index, a key gauge of inflation, rose by 0.4 percent in April following an increase of 0.5 percent in each of March and February. April marks the fifth straight month that consumer prices have increased by at least 0.4 percent and prices have increased to higher levels every month since July 2010.

Today’s data came in just below economic forecasts that were expecting a 0.5 percent increase.

On an annual basis, consumer prices were higher by 3.2 percent when compared to April 2010 following an annual increase in March by 2.7 percent. The annual increase was more than the 3.1 percent rise market forecasts were expecting.

Rising energy prices were a significant contributor in the increased inflation as the report showed that the energy index rose by 2.2 percent and gasoline prices increased by 3.3 percent for the month. Energy prices had risen by 3.5 percent in March while gasoline was higher by 5.5 percent.

Food prices rose by 0.4 percent in April after a 0.8 percent increase in March.

The core inflation reading, excluding volatile food and energy prices, rose by 0.2 percent for the month and matched economic forecasts. The annual rate of core inflation advanced by 1.3 percent for April following an increase of 1.2 percent in March.

US Dollar rising in Forex Trading

The U.S. dollar has been higher almost across the board in forex trading today against the other major currencies in the early going of the US trading session. The dollar has been gaining ground versus the euro, Canadian dollar, British pound sterling, New Zealand dollar, Australian dollar and the Swiss franc while trading lower against the Japanese yen, according to currency data by Oanda.

The US stock markets, meanwhile, have been moderately lower today with the Dow Jones falling by over 30 points, the Nasdaq decreasing by over 10 points and the S&P 500 showing a 3 point decline.

In commodities, Oil has traded about unchanged at $99.04 per barrel while gold futures have risen by $4.30 to $1,510.90 per ounce.

EUR/USD – Potential Head and Shoulders Pattern?

By Russell Glaser

The daily chart for the EUR/USD shows a potential head and shoulders reversal pattern forming.

Following last week’s close below the January to May trend line the formation of a bearish head and shoulders pattern is beginning to develop The downward sloping neckline comes in today at 1.4120 near yesterday’s low which coincides with a 38.2% Fibonacci retracement (1.4150).

Judging from the chart pattern, a move following a breach below the neckline would take the pair lower by roughly 8 cents. However, a more likely target is the 1.3430 level. This price has technical significance as it has shown in the past to be both resistive in early January and supportive in mid-February. 1.3330 off of the August 2010 pivot (not shown) could also come into play.

Should the EUR/USD head and shoulders chart pattern fail to materialize, resistance to the upside is found at 1.4450, followed by the May high at 1.4940.

EURUSD_Daily

Forex Market Analysis provided by ForexYard.

© 2006 by FxYard Ltd

Disclaimer: Trading Foreign Exchange carries a high level of risk and may not be suitable for all investors. There is a possibility that you could sustain a loss of all of your investment and therefore you should not invest money that you cannot afford to lose. You should be aware of all the risks associated with Foreign Exchange trading.

EUR Lower vs. USD as Traders Seek Safety on Growth Concerns

Source: ForexYard

The EUR was not able to hold its recently stable price against the US dollar as regional investors battled over the direction of the 17-nation common currency. Regional bears won the day as the rumor mill chewed on the speculative reports that Greece had already secured a new financial aid package, or that it was planning to exit the euro zone. With both staunchly refuted, traders rapidly moved to safety as the speed of assistance appears to be slow in coming.

Economic News

USD – US Dollar Bullish against Riskier Assets

The US dollar rebounded strongly versus the euro and pound yesterday as traders began to bail out of the region from fear that euro zone policymakers would fail to meet the Greek debt crisis rapidly enough. The result has been for the EUR/USD to move strongly bearish, with 1.4100 well in reach. Against the pound, the greenback held close to 1.6280, though bullishness in Britain has generated pressure beneath the Cable in anticipation of an uptick.

Yesterday’s retail sales data out of the United States initially appeared to support the US dollar by holding American spending data steady. The publication of US PPI yesterday supported this movement as inflationary growth hints at pressure on the Fed to adjust its stance on interest rates. US business inventories were higher, however, which hints at weakened demand and could undercut yesterday’s bullishness.

For today, US CPI data is on tap with an expectation to hold last month’s growth figures steady. The producer price index (PPI) and its complimentary core data yesterday surprised investors and any similar movement in the CPI data could support the USD to continue running bullish. The US dollar has gained from risk aversion lately, with its own economic fundamentals appearing soft, but data from the last two days has begun to shift this sentiment.

EUR – EUR Remains Bearish as Investors Seek Safety

The euro fell below its three-week low versus the US dollar yesterday, with a price of 1.4150 rapidly approaching. As speculators tore into the euro zone with a harsh reaction to the sluggish speed of officials’ handling of the debt woes, the EUR felt the sting and dropped to as low as $1.4198 in later trading hours.

The EUR was not able to hold its recently stable price against the US dollar as regional investors battled over the direction of the 17-nation common currency. Regional bears won the day as the rumor mill chewed on the speculative reports that Greece had already secured a new financial aid package, or that it was planning to exit the euro zone. With both staunchly refuted, traders rapidly moved to safety as the speed of assistance appears to be slow in coming.

As for today, the euro zone will be largely absent from the economic calendar once more with several weaker reports, predominant among them is a speech by ECB President Jean-Claude Trichet at the Reform of the Financial System conference in Madrid, Spain. The speech comes just ahead of the euro zone’s release of its Flash GDP figures which are expected to show 0.6% quarterly growth for the region; well above the last reading of 0.3%. Should these reports generate speculation over an ECB rate hike, forex traders could see some volatile upticks in the EUR pairs.

JPY – JPY Continues to See Mixed Results

The Japanese yen (JPY) has been trading with somewhat mixed results since Friday, with gains made against several currencies and losses elsewhere. After a week of ups and downs, the Japanese yen appears set to take losses today as investors appear to be seeking higher yields. The dominant stance of risk aversion overarching yesterday’s environment of optimism has many traders moving towards the yen against the higher yielding currencies like the euro, which dropped to a six-week low during yesterday’s afternoon sessions.

However, the yen was slightly lower versus the US dollar as the pair moved up from previous intervention levels near 80.00. The USD/JPY held steady at yesterday’s low, finding support near 80.30 and moving up towards 81.10 at today’s opening Asian sessions. Japan’s Current Account was published yesterday morning and revealed a sharp downturn in data which may put some pressure on the island currency. Market news released out of the US and Europe today will likely be the driving force behind JPY values, though.

Crude Oil – Crude Oil Prices Continue Plummet after Natural Gas Storage Report

Oil prices dropped sharply again yesterday with the New York Mercantile Exchange session closing just below the $98 price mark. US oil stockpiles rose over 3 million barrels for the second week in a row, marking a significant uptick in American hoarding behavior. Yesterday’s natural gas storage report also showed an above-expected level of stockpiling. An additional 70 billion cubic feet was added to US gas inventories this past week, higher than the forecast 69 billion cubic feet.

The value of the US dollar versus the euro in recent trading has pushed towards a four-week high near 1.4190, oil prices failed to find support as a result. With yesterday’s sharp downtick during the later sessions, and this morning’s continuation of that movement, traders appear likely to see oil reaching a bit lower as this week comes to an end – though a return to riskier assets could lift oil prices one more time if the market deems it worthy.

Technical News

EUR/USD

The EUR/USD corrected some of its losses yesterday and reached as high as the 1.4280 level. Nevertheless, a bearish cross is forming on the 4-hour chart’s Slow Stochastic. It seems that the pair might resume the bearish move today. Going short with tight stops seems to be the right strategy.

GBP/USD

The Cable continues to fall and is currently trading near the 1.6240 level. In addition, the MACD on both the 4-hour and the 1-day charts is providing bearish indications and the downward move could extend today, with potential to reach the 1.6150 level.

USD/JPY

The USD/JPY is in the midst of a bullish correction and has climbed about 100 pips during the past three days. Currently, as the RSI on the daily chart has crossed the 30-line another bullish session might be expected. Going long may be the right choice today.

USD/CHF

Ever since the USD/CHF pair bottomed near the 0.8560 level it’s been slowly climbing back, and is now trading near the 0.8670 level. However, a bearish cross on the daily chart’s Slow Stochastic suggests that the pair might erase recent gains today, and could reach as low as 0.8600 level.

The Wild Card

Gold

Gold’s recent climb to an all-time high of $1,576 an ounce has initiated a bearish correction, and gold is currently trading near the $1,500 level. In addition, as the Slow Stochastic on the weekly chart continues to provide bearish indications, it seems that the commodity might proceed with the bearish correction today. This might be a great opportunity for forex trader to join a popular trend.

Forex Market Analysis provided by ForexYard.

© 2006 by FxYard Ltd

Disclaimer: Trading Foreign Exchange carries a high level of risk and may not be suitable for all investors. There is a possibility that you could sustain a loss of all of your investment and therefore you should not invest money that you cannot afford to lose. You should be aware of all the risks associated with Foreign Exchange trading.
Euro and Silver Comes Off of Lows as Markets Look Towards US Inflation Numbers

printprofile

Yesterday’s late bounce in the euro and silver continued this morning after German and French GDP numbers showed strong growth in the two largest EU economies. All eyes will now turn to US inflationary data that could show increased food and energy costs in the US economy.

EUR – German Preliminary GDP q/q – 6:00 GMT
Actual: 1.5%. Expectations: 0.9%. Previous: 0.4%.
Germany, the engine of the EU economy continues to fire on all cylinders with Q1 GDP easily surpassing market expectations. The euro continued to build on yesterday’s bounce higher near the 1.4150 support/38.2% Fibonacci retracement level from the January to May uptrend. While it is too early to call a bottom in the EUR/USD correction, a move above 1.4420 would be constructive. However, a decline below yesterday’s low would target 1.4020.

USD – Core CPI m/m – 12:30
Expectations: 0.2%. Previous: 0.1%.
Yesterday’s PPI m/m in March showed increased inflationary pressures both in the headline number and core data which fed into a renewed bout of USD selling. Today’s data release has the same possibility. Click here to read further about US inflationary growth in the FOREXYARD forex blog. The USD/CHF failed to move above the 0.8900 resistance level and formed a doji candlestick pattern, a potential signal for a halt in the upward correction. Support is found at 0.8800 followed by the swing low on the daily chart at 0.8550. To the upside, the 50-day moving average at 0.8950 could prove to be resistive as the pair hasn’t made a close above this level since mid-February.

USD – Preliminary UoM Consumer Sentiment
Expectations: 70. Previous: 69.8.
If yesterday’s retail sales report was any indication, the US consumer is spending more albeit slightly below economists’ forecasts. Stronger than expected consumer sentiment numbers would likely feed into USD selling as traders abandon safe haven bids for higher yielding assets and commodities. Silver prices made a move higher and perhaps put in a low yesterday, moving higher from the trend line rising off of the late August and January lows to close near its opening day price. Resistance comes in at $39.50 with support at the trend line near $32.30 followed by the pivot from early January at $31.20.

USDCHF remains in short term uptrend from 0.8553

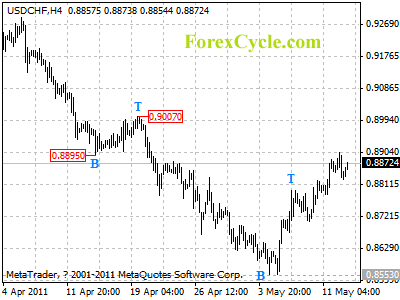
USDCHF remains in short term uptrend from 0.8553, and the rise extended to as high as 0.8904. Further rise is still possible later today, and next target would be at 0.8950 area. Support is now at 0.8820 followed by 0.8720, only break below these levels could indicate that the rise from 0.8553 is complete, then the following downtrend move could bring price to 0.8000 zone.

usdchf

Forex Signals

5 Ways the Wave Principle Can Improve Your Trading

By Elliott Wave International

Jeffrey Kennedy brings more than 15 years of experience to his position as Elliott Wave International’s Senior Analyst and trading instructor. He knows firsthand how hard it can be to get simple explanations of a trading method that works — so he shares his knowledge with his subscribers each month in the Trader’s Classroom lessons.

Here’s an excerpt from The Best of Trader’s Classroom, a free 45-page eBook that gives you the 14 most critical lessons every trader should know. Download the full eBook free here.

Every trader, every analyst and every technician has favorite techniques to use when trading. But where traditional technical studies fall short, the Wave Principle kicks in to show high-probability price targets. Just as important, it can distinguish high-probability trade setups from the ones that traders should ignore.

Where Technical Studies Fall Short
There are three categories of technical studies: trend-following indicators, oscillators and sentiment indicators. Trend-following indicators include moving averages, Moving Average Convergence-Divergence (MACD) and Directional Movement Index (ADX). A few of the more popular oscillators many traders use today are Stochastics, Rate-of-Change and the Commodity Channel Index (CCI). Sentiment indicators include Put-Call ratios and Commitment of Traders report data.

Technical studies like these do a good job of illuminating the way for traders, yet they each fall short for one major reason: they limit the scope of a trader’s understanding of current price action and how it relates to the overall picture of a market. For example, let’s say the MACD reading in XYZ stock is positive, indicating the trend is up. That’s useful information, but wouldn’t it be more useful if it could also help to answer these questions: Is this a new trend or an old trend? If the trend is up, how far will it go? Most technical studies simply don’t reveal pertinent information such as the maturity of a trend and a definable price target — but the Wave Principle does.

How Does the Wave Principle Improve Trading?
Here are five ways the Wave Principle improves trading:

1. Identifies Trend
The Wave Principle identifies the direction of the dominant trend. A five-wave advance identifies the overall trend as up. Conversely, a five-wave decline determines that the larger trend is down. Why is this information important? Because it is easier to trade in the direction of the dominant trend, since it is the path of least resistance and undoubtedly explains the saying, “the trend is your friend.”

2. Identifies Countertrend
The Wave Principle also identifies countertrend moves. The three-wave pattern is a corrective response to the preceding impulse wave. Knowing that a recent move in price is merely a correction within a larger trending market is especially important for traders because corrections are opportunities for traders to position themselves in the direction of the larger trend of a market.

3. Determines Maturity of a Trend
As Elliott observed, wave patterns form larger and smaller versions of themselves. This repetition in form means that price activity is fractal, as illustrated in Figure 2-1. Wave (1) subdivides into five small waves, yet is part of a larger five-wave pattern. How is this information useful? It helps traders recognize the maturity of a trend. If prices are advancing in wave 5 of a five-wave advance for example, and wave 5 has already completed three or four smaller waves, a trader knows this is not the time to add long positions. Instead, it may be time to take profits or at least to raise protective stops.
Figure 2-1

4. Provides Price Targets
What traditional technical studies simply don’t offer — high-probability price targets — the Wave Principle again provides. When R.N. Elliott wrote about the Wave Principle in Nature’s Law, he stated that the Fibonacci sequence was the mathematical basis for the Wave Principle. Elliott waves, both impulsive and corrective, adhere to specific Fibonacci proportions, as illustrated in Figure 2-2. For example, common objectives for wave 3 are 1.618 and 2.618 multiples of wave 1. In corrections, wave 2 typically ends near the .618 retracement of wave 1, and wave 4 often tests the .382 retracement of wave 3. These high-probability price targets allow traders to set profit-taking objectives or identify regions where the next turn in prices will occur.
Figure 2-2
5. Provides Specific Points of Ruin
At what point does a trade fail? Many traders use money management rules to determine the answer to this question, because technical studies simply don’t offer one. Yet the Wave Principle does — in the form of Elliott wave rules.

Rule 1: Wave 2 can never retrace more than 100% of wave 1.
Rule 2: Wave 4 may never end in the price territory of wave 1.
Rule 3: Out of the three impulse waves — 1, 3 and 5 — wave 3 can never be the shortest.

A violation of one or more of these rules implies that the operative wave count is incorrect. How can traders use this information? If a technical study warns of an upturn in prices, and the wave pattern is a second wave pullback, the trader knows specifically at what point the trade will fail — a move beyond the origin of wave 1. That kind of guidance is difficult to come by without a framework like the Wave Principle.

Technical studies can pick out many trading opportunities, but the Wave Principle helps traders discern which ones have the highest probability of being successful. This is because the Wave Principle is the framework that provides history, current information and a peek at the future. When traders place their technical studies within this strong framework, they have a better basis for understanding current price action.

Don’t miss the rest of the 14 most critical lessons that every trader should know. Download the free 45-page eBook The Best of Trader’s Classroom.

This article was syndicated by Elliott Wave International and was originally published under the headline 5 Ways the Wave Principle Can Improve Your Trading. EWI is the world’s largest market forecasting firm. Its staff of full-time analysts led by Chartered Market Technician Robert Prechter provides 24-hour-a-day market analysis to institutional and private investors around the world.

CAD Lower as Canadian Economic Data Flat this Week

printprofile

The Canadian dollar (CAD) has been stagnating this week with much of the economic news out of Canada appearing flat. Today’s New House Price Index (NHPI) released by Statistics Canada, as an example, revealed 0% growth in the price of new homes purchased this past month by Canadians.

The data did not represent market contraction, per se, but rather a slowing down, or stagnation. The CAD was hard-pressed to make gains following this week’s reports, with the USD/CAD moving from its recent low of 0.9440 to its current price near 0.9650. Safe haven currencies like the Japanese yen (JPY) also made gains this past week, with the CAD/JPY moving to 83.80 from a recent high of 89.50.

Monday’s housing starts figure was below expectations, but not enough to warrant a rapid sell-off for Canada’s currency. Yesterday’s trade balance figures out of Canada also revealed not shrinkage, but stability. The C$0.6B growth in the northern giant’s surplus was not enough to awe investors and generate a buy-in for the Loonie.

Overall, Canada is not in a bad spot economically. It has undergone a wave of growth unmatched in most other countries and its job sector is in good shape. This past week’s short period of stagnation represents either a slow-down in line with a global faltering among industry and manufacturing, or a sluggish period as many provinces adjust from winter to summer schedules. Either way, traders reading this forex blog should note the CAD’s recent weakness brought on by this sluggish data. Such weakness does not appear systemic, though, and such bearishness will likely not last.

Australia Loses 22,100 Jobs in April

printprofile

The Australian unemployment rate held steady at 4.9% this past month, though April’s employment change report revealed a contraction of 22.1K jobs. The Australian dollar (AUD) took a loss this morning as expectations for an interest rate hike later this month faded with today’s job report.

Many analysts do not expect this month’s reading to have a major impact overall, given the Australian economy’s ability to add over 300K jobs over the past year. The Wall Street Journal noted Australia’s announced plan to ambitiously add another 500K jobs in the 2011-2012 fiscal year.

The fact that unemployment held steady amid this job loss gives impetus to these plans and a possibility for interest rate hikes if other fundamentals come in line with current expectations. The Reserve Bank of Australia (RBA) signaled its willingness last week to raise rates in its impending meetings, but speculation took hold this morning with the severely depressed jobs report.

Tuesday’s trade balance figures out of the Australian economy, as noted in a previous article, also revealed solid growth in the nation’s surplus, with the mining industry’s export boost lending a helping hand. With jobs being the only factor holding an interest rate hike in check, the AUD may gain support if other data can induce such a move by the RBA.

Mid-Week Trading: Markets at a Tipping Point with US Dollar

By Chris Vermeulen, thegoldandoilguy.com

This week we are seeing fear across the board from traders and investors as they dump their long positions is stocks and commodities. Just in the past two trading sessions alone we have seen extreme overbought conditions and extreme oversold conditions which generally mean another big move is brewing…

Fear (panic selling) has very distinct characteristics when looking at the intraday charts and we are seeing those price and volume patterns forming now. When waves of buying and panic selling start to take place back to back, I start to prepare for a trading setup which should form within a couple of trading sessions.

Keep in mind that fear is a much more powerful force in the market and once extreme levels are reached, we typically tend to see continued selling for 1-3 more days afterwards. This is the reason I tend to scale into oversold market conditions as I can potentially enter at lower prices within the next couple of sessions to build a position with a reduced cost basis.

SPY 10 Minute Chart of My Market Sentiment Readings
Panic selling, coupled with oversold NYSE market conditions and fearful options traders makes for an extreme reading in stock prices.

GLD 10 Minute Chart of My Market Sentiment Readings
Sentiment readings many times carry over into the precious metals sector and can be used as a gauge also for tightening stops, adding to long positions etc..

Mid-Week Market Trading Update:
In short, I feel the market is at a major tipping point along with the US Dollar. It is just a matter of time before we get another low risk setup and take a position for the next move in either direction.

Get My Weekly Reports Free Here: http://www.thegoldandoilguy.com/trade-money-emotions.php

Chris Vermeulen