European Inflation Data to Underscore Current Tightening Cycle

printprofile

Today’s release of European inflation data is expected to show continued price pressures in the EU and may force the ECB to raise interest rates in the July meeting. While this may be a positive for the euro, technical signals have shifted against the currency following the 9 cent decline versus the dollar in less than 2-weeks.

Today’s Key Economic Data Releases

EUR – CPI y/y – 09:00 GMT
Expectations: 2.8%. Previous: 2.8%.
While the headline inflation number is expected to remain at 2.8%, the rise in commodity prices may have fed into other price pressures in the core inflationary reading which is expected to rise 1.5% from 1.3% y/y. While many economists argue that the rise in commodity prices are transitory, the ECB has attempted to prove its inflation fighting agenda with most market expectations for a second rate hike this year to come in the July meeting. Stronger inflationary pressures today would hint at this scenario and lend strength to the euro, albeit in the short term as the Greek aid package that was put together last year looks to be adjusted by EU officials.

A breach of the rising trend line from January and falling weekly stochastics hint at further declines in the EUR/USD. Support is found at 1.4020. A break here would open the door for increased selling of the pair to the 50% retracement of the January to May move at 1.3900. Resistance is found at Friday’s high of 1.4340.

CAD – Manufacturing Sales m/m – 12:30 GMT
Expectations: 1.6%. Previous: -1.5%.
The Canadian dollar has backpedaled lately following a decline in both oil prices and an overall dollar recovery. On Friday the USD/CAD found resistance at the 100-day moving average, a level that has proven to be resistive in the pair’s downtrend and the last time the USD/CAD tested this level was on March 15th. Support for the pair comes in at 0.9600 and 0.9510.

USD – TIC Long-Term Purchases – 13:00 GMT
Expectations: 57.7B. Previous: 26.9B.
The report is expected to show that foreigners increased their purchases of US financial instruments in the month of March but a release in line with expectations should do little to shift investor sentiment away from the dollar recovery which has stemming from the decline in commodity prices and increased pressures surrounding the Greek bail out.

WTI Crude Oil To Slip Again?


WTI crude oil, petroleum, ron acoba, rising wedge, hidden bearish divergence, commodities trading, energy and fuel

WTI crude oil suffered an unprecedented fall last week when it was dropped like it was hot from a high of $114.81 per barrel to a low of $94.65 in a matter of days. Since then oil prices have rebounded again. However, it appears that oil could bound for another dip in the near term.

As you can see from its 4-hour chart above, WTI crude oil looks to have formed a rising wedge pattern in its recent run-up. Technicians consider this this pattern as bearish since it generally just indicate a temporary rally in prices following a deeper descent. Notice also that is is already nearing the 50% Fibonacci retracement level, using its last high at $114.81 and the low of $94.65 as swing points. Additionally, the presence of a hidden bearish divergence, where the price makes lower highs and at the same time its stochastics register higher highs, suggests of a possible downbeat turnaround soon. Moreover, crude oil’s condition appears to be already overbought as indicated in its stochastics. A breakdown, therefore, from the rising wedge pattern could sent it back to its recent low.

More on LaidTrades.com

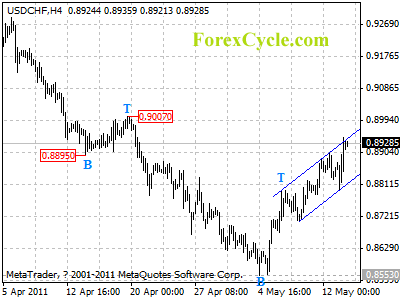
USDCHF ran in a rising price channel

USDCHF ran in a rising price channel on 4-hour chart, and remains in uptrend from 0.8553. Now the pair had reached the upper border of the channel, minor consolidation of uptrend would likely be seen later today, and another rise towards 0.9000 is still possible after consolidation. Support is at the lower border of the channel, only a clear break below the channel support could indicate that the rise from 0.8553 is complete.

usdchf

Daily Forex Analysis

FOREX: Foreign Currency Speculators cut Dollar shorts. Japanese Yen positions go long

By CountingPips.com

The latest Commitments of Traders (COT) report, released on Friday by the Commodity Futures Trading Commission (CFTC), showed that large futures speculators increased their positions in favor of the US dollar against the other major currencies last week. Non-commercial futures positions, those taken by hedge funds and large speculators, were overall net short the US dollar by $27.68 billion against other major currencies as of May 10th. The data is a decline from the total short position of $35.01 billion on May 3rd, according to the CFTC data and calculations by Reuters which calculates the dollar positions against the euro, British pound, Japanese yen, Australian dollar, Canadian dollar and the Swiss franc.

This week’s notable changes were euro positions decreasing after reaching the highest level since July 2007 while Japanese yen positions improved for a third straight week and positions rose over to the long side for the first time since March.

EuroFx: Currency speculators decreased their net long positions for the euro against the U.S. dollar after two weeks of increases. Euro futures positions declined to a total of 61,447 long contracts following a total of 99,516 long positions on May 3rd which had marked the highest level since July 2007.

The COT report is published every Friday by the Commodity Futures Trading Commission (CFTC) and shows futures positions as of the previous Tuesday. It can be a useful tool for traders to gauge investor sentiment and to look for potential changes in the direction of a currency or commodity. Each currency contract is a quote for that currency directly against the U.S. dollar, where as a net short amount of contracts means that more speculators are betting that currency to fall against the dollar and net long position expect that currency to rise versus the dollar. The graphs overlay the forex spot closing price of each Tuesday when COT trader positions are reported for each corresponding spot currency pair.

GBP: British pound sterling positions edged lower for a second straight week as of May 10th to a total of 18,118 net long positions. This follows a decline the week before to a total of 30,807 long contracts on May 3rd.


JPY: The Japanese yen net contracts improved for the third consecutive week and rose over to the long side for the first time since March. Yen positions increased to a total of 13,054 net long contracts reported on May 10th following a total of 18,819 net short contracts on May 3rd.


CHF: Swiss franc long positions edged lower after increasing for four straight weeks. Franc positions fell to a total of 16,336 net long contracts following a net of 18,381 long contracts on May 3rd.


CAD: The Canadian dollar positions declined lower for a third consecutive week to a total of 37,203 contracts as of May 10th. CAD net contracts had fallen to a total of 54,041 net long contracts on May 3rd.


AUD: The Australian dollar long positions declined for the fifth straight week to a total net amount of 60,321 long contracts as of May 10th. AUD positions had totaled 73,421 net long contracts on May 3rd.


NZD: New Zealand dollar futures positions continued to increase higher for an eighth consecutive week. NZD contracts increased to a total of 13,714 long positions as of May 10th from a total of 12,800 long contracts on May 3rd.


MXN: Mexican peso long contracts dipped for a third week after reaching the highest level in at least a year on April 19th. MXN contracts fell to 118,065 net long contracts as of May 10th from a total of 124,260 long contracts as of May 3rd.


COT Data Summary as of May 10, 2011
Large Speculators Net Positions vs. the US Dollar

EUR: +61,447
GBP: +18,118
JPY: +13,054
CHF: +16,336
CAD: +37,203
AUD: +60,321
NZD: +13,714
MXN: +118,065


EUR/USD Bearish Momentum Suggests Further Downside

EUR/USD should see further downside

The weekly timeframe bearish engulfing bar on EUR/USD has been confirmed by a move beneath the previous weeks range low.  When taking this into consideration, and the strong move through the daily time frame trend line shown in the chart below, further downside looks to be a distinct possibility for the leading FX pair.

Any retrace has been sold heavily so far with a drop of over 850 pips seeing only a 219 pip retrace to date.  A combination of highly leveraged longs taking profit and speculative shorts entering the market have contributed towards a major bearish wave down.

The fundamentals are also supporting the dollar in the near term with the Euro Greek debt situation dominating.

Longer term dollar weakness should return but the current sentiment favours shorting the EUR/USD pair.

See Forex-fx-4x for further Forex trading analysis


Forex Majors Relative Strength Chart 14th May

Major FX Pair Relative Strength

The Japanese Yen is currently riding high against it’s major forex counterparts with the euro at the other end of the scale, as per the day 1 correlation chart below.

The correlation/relative strength chart gives a useful overview as to the current strongest and weakest currencies to trade against each other.

Price action on the euro dollar pair last week had indicated a further drop was around the corner, with the weekly bearish engulfing candle giving a tip off.

The dollar has been strong across the board with steady gains all week.  Renewed dollar strength hit the markets on friday with the euro and pound lower against the safe haven currency pairs of JPY,USD and CHF.

For further updates see our forex technical analysis blog.


EURUSD’s fall extended to 1.4067

EURUSD’s fall from 1.4939 extended to as low as 1.4067. The pair is now in downtrend. Deeper decline could be expected next week, and next target would be at 1.3800. Resistance is at 1.4350, only break above this level will indicate that minor consolidation of downtrend is underway, then the following upward move could bring price to 1.4500-1.4600 area.

For long term analysis, EURUSD had formed a cycle top at 1.4939 on weekly chart. Further fall towards 1.1500 is possible in next several months.

eurusd

eurusd

Weekly Forex Forecast

Does Technical Analysis Really Work?

stock market analysisMany new traders ask, “Does technical analysis really work?” This question is debated by seasoned professionals, too. I want to share with you what I’ve learned over the years.

Generally speaking, most investors fall into two camps when it comes to analyzing stocks: fundamental analysis and technical analysis. Some use a combination of both, which I believe is the best approach, and I’ll explain why.

*Sara wrote a great article on finding the value of a stock.

1. Fundamental analysis examines the health of a company using balance sheet data, revenue projection models and just plain common sense.

A fundamental analyst might say, “I’m buying XYZ because they have little debt, great cash flow and big profit margins, and everyone around the world seems to love their widgets more and more every day.”

Pros

  • Most of us agree with this thinking and can gather the data fairly easily.
  • It is generally a smart practice to invest in a company with sound financials that is witnessing material revenue growth.

Cons

  • The problem with fundamental analysis is that you are still making predictions about the future that may not come true.
  • Fundamental analysis can be a lengthy, complex process.
  • Remember that even if a stock looks financially healthy and is relatively cheap compared to its peers, that doesn’t mean that it will always rise in value. A stock’s price is also determined by the supply and demand of its shares.
    • Cisco Systems, Inc. (CSCO:NASDAQ) and Research in Motion Limited (RIMM:NASDAQ) are examples of stocks that are financially stable but have not been performing well as of late.

2. Technical analysis looks at a chart of a stock’s price movements. Analysts look for patterns to determine future movements in the stock. There are hundreds of “indicators” that can help find buy or sell points, or price trends and momentum.

Indicators have been created by investors over the years. They take the data in the chart and apply a mathematical formula. This produces a line, dot, band or other visual cue for the analyst to interpret.

A technical analyst might say, “I’m buying XYZ because the stock price is above its 50- and 200-day moving averages and has strong momentum at the moment.”

Pros

  • Patterns in price and volume can help us identify trends. They can also find price levels where investors tend to buy or sell.
  • This analysis goes quickly once you know and understand the indicators you want to use.
  • Technical analysis can help you rationalize the price you are paying. In other words, if you researched a company and simply bought it without looking at a chart, you have no way of knowing where the stock is in relation to its past.

Would you want to buy a stock that is at an all-time high and has just risen over 40% in the past month? What if you then looked at a chart and noticed that it had done that three times in the past, and that each time it hit a new high it then sold off 20%?

Cons

  • There is an overwhelming amount of different indicators out there. It is tough to find the ones that are most effective for your style of trading.
  • It takes skill and experience to identify trends and patterns.

What technical indicators should you use?

There are dozens of different technical indicators to choose from. Some are better than others.

I suggest that you focus on some of the more commonly used ones for your strategy. I believe that basic indicators, followed by many investors, are more reliable than more obscure methods.

Such common indicators include moving averages, volume, Fibonacci levels, Bollinger Bands, trend lines, ATR, MACD and Stochastics.

Take a look at this chart. On it you’ll find some of these indicators. The moving averages are the green, orange and red lines in the top section. Bollinger bands are the gray area, also in the top section. Trend lines are the parallel lines drawn in black.

Under the top section, you’ll find MACD — moving average convergence divergence (which we explained here). Next is stochastics, followed by ATR — average true range.

It might sound confusing, but these indicators each tell us something about how the S&P 500 Index moves. That can help us make decisions about where it might move next.

Typical chart set-up with the indicators mentioned below

S&P 500
View Larger Chart

*My book “Your Options Handbook” contains details about all of these indicators and how to use them.

If you are simply going to apply technical analysis on one stock, it’s a good idea to make sure the basic fundamentals of the company are sound, and that the big-picture data on the economy supports your idea before you jump in.

Hints and Tricks

Support and resistance levels give us price ranges to enter or exit a stock. Sometimes it helps to draw a trend line (like the one in black above) to find those levels.

Average True Range (ATR) and volatility help us measure how much a stock “normally” moves and if it is behaving oddly. This indicator may be either showing you an opportunity or warning you that there might be an underlying problem.

Moving averages help identify trends. A simple technique is to make sure a stock is above its 50- and 200-day moving averages if you are going long. On the chart above, these are the orange and red lines. Once the stock price gets below the 50-day moving average, it may be time to sell.

Summary

I believe that technical analysis works mainly because so many people believe in it and use it. It almost becomes a self-fulfilling prophecy.

It has been used in some form or fashion for thousands of years, dating all the way back to Chinese rice farmers. The patterns and indicators sometimes seem unusual, but amazingly, many still manage to find their way into a stock’s chart. You would be amazed at what pops up.

Use a combination of both types of analysis. You would be foolish to omit one or the other.

Editor’s Note: Learn how to inflation-proof your portfolio. Inflation is rising rapidly, no matter what the government says. The result could spell doom for your bonds. But if you make one simple move right now, you could inflation-proof your portfolio and thrive as inflation continues to grow.

Article brought to you by Taipan Publishing Group. Additional valuable content can be syndicated via our News RSS feed. Republish without charge. Required: Author attribution, links back to original content or www.taipanpublishinggroup.com.

{jtagstpg} {authorstpg}

Other Related Sources:

  • How to Find Value in a Cheap Market
  • Technical Analysis Indicators and Patterns
  • WaveStrength PowerSignal Calls Pop in Gold Prices
  • ECB’s President Trichet Declares Financial Reforms only Half Done

    printprofile

    Today’s speech delivered by the European Central Bank (ECB) President Jean-Claude Trichet was a reminder to many that Europe still faces hardship, regardless of the progress which has already been made. The speech was part of a full-day conference in Madrid, Spain, titled Reform of the Financial System.

    Trichet’s remarks served primarily as a warning not to become complacent with recent growth figures and estimates. He stated that many were returning to a business-as-usual mentality given the recent confirmations of stable economic recovery. Trichet argued that reforming the European financial system was necessary to ensure against a repeat of the weakness experienced in 2007/08, which is still ongoing.

    Many analysts have taken his remarks as a warning that further weakness is ahead and that the current reform process, which he noted was only half done, has still not resolved the issue of economic fragility throughout the region. Policymakers across the euro zone have been able to work together to bring the financial system under review and make necessary changes, but much more work lies ahead, according to Trichet.

    He pointed a finger at Greece by remarking on her continued debt woes and fragile system. But he highlighted the plan which Greece had devised for herself and urged its leaders to stick to that plan and continue implementing these reforms.

    All in all, Trichet’s speech was taken as optimistically cautious. His remarks were positive, though he appeared reluctant to express hubris at the progress already made. Trichet’s speech, delivered in English, was filled with hawkish statements which so far appear to have supported the EUR going into next week’s trading. But long-term growth for the euro zone, he argued, would depend on Europe’s willingness to finish what it started regarding these financial reforms.

    French and German GDP Surge, Italian GDP Sluggish

    printprofile

    Today’s major headline news has been the surge in preliminary gross domestic product (GDP) numbers out of France and Germany. Both of these euro zone giants released data which helped the region’s currency partially shore up recent losses, though similar data out of Italy was disappointing for regional investors.

    France led the day with an early 6:15 GMT release of its GDP data, highlighting the solid 1.0% growth in the first half of the second quarter, beating expectations for only a 0.4% gain. Germany was not far behind at 7:00 GMT, publishing an even higher 1.5% growth, well above the forecast of 0.9% growth.

    These figures have so far helped the EUR regain a solid portion of its losses from earlier this week against the US dollar (USD) and British pound (GBP). But data from Italy put a temporary halt to the region’s currency gains with a faltering 0.1% growth coming in below an anticipated 0.3% reading.

    Overall, the euro zone’s flash GDP data revealed 0.8% growth for the first half of this quarter; not bad considering recent fundamentals. Forex traders were looking to the inflationary data out of the United States in order to better assess their risk exposure ahead of the weekend.

    With solid CPI data published by the US Bureau of Labor Statistics in line with expectations at 13:30 GMT today, traders felt comfortable with moving additional funds into their EUR long positions. The University of Michigan’s (UoM) inflation expectations report also revealed anticipation for solid growth in the American market this quarter.

    As a result, some profit taking was seen on the USD, pushing the EUR/USD pair back towards 1.4230 by late afternoon trading. Market optimism surged Friday, with expectations appearing to favor a return to risk by early next week if data continues to get published in line with recent growth figures.