The Silver Lining in the Real Estate Thunderclouds

I’ve written several times about the housing market and its potential for another drop. Last year I saw very credible estimates that our residential market could see an additional 30% plunge.

And yet, in today’s Taipan Daily, I’m going to tell you to consider buying real estate.

In fact, I’d like to dedicate this to a reader (and new Millionaire’s Circle member) by the name of Vincent M. He joined about the same time Japan had its rumbles. In other words, the world (including the Earth) was correcting and he was stepping right into the mix.

So, Vincent M., while equities have been less than kind to you and everyone else over the past 60 days, let me point you in the direction of real estate.

Even as I write that last line, I think, “Buying property? That sounds nuts.”

From experience, though, I know that all disasters have a silver lining — often far greater than the problems at hand. One need only search for it.

Real estate definitely qualifies as a disaster. Here’s the silver lining.

What I’m recommending is for you to investigate tax-lien certificates. Sometimes they are called tax deeds or even sheriff sales. These little gems allow you to profit from the delinquencies of others.

The majority of counties sell these at an auction, and some even sell them online.

Almost all people I’ve met think they understand how their local county handles collections. The reason few people actually do know what goes on is that most folks pay their taxes on time.

We assume that if a property owner doesn’t pay the taxes on their home, then after a year, sometimes two, the county sells it to repay the amount owed.

That explanation is nearly correct. There is one piece missing from this puzzle though. It is this lost bit of knowledge where we’ll find our profits.

What really takes place in most locations is the county sells a lien against the delinquent property owner’s home for the amount of taxes, plus any premium (not the actual property).

If you’ve purchased one of these liens, you’ll have the right to take the property after a certain amount of time. In the case of the three certificates my wife bought last August (first time she ever stepped foot in this sort of thing), the time to redeem for the property owner is fast approaching the one-year mark.

If they choose to pay what they owe, I’ll get the taxes I paid for them and the penalties the county charges, plus any fees I may have incurred. In Missouri this amounts to 10% on the past taxes, and 8% on any taxes I paid this year for the owners.

I know of no real estate investment that offers so much upside with so little downside.

Every county can handle things differently. You’ll have to do some legwork. However, with a little digging, you should be able to find the state statutes that cover these regulations, and most now have websites outline everything.

My experience has been that about 90% of the property owners finally repay their taxes and you’ll get your money back, with the penalty (that is profit to you) of somewhere between 6% and 18%.

Not bad for a one-year loan.

If you’re lucky enough to have someone not retire their obligation, however, you’ll end up with the property. This can be a good thing depending on how much you paid.

In a falling real estate market, trying to pick the bottom is like trying to catch a falling knife. The key to this opportunity is to never pay too much for a tax lien. The first reason is that you may not get any return on the level of premium you bid to win at the auction.

The second, and more important, reason is that we’re not intentionally trying to become real estate investors. We’re seeking to lend money to counties to cover delinquent taxes that are well collateralized with real estate.

If you’ve not paid too much, and the taxpayer chooses to walk, then you’ll become the proud owner of some piece of property for what amounts to pennies on the dollar.

For me, this upcoming August, I hope to find myself the owner of a 40-acre farm and two residential lots in a quaint little antebellum town my wife and I love to visit.

For the lots, we paid exactly what was owed on them: Less than $500 each. If the 90% repayment stat holds true, we’ll have picked up 10% in a year.

On the farm, we bid a premium of about $7,000 over the taxes owed. Why the premium? I wanted the agricultural land. I was also seeking a mega-profit.

Prior to bidding, I drove around the area. Most farm properties nearby have an asking price that is $4,000 per acre. Which works out to be a piece of property worth $160,000. Even if I place it at fire-sale levels, say $2,000 an acre, I’ll still have a remarkable profit.

With any potential reward of this magnitude, there is usually an equal or greater amount of risk. My downside on this, as far as I can see it, is less than $700 in potential earnings on my seven grand, because it’s not sitting in my bank account drawing nearly no interest.

A risk of about $700 to make potentially more than $100,000 sounds like a deal only available to Hillary Clinton trading the futures markets. But in fact, it is available to most anyone with a few bucks in the bank.

I’m a big believer in the saying, “if something is too good to be true, it probably is.” And this definitely fits that category. But sometimes the deal really is that good. So, before you think, “this is not for me,” visit the website for a few counties in the state of Arizona. I’ve linked one county here.

P.S. As usual, any comments or questions can be directed to me at [email protected].

Article brought to you by Taipan Publishing Group. Additional valuable content can be syndicated via our News RSS feed. Republish without charge. Required: Author attribution, links back to original content or www.taipanpublishinggroup.com.

About the Author

Joseph McBrennan is the Editor of free financial market e-letter Taipan Daily. He comes from at least five generations of investors and traders on both sides of his family, dating back more than 150 years. He brings to Taipan Publishing Group over two decades of experience in the investment banking business.

Conflict in the Financial Stock Market… Protect Yourself Now!

I have a 94-pound Anatolian Shepherd named Simone. She’s a great dog… She has a sensitive soul and loves belly rubs. But she’s also pretty tough. When she and Rowan, our 40-pound hound mix, get going, it’s hard to believe that she’s enjoying herself.

In other words, she is super insensitive to rough play. Most times she just rolls around while Rowan bites her neck and shoulders and hind legs.

Simone just keeps going…

That’s how the financial stock market has been for the past two years — as insensitive as our Anatolian Shepherd. Sky-high unemployment? No problem! Soaring government debt? So what! Housing still in the dumps? Who cares? We’re having fun!

Right?

You couldn’t really fight this bull market, even though it felt funny to watch stocks climb while our economy still struggled.

But we’re starting to see some conflict.

A Heavyweight With Teeth

Simone loves playing, but when she’s done, she’s done. She’ll chase Rowan away, and 94 pounds of shepherd is more than enough to make Rowan hightail it out of reach.

The past few days of trading have had some sharp swings in everything from the Dow Jones Industrial Average to commodities like gold and silver. The market is conflicted… It went from being an insensitive, playful pup to a big heavyweight with teeth.

The good thing about Simone is that her corrections are short, and then she gets right back to playing.

I don’t think the stock markets are going to be as forgiving.

We’ve been saying this for a while now, but investors need to protect themselves. And the key to preserving wealth is to have those protections in place before the market turns against you.

The Bullish Run Is Over

Here’s another reason why having some safeguards is important right now.

DOW Chart
View larger chart

This is a five-year chart of the Dow. You’ll see a similar chart in the S&P 500. Marked in red is a pattern called a head-and-shoulders bottom. It’s made up of three price dips. The first on the left is the first shoulder, the middle bigger dip is the head, and the third dip on the right is the second shoulder.

The peaks between the shoulders make the neckline. This is also considered the breakout point.

These patterns are bullish, and as you can see, the Dow has climbed 44% since breaking through the neckline.

Normally, according to Charles Bulkowski’s Encyclopedia of Chart Patterns, a head-and-shoulders bottom pattern climbs an average of 34% from the neckline. Right now, markets are well above that average.

This is kind of like the point where our Anatolian Shepherd Simone says, “Enough!”

Yesterday, the Dow fell more than 130 points. Oil has traded between $109 and $95 a barrel in the past five days. And gold, which had fallen below $1,480, climbed as high as $1,524 on Wednesday.

This is some serious conflict…

We’ve talked to you about having gold in your portfolio so often that this move should be hardwired into your investment brain.

So let’s look at some other ways of protecting your portfolio.

Quick Portfolio Protection

Get Rid of Risk. When stock markets are climbing, adding riskier investments to your portfolio can give your returns a boost. Ultra-conservative investors think that any risk is too much risk… and they point to market downturns as proof.

Riskier investments are often the first to fall, and they tend to fall harder than safer investments.

Smaller companies called small caps might be first on your list to go. A Forbes article recently said that money managers might be getting out of small caps, and a MarketWatch.com article suggests that prudent investors should have a good chunk of cash in addition to big blue-chip companies.

Get Out of the U.S. MarketWatch.com also said that investors should be holding emerging market companies.

This, of course, doesn’t mean you should dump all your U.S. stocks… But investors should be looking at certain international markets to add to their portfolio. You should think about adding some companies from emerging markets.

Another option would be to look for U.S. companies that do a lot of business in growing countries, either directly, or through joint ventures.

Stick to Your Stops. One of the simplest, most overlooked protections is the stop-loss. This is especially true when a long-term bull market starts to turn against you. It’s natural to want to eke out every last cent of profit, but it’s not practical, and it’s not disciplined.

Another thing — and this is something that I have had trouble with in the past — don’t buy more of a stock that’s losing. It’s called averaging down, meaning you can lower your overall buy price by buying more shares of stock when the price drops.

I was reading a letter from a friend that really opened my eyes on this. If a company’s share price is falling, why on Earth would you want to buy it?

The truth is, we’re emotionally attached to our investments, and we can convince ourselves that we’re not wrong… And that we’re just not right yet. As a result, if we think a company is worth investing in at $25 a share, then it’s an even better deal at $19.

This method can really eat away at your portfolio — and your sanity. If you’ve got money and happiness to spare, then average down all you like. Most investors will be better off cutting their losses and moving on to the next opportunity.

That’s why stop-losses are so important. They can help you take your emotions out of the decision. Pick your stop-loss wisely, based on clear reasoning, and stick to it.

Everyone talks about protecting your portfolio in clear times of market downturns. But the time to start putting safeguards in place is well before the market swings against you. We’re already starting to see conflict in the markets. Simone is just starting to show her teeth, and at 94 pounds, it’s a signal to be respected.

Editor’s Note: I stole these winners from billionaire hedge fund managers. Here’s why Uncle Sam helped me do it. Steal from the funds like they stole from American investors. Get all the details from Safe Haven Investor.

Article brought to you by Taipan Publishing Group. Additional valuable content can be syndicated via our News RSS feed. Republish without charge. Required: Author attribution, links back to original content or www.taipanpublishinggroup.com.

Producer Price Index Increases 0.8% In April

The Producer Price Index for finished goods increased a seasonally adjusted 0.8% in the month of April, rising a tick faster than the 0.7% increase in March, the Bureau of Labor Statistics reported today. Three quarters of the advance in the index can be attributed to a 2.5% increase in prices for energy, the seventh consecutive monthly rise. Gasoline prices climbed 3.6% in the month alone. The core index, which excludes food and energy, was up 0.3% in the month, with the largest jump being a 1.2% rise in civilian aircraft prices. Prices received by manufacturers of intermediate goods rose 1.3% in the month, and the crude goods index climbed 4.0%. For the 12 months ended April 2011, prices for finished goods are up 6.8%, the largest 12-month increase since September of 2008.

Dollar Correction Continues to Build Strength with Declines in Silver

printprofile

The rally in the dollar continues to build on last week’s gains as silver prices have fallen below last week’s low in line with gold and crude oil prices. The sell-off in commodities and global equities has helped to strengthen the dollar as long commodity trades are unwound.

Silver is limit down today as the selling from yesterday carried over into today’s European trading. The commodity is being sold as a bout of risk aversion has hit financial markets. An initial cause of the selling may be linked to a flare up in the Greek debt crisis as European leaders search for alternative measures. According to a Dow Jones Newswires report a majority of European countries believe a Greek debt restructuring (also known as default) is inevitable.

Another explanation for the sell-off in commodities may be due to the expected ending of the Fed’s QEII program. With the withdrawal of liquidity and cheap funding opportunities, the supply of commodity buyers are dwindling, leaving speculators holding onto silver at prices above the $40 level.

Silver prices plummeted for the second consecutive day, trading on their low of $32.57 from $32.30. The commodity is down 16% over the past two days. Interestingly enough, today’s low coincides with trend line rising off of the late August and January lows. After such sharp declines in silver prices, one must ask at what point will real money reenter the picture and begin bidding the price higher.

Other commodities are also lower with crude oil trading below $100 at $95.23 and gold falling lower to $1477 from $1504.

In addition to the selloff in commodities there are other signs of risk aversion. Global bourses are lower with the FTSE trading down by 1.26% and the Nikkei falling by 1.50%.

The selling of equities and commodities has helped to strengthen the dollar as the correction lower continues. Today the EUR/USD dropped to a low of 1.4123, below the 1.4150 support/38.2% Fibonacci retracement from the January to May move. Sterling is lower at 1.6234 versus the dollar despite yesterday’s monetary policy changes announced by the Bank of England.

The dollar correction continues to build strength with the decline in commodities and the greenback should be supported as long as silver and other commodity trades are unwound.

US Hoarding Oil to Help Ease Gas Prices?

Source: ForexYard

Oil prices dropped sharply yesterday with the New York Mercantile Exchange session closing just below the $98 price mark. US oil stockpiles rose over 3 million barrels for the second week in a row, marking a significant uptick in American hoarding behavior. The possibility exists that this is a tactic to release excess stockpiles at the start of the American summer in order to push down on gas prices ahead of the driving season.

Economic News

USD – USD Rebounds as Euro Zone Struggles with Greek Debt

The US dollar rebounded strongly versus the euro yesterday as traders began to bail out of the region out of fear that euro zone policymakers would fail to meet the Greek debt crisis rapidly enough. The result has been for the EUR/USD to move strongly bearish, with 1.4200 well in reach. Against the pound, the greenback held close to 1.6340, though bullishness in Britain has generated pressure beneath the Cable in anticipation of an uptick.

Yesterday’s widening trade deficit in the United States initially appeared to support the US dollar by assisting in a shift to safe havens. But yesterday evening’s publication of the federal budget balance, which revealed a somewhat diminished deficit, had the effect of leveling the dollar off and caused many investors to evaluate the EUR instead. Such attention brought to light the weakness of Greece and the stark debt conditions which persist throughout the region and this has largely caused a flight to the safety of the greenback.

For today, US retail sales are on tap with an expectation to hold last month’s growth figures steady. The producer price index (PPI) and its complimentary core data are also scheduled for today, with inflation also forecast to hold its current rate of growth. The US dollar has gained from risk aversion, with its own economic fundamentals appearing soft, but today’s stable data may also support further bullishness on the USD.

EUR – EUR Takes Hit from Speculation on Greece Debt Woes

The euro was holding near a three-week low versus its primary currency counterpart (i.e. USD) yesterday morning, but as the day wore on the 17-nation common currency could bear the weight no longer. As speculators tore into the euro zone with a harsh reaction to the sluggish speed of officials’ handling of the debt woes, the EUR felt the sting and dropped to as low as $1.4210 in later trading hours.

The EUR was not able to hold its recently stable price against the US dollar as regional investors battled over the direction of the 17-nation common currency. Regional bears won the day as the rumor mill chewed on the speculative reports that Greece had already secured a new financial aid package, or that it was planning to exit the euro zone. With both staunchly refuted, traders rapidly moved to safety as the speed of assistance appears to be slow in coming.

As for today, the euro zone will be largely absent from the economic calendar aside from several smaller reports, predominant among them is the ECB’s Monthly Bulletin regarding interest rates. The industrial production figure scheduled for 10:00 GMT also carries the potential to reveal further stagnation in the industrial sector of the region’s collective economy. Such news will likely not be beneficial for the EUR, but any movement back into higher yielding assets could help the common currency find a modicum of support.

JPY – JPY Continues to See Mixed Results

The Japanese yen (JPY) has been trading with somewhat mixed results since Friday, with gains made against several currencies and losses elsewhere. After a week of ups and downs, the Japanese yen appears set to take losses today as investors appear to be seeking higher yields. The dominant stance of risk aversion overarching yesterday’s environment of optimism has many traders moving towards the yen against the higher yielding currencies like the euro, which dropped to a six-week low during yesterday’s afternoon sessions.

However, the yen was slightly lower versus the US dollar as the pair moved up from previous intervention levels near 80.00. The USD/JPY held steady at yesterday’s low, finding support near 80.30 and moving up towards 80.90 by today’s opening Asian sessions. Japan’s Current Account was published this morning and revealed a sharp downturn in data which may put some pressure on the island currency. Market news released out of the US and Europe today will likely be the driving force behind JPY values, though.

Crude Oil – Crude Oil Prices Drop as US Inventories Pile Up

Oil prices dropped sharply yesterday with the New York Mercantile Exchange session closing just below the $98 price mark. US oil stockpiles rose over 3 million barrels for the second week in a row, marking a significant uptick in American hoarding behavior. The possibility exists that this is a tactic to release excess stockpiles at the start of the American summer in order to push down on gas prices ahead of the driving season. Whether it will pay off is yet to be seen.

The value of the US dollar versus the euro in recent trading has pushed towards a three-week high near 1.4200, but oil prices continued to rebound until yesterday afternoon as traders price in an expected boost in consumption as the driving season kicks into high gear in the Northern Hemisphere. With yesterday’s sharp downtick during the later sessions, and this morning’s continuation of that movement, traders appear likely to see oil reaching a bit lower as this week comes to an end – though a return to riskier assets could lift oil prices one more time if the market deems it worthy.

Technical News

EUR/USD

The pair has recorded much bearish behavior over the past several days. However, the technical data indicates that this trend may reverse soon. For example, the 8-hour chart’s RSI signals that a bullish reversal is imminent. Going long with tight stops might be a wise choice.

GBP/USD

The pair has been range-trading for a while now, with no specific direction. The daily chart’s Slow Stochastic is providing us with mixed signals. Oscillators on the 4 hour chart are not providing a clear direction as well. Waiting for a clearer sign on the hourlies might be a good strategy today.

USD/JPY

The USD/JPY has gone bullish in the past 2 days, and currently stands at the 81.15 level. The daily chart’s Slow Stochastic indicates that the currency cross will rise further today. However, the 8-hour chart’s Stochastic Slow signals that a bearish reversal will take place. Entering the pair when the signs are clearer seems to be the wise choice.

USD/CHF

The USD/CHF cross has seen bullish movement over the past 2 days. However, it seems that this trend may be coming to an end. The RSI on the daily chart shows the pair floating in the overbought region, indicating that a downward correction could happen in the near future. Going short with tight stops might be a wise choice.

The Wild Card

EUR/GBP

The Williams Percent Range on the 8-hour chart is in oversold territory. In addition, the daily chart’s Stochastic Slow has formed a bullish cross, indicating upward movement is likely to occur. Now may be a great time for forex traders to open up long positions before the upward breach occurs.

Forex Market Analysis provided by ForexYard.

© 2006 by FxYard Ltd

Disclaimer: Trading Foreign Exchange carries a high level of risk and may not be suitable for all investors. There is a possibility that you could sustain a loss of all of your investment and therefore you should not invest money that you cannot afford to lose. You should be aware of all the risks associated with Foreign Exchange trading.

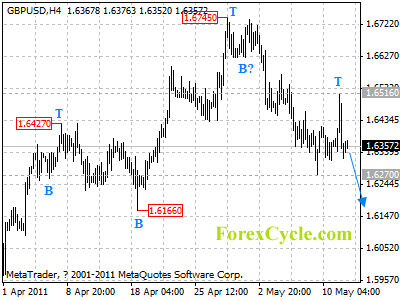
GBPUSD has formed a cycle top at 1.6516

GBPUSD has formed a cycle top at 1.6516 on 4-hour chart. The fall from 1.6516 is now treated as consolidation of downtrend from 1.6745. Another fall would likely be seen later today, and target would be at 1.6150 area. Key resistance is at 1.6516, only break above this level could trigger another rise towards 1.7000.

gbpusd

Daily Forex Forecast