US stocks end week solidly higher

By IFCMarkets

Dollar weakening continued after weak manufacturing and services PMI readings

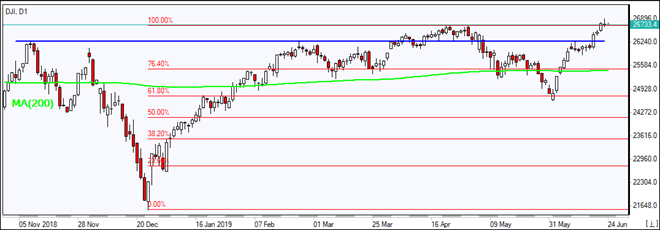
US stock market pulled back on Friday on weak data. The S&P 500 slid 0.1% to 2950.46, rallying 2.2% for the week. Dow Jones industrial slipped 0.1% to 26719.13. The Nasdaq lost 0.2% to 8031.71. The dollar weakening continued at previous session pace as data showed manufacturing and services sectors activities slowed in May, while existing home sales rose. The live dollar index data show the ICE US Dollar index, a measure of the dollar’s strength against a basket of six rival currencies, fell 0.5% to 96.16 and is lower currently. Futures on US stock indices point to mixed openings today.

DJI rises above MA(200)   06/24/2019 Market Overview IFC Markets chart

FTSE 100 loss leader among European indexes

European stocks ended lower on Friday despite better than expected German and French purchasing manager surveys results. Both the GBP/USD and EUR/USD continued their advance with euro higher currently while Pound reversing lower. The Stoxx Europe 600 Index lost 0.4% Friday led by healthcare shares. The DAX 30 slipped 0.1% to 12339.92. France’s CAC 40 slid 0.1% and UK’s FTSE 100 lost 0.3% to 7345.78.

Nikkei lags behind Asian indexes

Asian stock indices are rising today after report China’s President Xi Jinping will attend the G-20 summit in Japan this week. Nikkei added 0.1% to 21285.99 with yen slide against the dollar intact. China’s markets are gaining: the Shanghai Composite Index is up 0.2% and Hong Kong’s Hang Seng Index is 0.2% higher. Australia’s All Ordinaries Index turned 0.2% higher despite the Australian dollar’s accelerating climb against the greenback.

Brent steady

Brent futures prices are steady today. Prices ended higher on Friday despite Baker Hughes report the number of active U.S. drilling rigs edged up by 1 to 789, following two consecutive weeks of declines: Brent for August settlement rose 1.2% to close at $65.20 a barrel Friday, gaining 5.1% for the week.

Market Analysis provided by IFCMarkets

Note:
This overview has an informative and tutorial character and is published for free. All the data, included in the overview, are received from public sources, recognized as more or less reliable. Moreover, there is no guarantee that the indicated information is full and precise. Overviews are not updated. The whole information in each overview, including opinion, indicators, charts and anything else, is provided only for familiarization purposes and is not financial advice or а recommendation. The whole text and its any part, as well as the charts cannot be considered as an offer to make a deal with any asset. IFC Markets and its employees under any circumstances are not liable for any action taken by someone else during or after reading the overview.

‘Outstanding’ Cost Metrics Place Oil & Gas Producer at Top of Coverage List

The Energy Report

Source: Streetwise Reports   06/20/2019

A review of those figures and revised Q2/19 estimates were given in a ROTH Capital Partners report.

In a June 18 research note, ROTH Capital Partners analyst John White reported that Goodrich Petroleum Corp.’s (GDP:NYSE) “excellent” three-year reserve replacement cost (RRC) and finding and development cost (F&DC) “are the best in our coverage.”

With its three-year RRC and its three-year F&DC, both at $1.96 per barrels of oil equivalent ($1.95/boe), the company ranks first among ROTH’s exploration and production coverage universe for each. The numbers is the same for both because all growth during that period occurred through drilling and not acquisitions.

“The figures demonstrate, in our view, the strong characteristics of the asset base and Goodrich’s management and technical expertise,” White commented.

White also presented ROTH’s revised estimates for Goodrich’s Q2/19. Forecasted cash flow per share and EBITDA are $1.29 million and $18 million, similar to its previous figures of $1.26 million and $18.2 million. Projected production is now higher, at 135,704 thousand cubic feet equivalent per day (135,704 Mcfe/day) versus 129,926 Mcfe/day previously.

ROTH lowered Goodrich’s realized natural gas price for Q2/19 to 2.3 per million British thermal units (2.3/MMBtu) from $2.40/MMBtu due to higher differentials, but noted it should not affect revenue.

In terms of expenses, ROTH expects higher transportation costs to offset lower operating costs. Its estimated earnings per share for Q2/19 is $0.16, down from its previous $0.25 on higher depreciation, depletion and amortization, only partially offset by lower interest expense.

ROTH has a Buy rating and a $23 per share price target on Goodrich, whose stock is currently trading at around $11.10 per share.

Sign up for our FREE newsletter at: www.streetwisereports.com/get-news

Disclosure:
1) Doresa Banning compiled this article for Streetwise Reports LLC and provides services to Streetwise Reports as an independent contractor. She or members of her household own securities of the following companies mentioned in the article: None. She or members of her household are paid by the following companies mentioned in this article: None.
2) The following companies mentioned in this article are billboard sponsors of Streetwise Reports: None. Click here for important disclosures about sponsor fees.
3) Comments and opinions expressed are those of the specific experts and not of Streetwise Reports or its officers. The information provided above is for informational purposes only and is not a recommendation to buy or sell any security.
4) The article does not constitute investment advice. Each reader is encouraged to consult with his or her individual financial professional and any action a reader takes as a result of information presented here is his or her own responsibility. By opening this page, each reader accepts and agrees to Streetwise Reports’ terms of use and full legal disclaimer. This article is not a solicitation for investment. Streetwise Reports does not render general or specific investment advice and the information on Streetwise Reports should not be considered a recommendation to buy or sell any security. Streetwise Reports does not endorse or recommend the business, products, services or securities of any company mentioned on Streetwise Reports.
5) From time to time, Streetwise Reports LLC and its directors, officers, employees or members of their families, as well as persons interviewed for articles and interviews on the site, may have a long or short position in securities mentioned. Directors, officers, employees or members of their immediate families are prohibited from making purchases and/or sales of those securities in the open market or otherwise from the time of the interview or the decision to write an article until three business days after the publication of the interview or article. The foregoing prohibition does not apply to articles that in substance only restate previously published company releases.

Disclosures from ROTH Capital Partners, Goodrich Petroleum Corp., Company Note, June 18, 2019

Regulation Analyst Certification (“Reg AC”): The research analyst primarily responsible for the content of this report certifies the following under Reg AC: I hereby certify that all views expressed in this report accurately reflect my personal views about the subject company or companies and its or their securities. I also certify that no part of my compensation was, is or will be, directly or indirectly, related to the specific recommendations or views expressed in this report.

ROTH makes a market in shares of Goodrich Petroleum Corp. and as such, buys and sells from customers on a principal basis.

A Research Analyst and/or a member of the Analyst’s household own(s) debt or equity securities of Goodrich Petroleum Corp. stock.

ROTH Capital Partners, LLC expects to receive or intends to seek compensation for investment banking or other business relationships with the covered companies mentioned in this report in the next three months.

( Companies Mentioned: GDP:NYSE,
)

Mining the ‘Sweat of the Sun’ in Nevada

By The Gold Report

Source: Streetwise Reports   06/20/2019

As the gold mining majors increasingly focus on Nevada deposits, they have taken notice of a small-cap explorer with prime properties.

For billions of years, exploding neutron stars have been mass-producing cascades of the proton-heavy atom that we humans called gold or, chemically, AU.

Stardust-blasted meteoroids regularly transport “the sweat of the sun” across light years. Speeding space rocks vaporize in our atmosphere, showering gold upon our planet, where, over eons, the precious rain is buried and then uplifted by tectonic movements.

It has been calculated that all of the Earth’s encapsulated gold, if it had remained at the surface, would form a miles-deep crust. But, of course that is not how nature works. As mountain ranges rise and fall, fracturing, generating incredible pressures, AU atoms combine with themselves and other elements, percolating toward the surface following discontinuities.

Reservoirs of gold can be mined, either by hammering at solid veins, or by crushing tons of ore to extract glittering grams of concentrated value. Of course, there are vast quantities of gold scattered deep and wide beneath our major cities and suburbs and oceans, but access to the element is best achieved in the desert lands, for obvious reasons.

Enter: geologically roiled and sparsely populated Nevada, one of the most productive gold fields. Zooming in on Nevada, there is a stretch of thrust-faulted, erosion-revealed, gold and silver-laden land—five miles wide and forty miles long—called the Carlin Trend.

Mined with modern methods beginning a decade ago, the Carlin Trend has produced more than 70 million ounces of gold. That comes to US$85 billion at 2010 prices.

Major gold companies—including Newmont Goldcorp and Barrick Gold Corporation—are focusing substantial capital investment on exploring the wealth of deposits in the Carlin Trend. The majors are acquiring raw acreage and developing regional mining and milling infrastructure. Thousands of exploratory holes drilled in the region by large and small explorers are revealing a range of potentially profitable mineralization ratios—disciplined by the price volatility of the cyclical commodity markets for precious metals.

And that is the wild-catting atmosphere in which a junior firm called Gold Standard Ventures Corp. (GSV:TSX.V; GSV:NYSE) now finds itself to be more wooed then wooer.

Gold Standard Ventures has a large portfolio of gold mineralization resources in Nevada. Its flagship property is the Railroad-Pinion project covering tens of thousands of acres of land astride the Carlin Trend in Elko County. There, the Vancouver-based firm owns or has an option on 29,941 acres of subsurface mineral rights in the form of patented or unpatented mineral lode and 23,628 acres of subsurface mineral rights secured or controlled by a contractual interest in private surface and mineral property. Gold Standard Ventures has identified six deposits in its Carlin Trend project: Pinion Oxide, Dark Star, North Bullion, Bald Mountain, Jasperoid Wash and Dixie Creek.

The company has announced mineral resource estimates at Dark Star, North Bullion and Pinion Oxide and is poised to examine the other deposits.

Of note, the Railroad-Pinion project abuts the Emigrant mine, which investment bank Alliance Global Partners reports could make the project “an attractive acquisition candidate for Newmont Goldcorp in the near future.”

In fact, Newmont Goldcorp already owns nearly 14% of GVS; Oceana Gold Corporation owns 15.6%; FCMI Parent Company controls 11.7%. Institutional ownership of GSV stock clocks in at 34.3%. Insiders and associates hold 8%. That leave only 16.8% available for retail investors.

In an interview with Streetwise Reports, Gold Standard Ventures’ CEO John Awde said, “It is quite rare to to have so many corporates on a junior’s shareholder registry before the firm generates revenue! That speaks to the quality of our assets.”

Awde explained, “Gold Standard holds the second largest contiguous land package in the Carlin Trend. With the majors developing adjacent properties, the resulting infrastructure cheapens our projected costs. We’ve been drilling Dark Star for three years; it remains the focus of our $2 million drilling budget for 2019.”

The company has completed its 2019 phase 1 drill program on the Dark Star target with 10,700 meters of drilling in 71 reverse-circulation holes and one core hole. The core hole cut 117.3 meters of 1.54 g/t gold, including 44.3 meters of 2.55 g/t gold. Ten percent of the drill holes intercepted high-grade mineralization (avg. ~2 g/t Au), the majority of drill holes have intercepted low-grade mineralization (avg. ~0.2 g/t Au).

Awde commented that while unseasonable snow and rain delayed the start of the next round of drilling, the auguring is now underway and results will be reported soon. Gold Standard also plans to announce the results of a maiden mineral resource estimate on its Jasperoid Wash property located near the Dark Star, when the data is available.

The company’s Lewis project is located 30 miles west of Dark Star next to Newmont Goldcorp’s Phoenix mine, which is undergoing expansion and environmental remediation. In March, Gold Standard initiated a four-hole program at Lewis. Awde said that the program is testing high-value targets in the Buena Vista-Meagher corridor and the Virgin deposit footwall. He anticipates completing the NI 43-101 mineral resource estimate for the Lewis project by the end of summer. Awde expects the Lewis project to hold 250,000 to 300,000 ounces of gold at a grade of 1 g/t Au and 2 million ounces of silver.

How does the market view Gold Standard Ventures’ future?

Alliance Global Partners (AGP) calculates GSV’s Net Asset Value (NAV) at ~US$453 million or $1.60 per share. That financial model assumes an average annual production of 154,000 ounces of gold at the Railroad-Pinion project for the first seven years. That calculation factors in the Lewis project resource and also the upcoming maiden mineral resource estimate for the North Bullion deposit. AGP’s NAV calculation assumes the long-term price of gold and silver of $1,300/oz Au and $20/oz Ag, respectively. The bank is applying a discount rate of 12% given the expected production start date of 2021. Alliance Global Partners anticipates that Gold Standard will need to raise CA$15 million to fund operating expenses.

Brien Lundin’s Gold Newsletter is bullish on GSV. Lundin particularly likes that GSV’s drill results show grades improving at depth. “GSV’s share price has been largely range-bound of late, but it continues to trade at levels the make it an attractive speculation on an improvement in the gold market. For those who like the yellow metal’s prospects in the back half of the year, Gold Standard Ventures remains a buy,” Lundin reports.

Sign up for our FREE newsletter at: www.streetwisereports.com/get-news

Disclosure:
1) Peter Byrne compiled this article for Streetwise Reports LLC and provides services to Streetwise Reports as an independent contractor. He or members of his household own securities of the following companies mentioned in the article: None. He or members of his household are paid by the following companies mentioned in this article: None.
2) The following companies mentioned in this article are billboard sponsors of Streetwise Reports: Gold Standard Ventures. Click here for important disclosures about sponsor fees.
3) Comments and opinions expressed are those of the specific experts and not of Streetwise Reports or its officers. The information provided above is for informational purposes only and is not a recommendation to buy or sell any security.
4) The article does not constitute investment advice. Each reader is encouraged to consult with his or her individual financial professional and any action a reader takes as a result of information presented here is his or her own responsibility. By opening this page, each reader accepts and agrees to Streetwise Reports’ terms of use and full legal disclaimer. This article is not a solicitation for investment. Streetwise Reports does not render general or specific investment advice and the information on Streetwise Reports should not be considered a recommendation to buy or sell any security. Streetwise Reports does not endorse or recommend the business, products, services or securities of any company mentioned on Streetwise Reports.
5) From time to time, Streetwise Reports LLC and its directors, officers, employees or members of their families, as well as persons interviewed for articles and interviews on the site, may have a long or short position in securities mentioned. Directors, officers, employees or members of their immediate families are prohibited from making purchases and/or sales of those securities in the open market or otherwise from the time of the interview or the decision to write an article, until one week after the publication of the interview or article. As of the date of this article, officers and/or employees of Streetwise Reports LLC (including members of their household) own securities of Newmont Goldcorp, a company mentioned in this article.

Additional Disclosures

Gold Newsletter: The publisher and its affiliates, officers, directors and owner actively trade in investments discussed in this newsletter. They may have positions in the securities recommended and may increase or decrease such positions without notice. The publisher is not a registered investment advisor. Authors of articles or special reports are sometimes compensated for their services.

( Companies Mentioned: GSV:TSX.V; GSV:NYSE,
)

‘Strong Well Results Continue to Drive the Story’ for SM Energy Even as Target Price Slashed

The Energy Report

Source: Streetwise Reports   06/20/2019

The raised production guidance for Q2/19 and full-year 2019 was discussed in a Raymond James report.

In a June 18 research note, John Freeman reported that Raymond James lowered its target price on SM Energy Co. (SM:NYSE) to $20 per share from $26 to account for recent weakness in commodity pricing. The oil and gas firm’s current share price is around $12.10.

However, Raymond James also raised its Q2/19 and full-year 2019 volume estimates for SM Energy after management increased production guidance by 0.4 million barrels of oil equivalent on better-than-expected Q2/19 production so far. SM Energy’s new figure implies about 3% higher production in Q2/19 than consensus and Raymond James’ forecasts and about a 4% higher oil volume than previous guidance.

“Continued strong well results prove the quality of SM’s acreage and the company’s confidence in delivering on its 2019 development plans, supported by a roughly 1% increase to full-year volume guidance,” Freeman indicated.

The analyst reiterated that the Colorado-based exploration and development company had encouraging results from its Wolfcamp D and Dean interval tests in the Permian Basin. “While there are no plans on the table, we think SM’s efforts to prove up its south Texas acreage could foreshadow a potential sale process for the asset over the next one to years,” he purported.

Raymond James has an Outperform rating on SM Energy.

Sign up for our FREE newsletter at: www.streetwisereports.com/get-news

Disclosure:
1) Doresa Banning compiled this article for Streetwise Reports LLC and provides services to Streetwise Reports as an independent contractor. She or members of her household own securities of the following companies mentioned in the article: None. She or members of her household are paid by the following companies mentioned in this article: None.
2) The following companies mentioned in this article are billboard sponsors of Streetwise Reports: None. Click here for important disclosures about sponsor fees.
3) Comments and opinions expressed are those of the specific experts and not of Streetwise Reports or its officers. The information provided above is for informational purposes only and is not a recommendation to buy or sell any security.
4) The article does not constitute investment advice. Each reader is encouraged to consult with his or her individual financial professional and any action a reader takes as a result of information presented here is his or her own responsibility. By opening this page, each reader accepts and agrees to Streetwise Reports’ terms of use and full legal disclaimer. This article is not a solicitation for investment. Streetwise Reports does not render general or specific investment advice and the information on Streetwise Reports should not be considered a recommendation to buy or sell any security. Streetwise Reports does not endorse or recommend the business, products, services or securities of any company mentioned on Streetwise Reports.
5) From time to time, Streetwise Reports LLC and its directors, officers, employees or members of their families, as well as persons interviewed for articles and interviews on the site, may have a long or short position in securities mentioned. Directors, officers, employees or members of their immediate families are prohibited from making purchases and/or sales of those securities in the open market or otherwise from the time of the interview or the decision to write an article until three business days after the publication of the interview or article. The foregoing prohibition does not apply to articles that in substance only restate previously published company releases.

Disclosures from Raymond James, SM Energy Company, June 18, 2019

ANALYST INFORMATION

Analysts Holdings and Compensation: Equity analysts and their staffs at Raymond James are compensated based on a salary and bonus system. Several factors enter into the bonus determination, including quality and performance of research product, the analyst’s success in rating stocks versus an industry index, and support effectiveness to trading and the retail and institutional sales forces. Other factors may include but are not limited to: overall ratings from internal (other than investment banking) or external parties and the general productivity and revenue generated in covered stocks.

The analyst John Freeman, primarily responsible for the preparation of this research report, attests to the following: (1) that the views and opinions rendered in this research report reflect his or her personal views about the subject companies or issuers and (2) that no part of the research analyst’s compensation was, is, or will be directly or indirectly related to the specific recommendations or views in this research report. In addition, said analyst(s) has not received compensation from any subject company in the last 12 months.

RAYMOND JAMES RELATIONSHIP DISCLOSURES
Certain affiliates of the RJ Group expect to receive or intend to seek compensation for investment banking services from all companies under research coverage within the next three months.

Raymond James & Associates, Inc. makes a market in the shares of SM Energy Company.

Raymond James & Associates received non-investment banking securities-related compensation from SM Energy Company within the past 12 months.

Additional Risk and Disclosure information, as well as more information on the Raymond James rating system and suitability categories, is available here.

( Companies Mentioned: SM:NYSE,
)

This week in monetary policy: Kyrgyzstan, Hungary, New Zealand, Thailand, Iceland, Czech Rep., Fiji, Botswana, Mexico, Jamaica, Bulgaria, Trinidad & Tobago and Dominican Rep.

By CentralBankNews.info

    This week – June 23 through June 29 – central banks from 13 countries or jurisdictions are scheduled to decide on monetary policy: Kyrgyz Republic, Hungary, New Zealand, Thailand, Iceland, Czech Republic, Fiji, Botswana, Mexico, Jamaica, Bulgaria, Trinidad and Tobago, and Dominican Republic.
    Following table includes the name of the country, the date of the next policy decision, the current policy rate, the result of the last policy decision, the change in the policy rate year to date, the rate one year ago and the country’s MSCI classification.
    The table is updated when the latest decisions are announced and can always accessed by clicking on This Week.
WEEK 26
JUN 23 – JUN 29, 2019:
KYRGYZSTAN24-Jun4.25%-25-504.75%
HUNGARY25-Jun0.90%000.90%         EM
NEW ZEALAND26-Jun1.50%-25-251.75%         DM
THAILAND26-Jun1.75%001.50%         EM
ICELAND26-Jun4.00%-50-504.25%
CZECH REPUBLIC26-Jun2.00%25251.00%         EM
FIJI27-Jun0.50%000.50%
BOTSWANA27-Jun5.00%005.00%
MEXICO27-Jun8.25%007.75%         EM
JAMAICA27-Jun0.75%-50-1002.00%
BULGARIA28-Jun0.00%000.00%         FM
TRINIDAD & TOBAGO28-Jun5.00%005.00%
DOMINICAN REP.28-Jun5.50%005.25%


COT Report: USD Index, WTI Crude & Silver bets rise. Euro, Yen & Gold bets surge

By CountingPips.comReceive our weekly COT Reports by Email

Here are this week’s links to the latest Commitment of Traders data changes that were released on Friday.

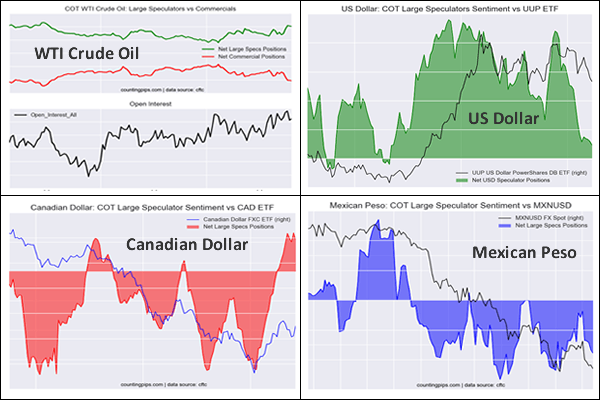
This week in the COT data, the USD Index Speculators raised their bullish bets after two down weeks. Euro and Japanese yen speculative positions saw huge improvements on the week (lower bearish levels) while the Mexican peso bullish positions rose after recent declines.

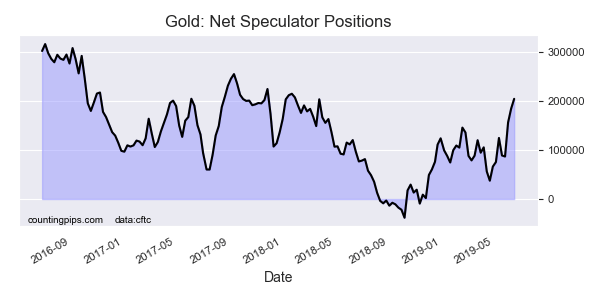
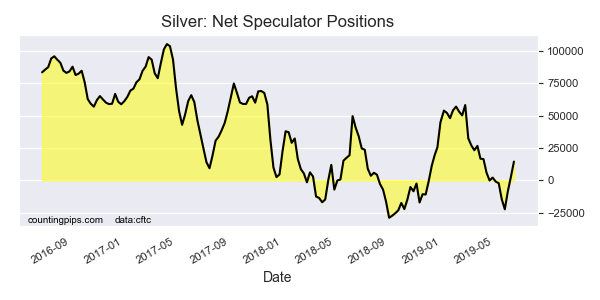
Precious metals speculators continued to boost their Gold bullish positions sharply for a third week and pushed Gold bets to the best level since January 30th of 2018. Silver bets also improved for a third week and are now in an overall bullish position for a second week.

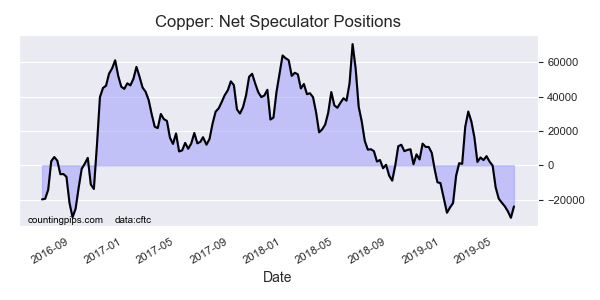
Copper speculators reduced their short bets this week after a streak of bearishness that brought positions to the most bearish standing in 155 weeks.

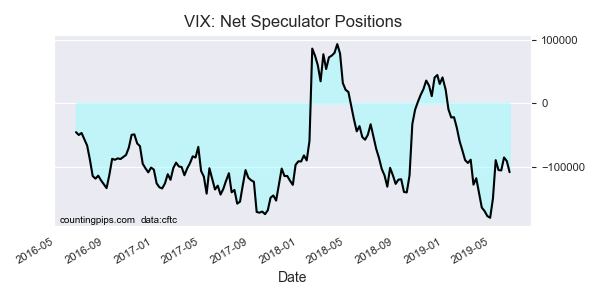
VIX speculators added to their bearish positions again this week and have now added to short bets in four out of the past five weeks. The large speculator position had recently risen to a record high position of -180,359 contracts on April 30th before pulling back on negative bets. The spec bearish positions have recently started to rebuild.

The 10-Year Bond speculators raised their net short positions this week after a sharp selloff last week. The speculators have found themselves on the other side of the trend in 10-Year bond prices in recent months and continued that trend this week.

Finally, the WTI Crude oil speculators increased their bullish net positions for the first time in eight weeks this week although this was due to short-covering and not exactly a sign of strength. Positions had dropped by a total of -195,704 contracts in the previous seven weeks before this week’s turnaround.


US Dollar Index Speculators raised bullish bets while Euro & Yen bets surged

Large currency speculators increased their net positions in the US Dollar Index futures markets this week, according to the latest Commitment of Traders (COT) data released by the Commodity Futures Trading Commission (CFTC) on Friday. See full article.


WTI Crude Oil Speculators bullish bets rebounded after 7 down weeks

The large speculator contracts of WTI crude futures totaled a net position of 363,087 contracts, according to the latest data this week. This was a change of 11,432 contracts from the previous weekly total. See full article.


10-Year Note Speculators added to their bearish bets this week

Large speculator contracts of the 10-Year Bond futures totaled a net position of -402,984 contracts, according to the latest data this week. This was a change of -36,996 contracts from the previous weekly total. See full article.


Gold Speculators continued to push their bullish bets higher this week

Large precious metals speculator contracts of the Gold futures totaled a net position of 204,323 contracts, according to the latest data this week. This was a change of 20,085 contracts from the previous weekly total. See full article.


VIX Speculators pushed their bearish bets higher this week

Large stock market volatility speculator contracts of the VIX futures totaled a net position of -108,644 contracts, according to the latest data this week. This was a change of -17,462 contracts from the previous weekly total. See full article.


Silver Speculators further boosted their bullish bets for a 3rd week

Large precious metals speculator contracts of the silver futures totaled a net position of 14,516 contracts, according to the latest data this week. This was a change of 11,856 contracts from the previous weekly total. See full article.


Copper Speculators reduced their bearish bets for 1st time in 9 weeks

Metals speculator contracts of the copper futures totaled a net position of -23,952 contracts, according to the latest data this week. This was a change of 6,569 contracts from the previous weekly total. See full article.


Article By CountingPips.comReceive our weekly COT Reports by Email

*COT Report: The COT data, released weekly to the public each Friday, is updated through the most recent Tuesday (data is 3 days old) and shows a quick view of how large speculators or non-commercials (for-profit traders) were positioned in the futures markets.

The CFTC categorizes trader positions according to commercial hedgers (traders who use futures contracts for hedging as part of the business), non-commercials (large traders who speculate to realize trading profits) and nonreportable traders (usually small traders/speculators).

Find CFTC criteria here: (http://www.cftc.gov/MarketReports/CommitmentsofTraders/ExplanatoryNotes/index.htm).
US Dollar Index Speculators raised bullish bets while Euro & Yen bets surged

June 22nd – By CountingPips.comReceive our weekly COT Reports by Email

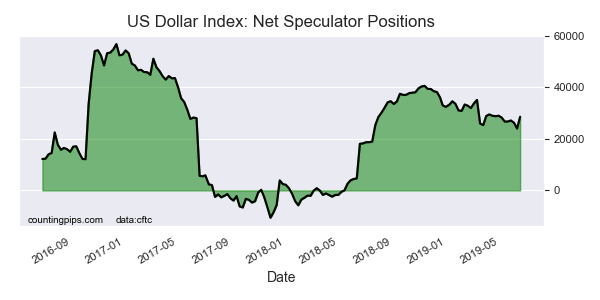
US Dollar Index Speculator Positions

Large currency speculators raised their bullish net positions in the US Dollar Index futures markets this week while also sharply cutting back on bearish bets in the Japanese yen and the euro, according to the latest Commitment of Traders (COT) data released by the Commodity Futures Trading Commission (CFTC) on Friday.

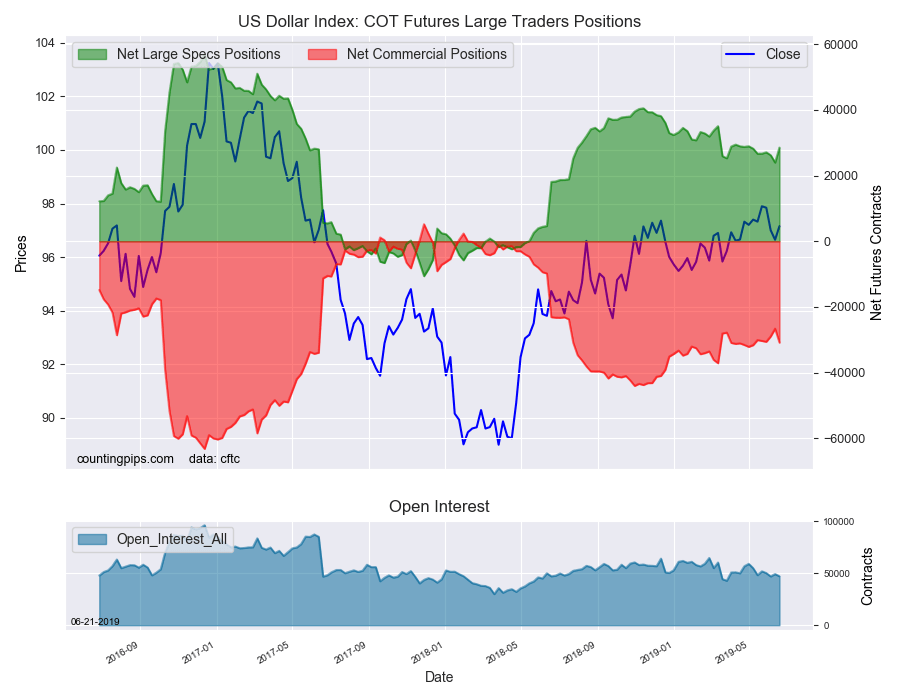
The non-commercial futures contracts of US Dollar Index futures, traded by large speculators and hedge funds, totaled a net position of 28,549 contracts in the data reported through Tuesday June 18th. This was a weekly advance of 4,560 contracts from the previous week which had a total of 23,989 net contracts.

This week’s net position was the result of the gross bullish position growing by 3,434 contracts (to a weekly total of 40,319 contracts) while the gross bearish position fell by -1,126 contracts for the week (to a weekly total of 11,770 contracts).

The large speculators added to their bullish bets for the dollar after decreasing their positions in the previous two weeks. The gain brought the overall long position to the highest level in seven weeks and above +28,000 contracts.

The latest COT data is through the close on Tuesday and was a day before the US Federal Reserve meeting which suggested (traders are more certain) that interest rate reductions could be coming.


Individual Currencies Data this week:

In all of the major currency contracts data, we saw three substantial changes (+ or – 10,000 contracts) in the speculators category this week.

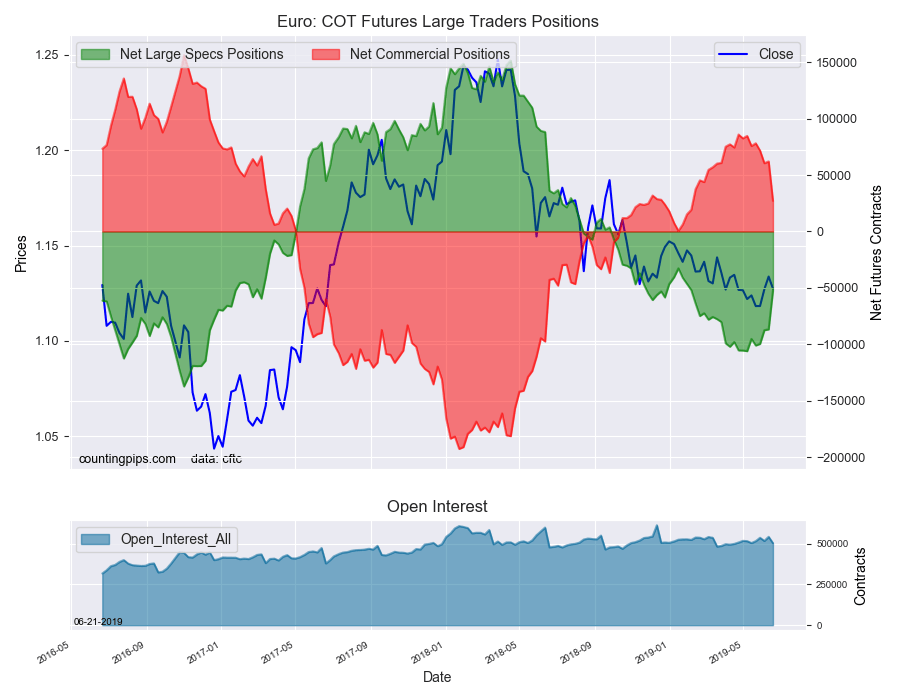
Euro currency speculators sharply reduced their bearish positions this week by over 34,000 contracts. This is the largest one-week gain for the euro since October 2nd of 2017 when bets rose by over 35,000 contracts. The change this week brought the euro bearish position sharply lower and to the lowest level since February. Overall, the euro has seen improving positions for four straight weeks.

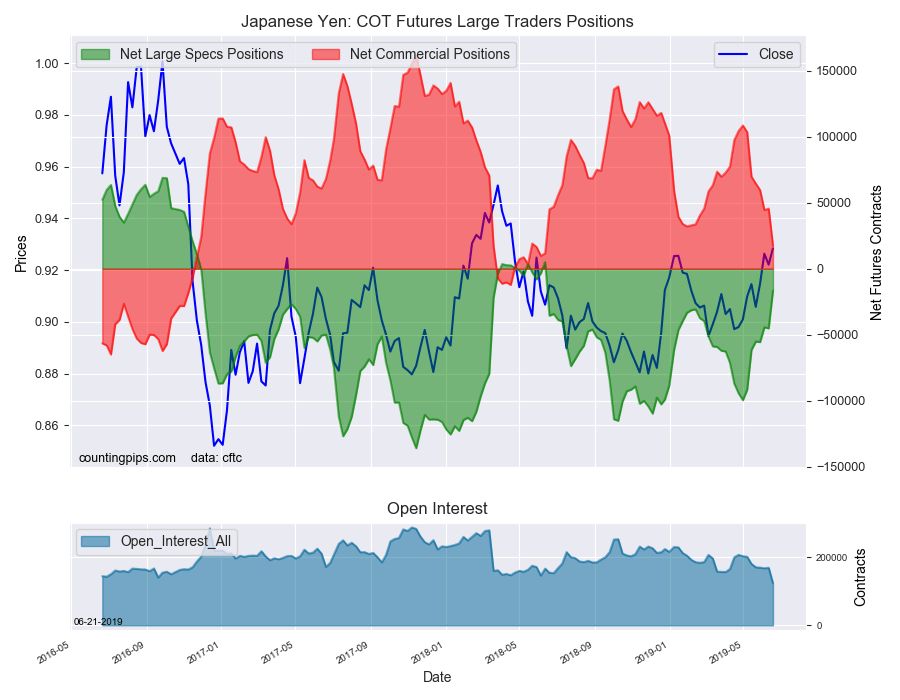
Japanese yen speculators also sharply cut back on their bearish bets this week by over 28,000 net contracts. The yen position has improved mighty fast as the bearish position was at -99,599 contracts on April 30th and is now down to just -16,565 contracts on June 18th. The yen standing is at the best level since just about a year ago when positions were in a small bullish level on June 12th 2018.

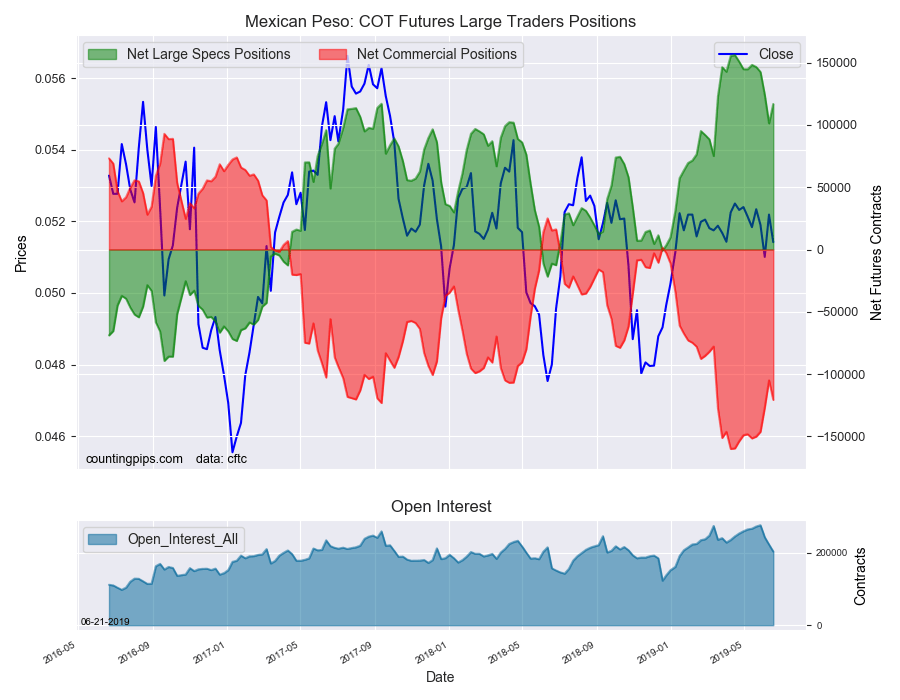
Mexican peso positions rebounded this week by over +15,000 contracts after four straight declining weeks as well as decreases in seven out of the previous eight weeks. Peso bullish bets had ascended to a record high bullish position of +156,030 contracts on April 16th before speculators started cutting their long positions. This week’s gain keeps the MXN net position above the +100,000 net contract level for a fourteenth straight week which is the longest streak on record for MXN speculator bets (a previous run in 2012 lasted 13 straight weeks).

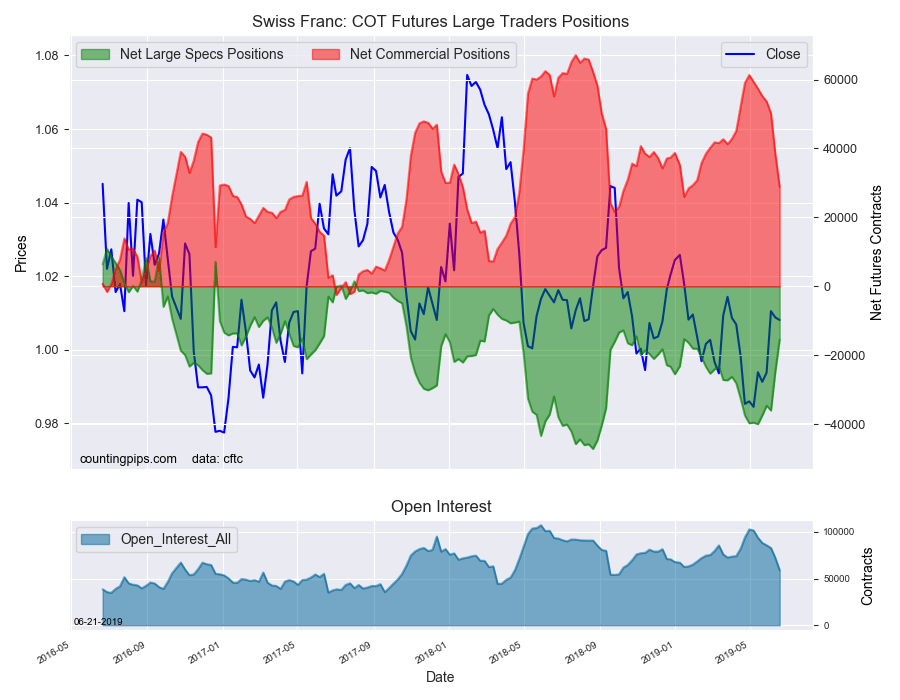
Overall, the major currencies that saw improving speculator positions this week were the US dollar index (4,560 weekly change in contracts), euro (34,462 contracts), Japanese yen (28,600 contracts), Swiss franc (9,304 contracts) and the Mexican peso (15,491 contracts).

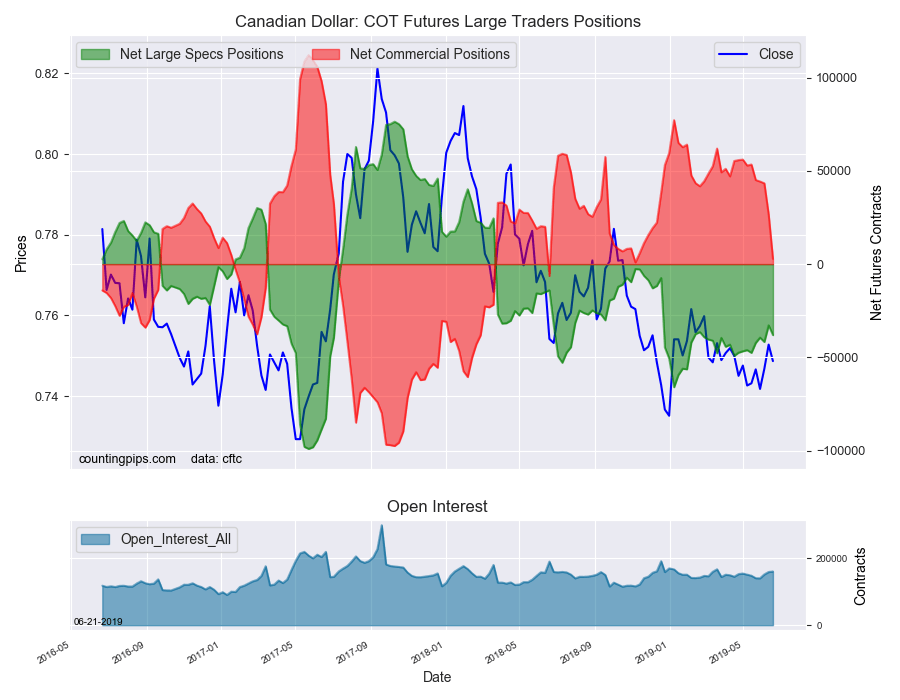
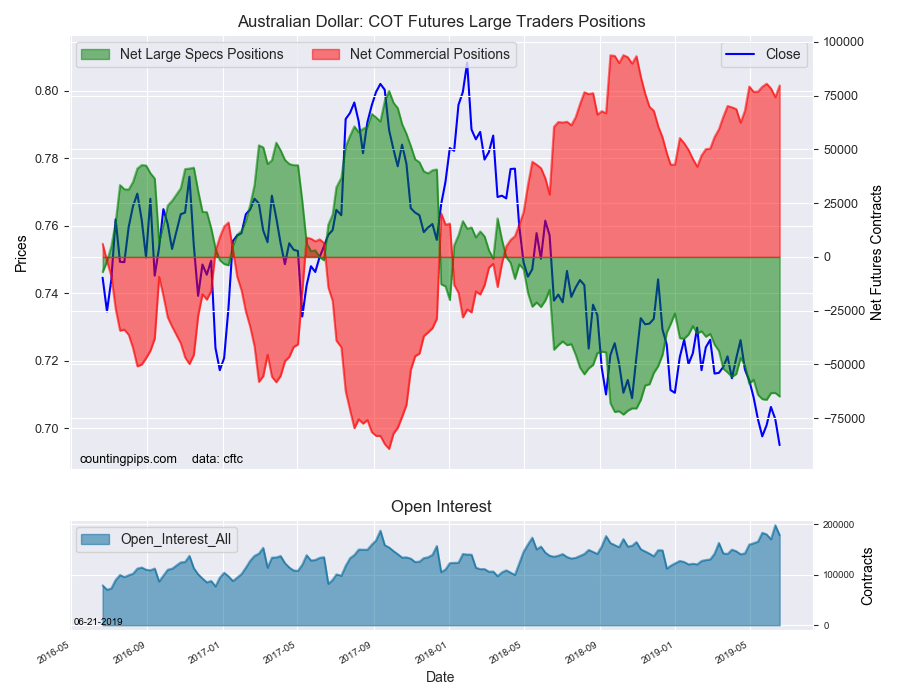
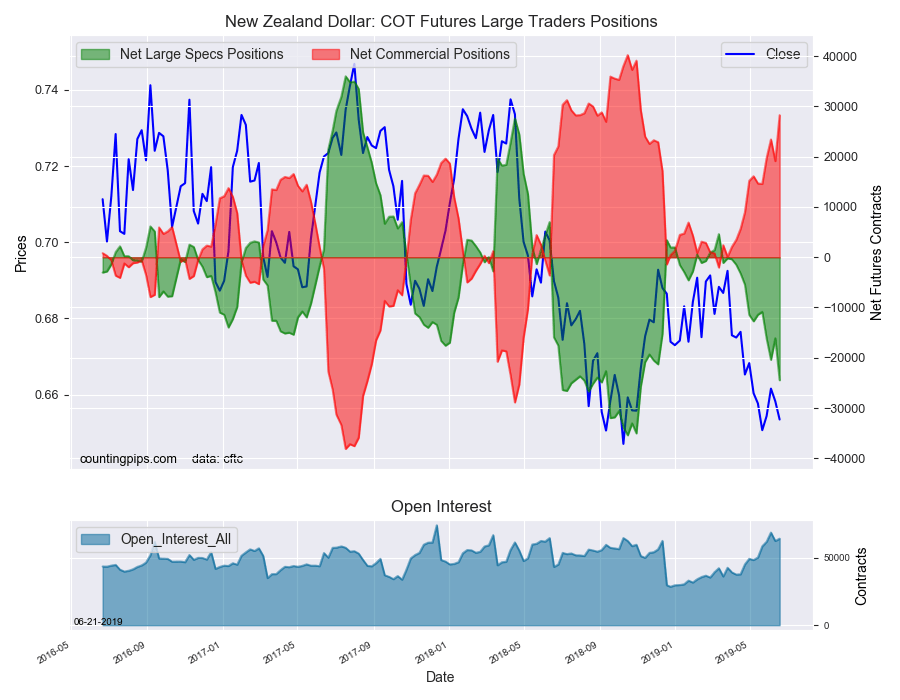
The currencies whose speculative bets declined this week were the British pound sterling (-7,763 weekly change in contracts), Canadian dollar (-5,231 contracts), Australian dollar (-1,637 contracts) and the New Zealand dollar (-8,346 contracts).

Other Notables for the week:

Swiss franc positions have started to improve in recent weeks after reaching a cycle low of -40,010 contracts on May 14th. Since then, speculator positions have improved four out of five weeks and by a total of +24,526 net contracts. The CHF has averaged a gain above +10,000 contracts in the past two weeks and now sit at the least bearish position since January 15th.

See the table and individual currency charts below.


Table of Large Speculator Levels & Weekly Changes:

CurrencyNet Speculator PositionSpecs Weekly Change
USD Index28,5494,560
EuroFx-52,33034,462
GBP-52,564-7,763
JPY-16,56528,600
CHF-15,4849,304
CAD-38,071-5,231
AUD-64,863-1,637
NZD-24,468-8,346
MXN116,80615,491


This latest COT data is through Tuesday and shows a quick view of how large speculators or non-commercials (for-profit traders) were positioned in the futures markets. All currency positions are in direct relation to the US dollar where, for example, a bet for the euro is a bet that the euro will rise versus the dollar while a bet against the euro will be a bet that the dollar will gain versus the euro.


Weekly Charts: Large Trader Weekly Positions vs Price

EuroFX:

The Euro large speculator standing this week equaled a net position of -52,330 contracts in the data reported through Tuesday. This was a weekly lift of 34,462 contracts from the previous week which had a total of -86,792 net contracts.


British Pound Sterling:

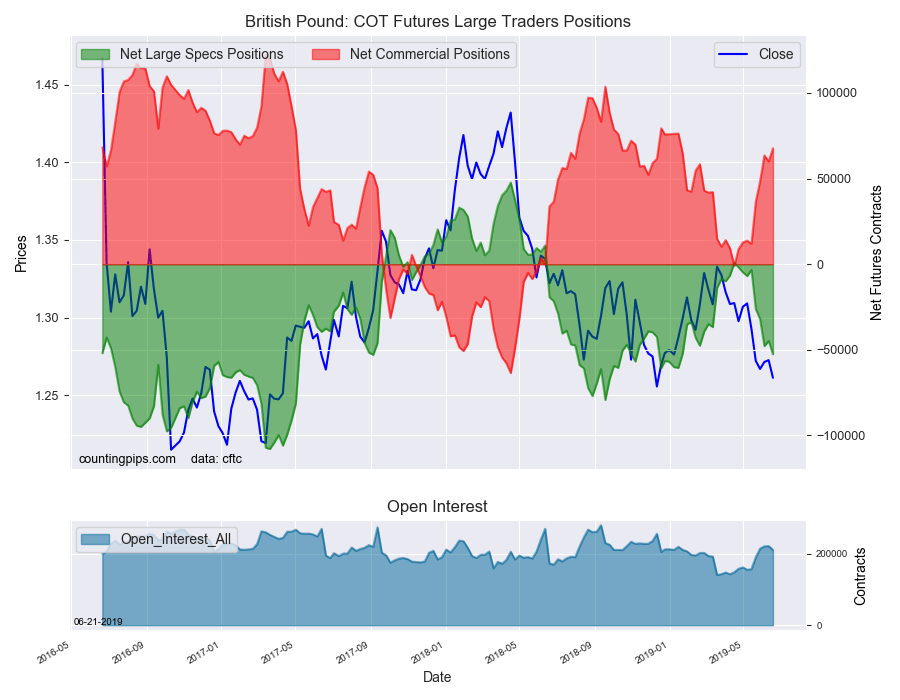
The large British pound sterling speculator level equaled a net position of -52,564 contracts in the data reported this week. This was a weekly fall of -7,763 contracts from the previous week which had a total of -44,801 net contracts.


Japanese Yen:

Large Japanese yen speculators reached a net position of -16,565 contracts in this week’s data. This was a weekly lift of 28,600 contracts from the previous week which had a total of -45,165 net contracts.


Swiss Franc:

The Swiss franc speculator standing this week totaled a net position of -15,484 contracts in the data through Tuesday. This was a weekly lift of 9,304 contracts from the previous week which had a total of -24,788 net contracts.


Canadian Dollar:

Canadian dollar speculators reached a net position of -38,071 contracts this week. This was a fall of -5,231 contracts from the previous week which had a total of -32,840 net contracts.


Australian Dollar:

The large speculator positions in Australian dollar futures resulted in a net position of -64,863 contracts this week in the data ending Tuesday. This was a weekly lowering of -1,637 contracts from the previous week which had a total of -63,226 net contracts.


New Zealand Dollar:

The New Zealand dollar speculative standing recorded a net position of -24,468 contracts this week in the latest COT data. This was a weekly decrease of -8,346 contracts from the previous week which had a total of -16,122 net contracts.


Mexican Peso:

Mexican peso speculators equaled a net position of 116,806 contracts this week. This was a weekly advance of 15,491 contracts from the previous week which had a total of 101,315 net contracts.


Article By CountingPips.comReceive our weekly COT Reports by Email

*COT Report: The COT data, released weekly to the public each Friday, is updated through the most recent Tuesday (data is 3 days old) and shows a quick view of how large speculators or non-commercials (for-profit traders) were positioned in the futures markets.

The CFTC categorizes trader positions according to commercial hedgers (traders who use futures contracts for hedging as part of the business), non-commercials (large traders who speculate to realize trading profits) and nonreportable traders (usually small traders/speculators).

Find CFTC criteria here: (http://www.cftc.gov/MarketReports/CommitmentsofTraders/ExplanatoryNotes/index.htm).

WTI Crude Oil Speculators bullish bets rebounded after 7 down weeks

June 22nd – By CountingPips.comReceive our weekly COT Reports by Email

WTI Crude Oil Non-Commercial Speculator Positions:

Large energy speculators raised their bullish net positions in the WTI Crude Oil futures markets this week after a streak of several weeks lower, according to the latest Commitment of Traders (COT) data released by the Commodity Futures Trading Commission (CFTC) on Friday.

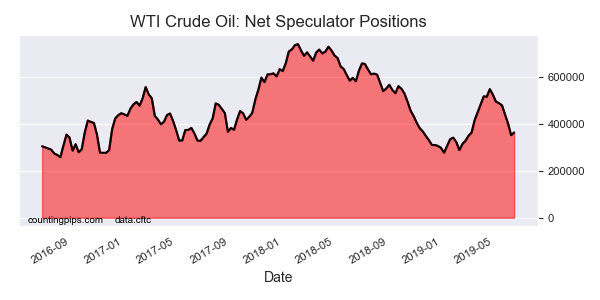
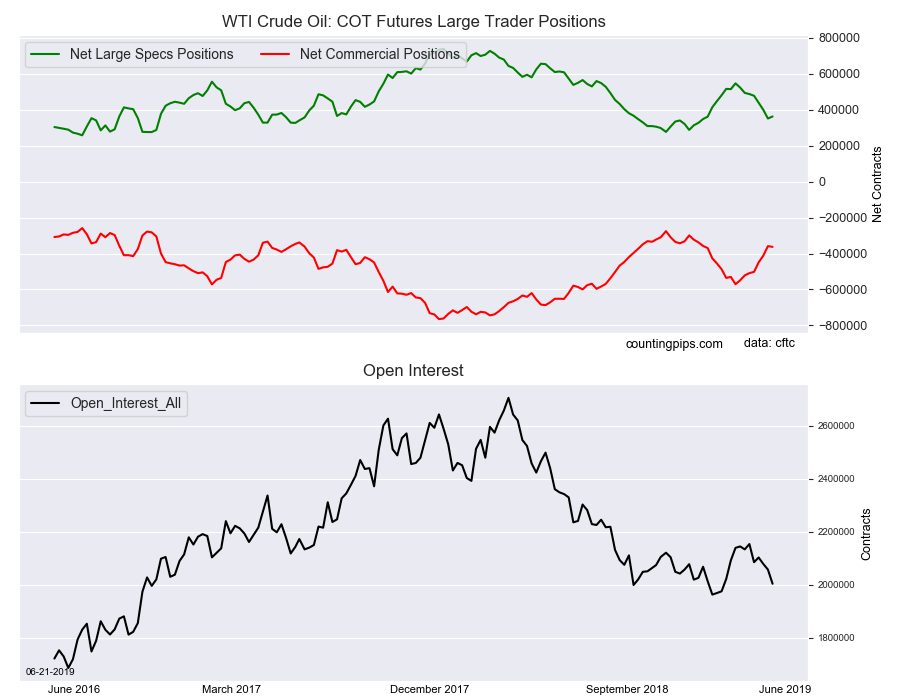
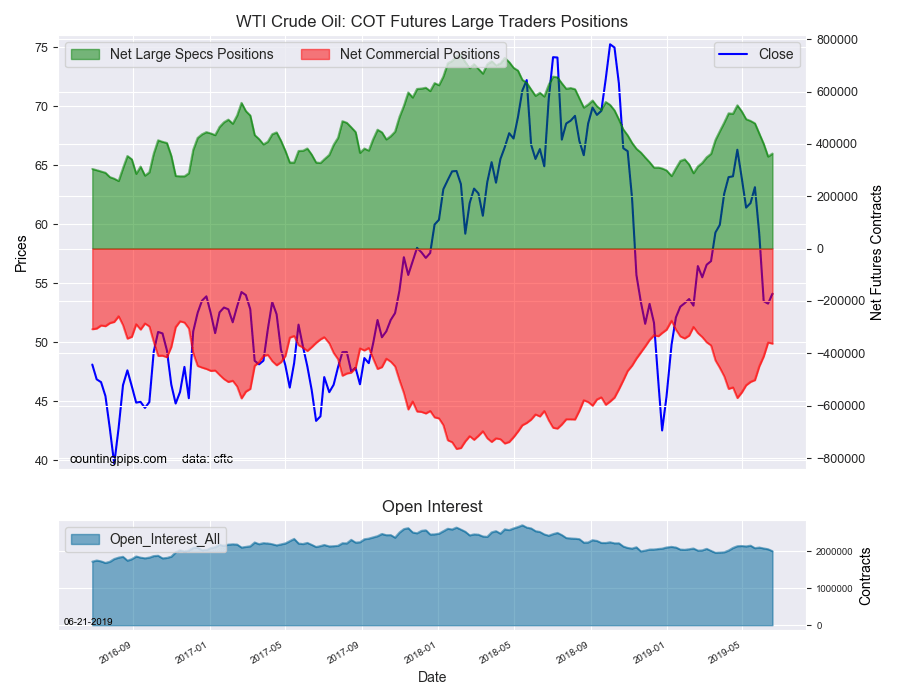
The non-commercial futures contracts of WTI Crude Oil futures, traded by large speculators and hedge funds, totaled a net position of 363,087 contracts in the data reported through Tuesday June 18th. This was a weekly gain of 11,432 net contracts from the previous week which had a total of 351,655 net contracts.

The week’s net position was the result of the gross bullish position (longs) falling by -12,708 contracts (to a weekly total of 502,749 contracts) but was overcome by the gross bearish position (shorts) which dropped by -24,140 contracts for the week (to a total of 139,662 contracts).

The large speculator position rose for the first time in eight weeks although the gain was the result of short covering and not a great sign of strength. Positions had fallen by a total of -195,704 contracts in the previous seven weeks before this week’s rebound.

The current speculator sentiment remains bullish but is under the +400,000 net contract level for a second straight week.

WTI Crude Oil Commercial Positions:

The commercial traders position, hedgers or traders engaged in buying and selling for business purposes, totaled a net position of -362,669 contracts on the week. This was a weekly drop of -4,050 contracts from the total net of -358,619 contracts reported the previous week.

WTI Crude Oil Futures:

Over the same weekly reporting time-frame, from Tuesday to Tuesday, the WTI Crude Oil Futures (Front Month) closed at approximately $54.11 which was a boost of $0.84 from the previous close of $53.27, according to unofficial market data.

*COT Report: The COT data, released weekly to the public each Friday, is updated through the most recent Tuesday (data is 3 days old) and shows a quick view of how large speculators or non-commercials (for-profit traders) as well as the commercial traders (hedgers & traders for business purposes) were positioned in the futures markets.

The CFTC categorizes trader positions according to commercial hedgers (traders who use futures contracts for hedging as part of the business), non-commercials (large traders who speculate to realize trading profits) and nonreportable traders (usually small traders/speculators).

Find CFTC criteria here: (http://www.cftc.gov/MarketReports/CommitmentsofTraders/ExplanatoryNotes/index.htm).

Article By CountingPips.comReceive our weekly COT Reports by Email

10-Year Note Speculators added to their bearish bets this week

June 22nd – By CountingPips.comReceive our weekly COT Reports by Email

10-Year Note Non-Commercial Speculator Positions:

Large bond speculators increased their bearish net positions in the 10-Year Note futures markets this week, according to the latest Commitment of Traders (COT) data released by the Commodity Futures Trading Commission (CFTC) on Friday.

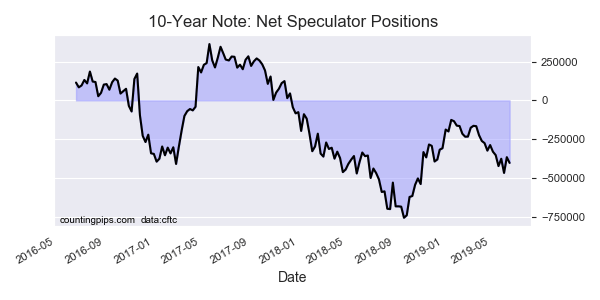
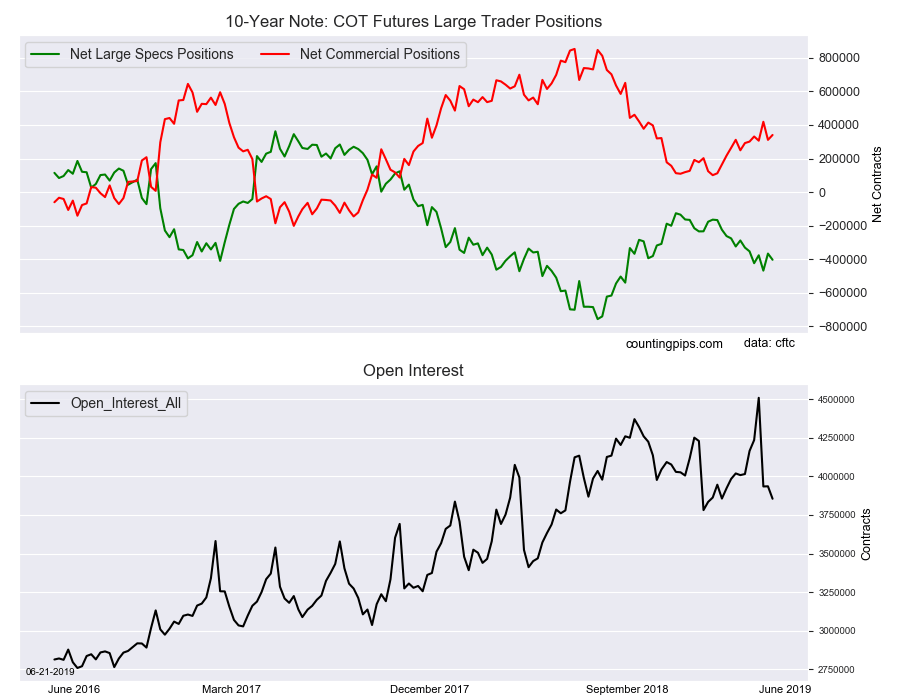
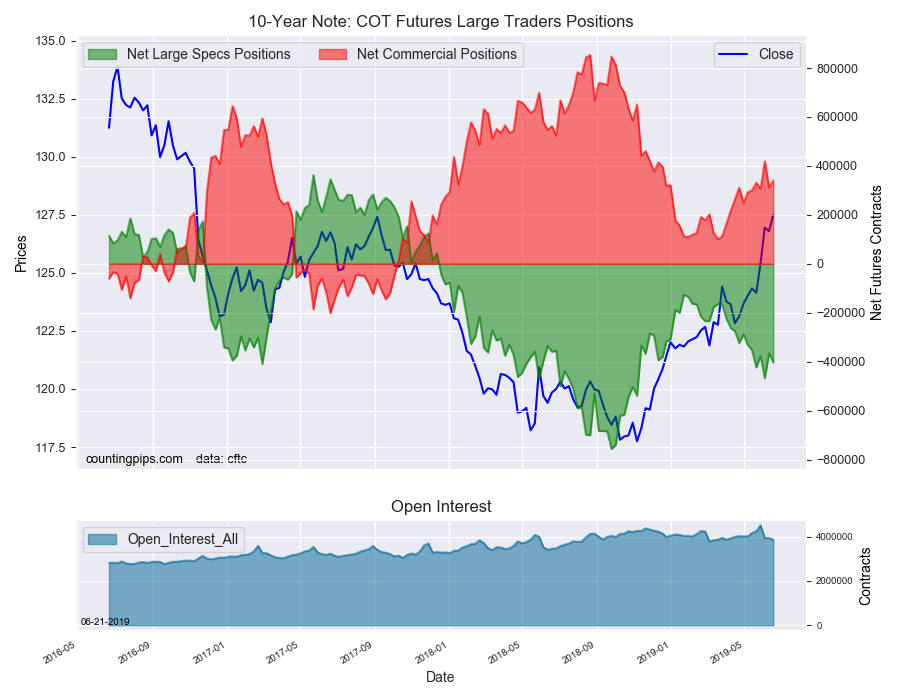
The non-commercial futures contracts of 10-Year Note futures, traded by large speculators and hedge funds, totaled a net position of -402,984 contracts in the data reported through Tuesday June 18th. This was a weekly change of -36,996 net contracts from the previous week which had a total of -365,988 net contracts.

The week’s net position was the result of the gross bullish position (longs) declining by -22,496 contracts (to a weekly total of 621,005 contracts) while the gross bearish position (shorts) increased by 14,500 contracts for the week (to a total of 1,023,989 contracts).

The large speculators raised their bearish bets this week following a sharp contraction by 101,714 contracts last week. Despite the strength of the 10-Year bond notes recently, speculator bets have continued to be more bearish than bullish (bearish bets have risen in five out of the last seven weeks with a net change of -115,063 contracts over that period).

Currently, the overall bearish position is back above the -400,000 net contract level which marks just the third time bets have been this bearish since November 2018.

10-Year Note Commercial Positions:

The commercial traders position, hedgers or traders engaged in buying and selling for business purposes, totaled a net position of 340,399 contracts on the week. This was a weekly advance of 29,275 contracts from the total net of 311,124 contracts reported the previous week.

10-Year Note Futures:

Over the same weekly reporting time-frame, from Tuesday to Tuesday, the 10-Year Note Futures (Front Month) closed at approximately $127.50 which was a rise of $0.70 from the previous close of $126.80, according to unofficial market data.

*COT Report: The COT data, released weekly to the public each Friday, is updated through the most recent Tuesday (data is 3 days old) and shows a quick view of how large speculators or non-commercials (for-profit traders) as well as the commercial traders (hedgers & traders for business purposes) were positioned in the futures markets.

The CFTC categorizes trader positions according to commercial hedgers (traders who use futures contracts for hedging as part of the business), non-commercials (large traders who speculate to realize trading profits) and nonreportable traders (usually small traders/speculators).

Find CFTC criteria here: (http://www.cftc.gov/MarketReports/CommitmentsofTraders/ExplanatoryNotes/index.htm).

Article By CountingPips.comReceive our weekly COT Reports by Email

Gold Speculators continued to push their bullish bets higher this week

June 22nd – By CountingPips.comReceive our weekly COT Reports by Email

Gold Non-Commercial Speculator Positions:

Large precious metals speculators once again boosted their bullish net positions in the Gold futures markets this week, according to the latest Commitment of Traders (COT) data released by the Commodity Futures Trading Commission (CFTC) on Friday.

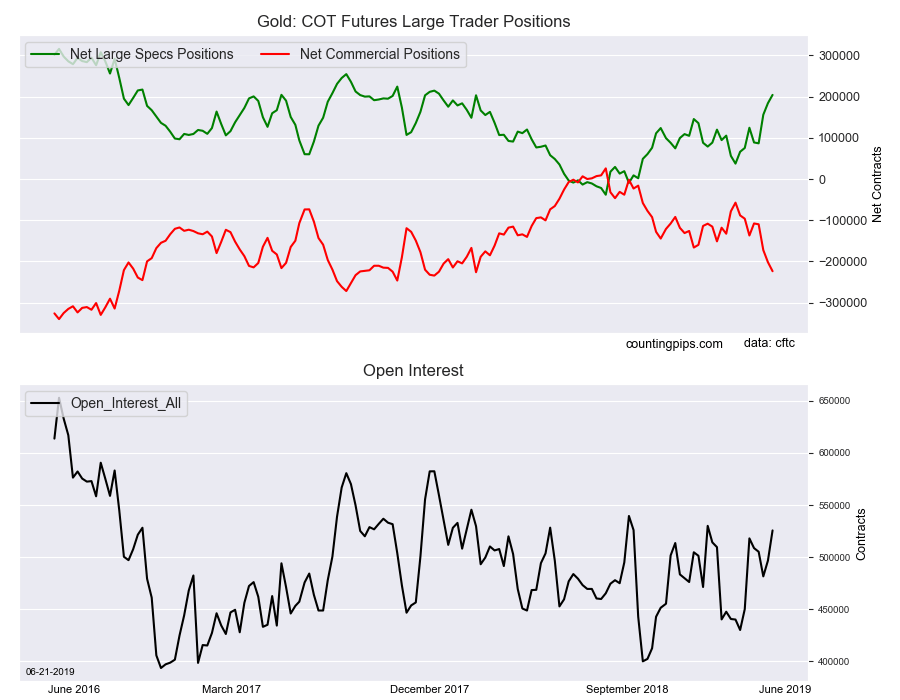
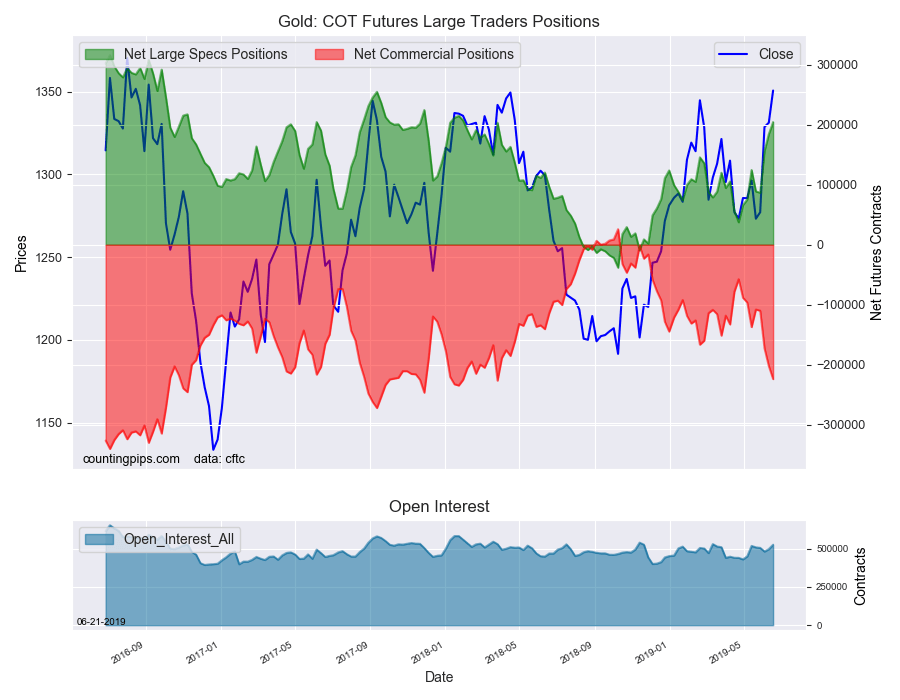
The non-commercial futures contracts of Gold futures, traded by large speculators and hedge funds, totaled a net position of 204,323 contracts in the data reported through Tuesday June 18th. This was a weekly rise of 20,085 net contracts from the previous week which had a total of 184,238 net contracts.

The week’s net position was the result of the gross bullish position (longs) growing by 24,519 contracts (to a weekly total of 274,633 contracts) while the gross bearish position (shorts) increased by 4,434 contracts for the week (to a total of 70,310 contracts).

The large speculator position has surged higher for a third straight week and by a total of 117,635 contracts over just that period. The gold speculative position was recently as low as +37,395 contracts on April 23rd before sentiment turned and has taken off. A record weekly rise on June 4th has helped push bullish bets sharply higher and the current speculator standing now sits at the best level since January 30th of 2018.

Gold Commercial Positions:

The commercial traders position, hedgers or traders engaged in buying and selling for business purposes, totaled a net position of -223,855 contracts on the week. This was a weekly drop of -21,828 contracts from the total net of -202,027 contracts reported the previous week.

Gold Futures:

Over the same weekly reporting time-frame, from Tuesday to Tuesday, the Gold Futures (Front Month) closed at approximately $1350.70 which was a rise of $19.50 from the previous close of $1331.20, according to unofficial market data.

*COT Report: The COT data, released weekly to the public each Friday, is updated through the most recent Tuesday (data is 3 days old) and shows a quick view of how large speculators or non-commercials (for-profit traders) as well as the commercial traders (hedgers & traders for business purposes) were positioned in the futures markets.

The CFTC categorizes trader positions according to commercial hedgers (traders who use futures contracts for hedging as part of the business), non-commercials (large traders who speculate to realize trading profits) and nonreportable traders (usually small traders/speculators).

Find CFTC criteria here: (http://www.cftc.gov/MarketReports/CommitmentsofTraders/ExplanatoryNotes/index.htm).

Article By CountingPips.comReceive our weekly COT Reports by Email