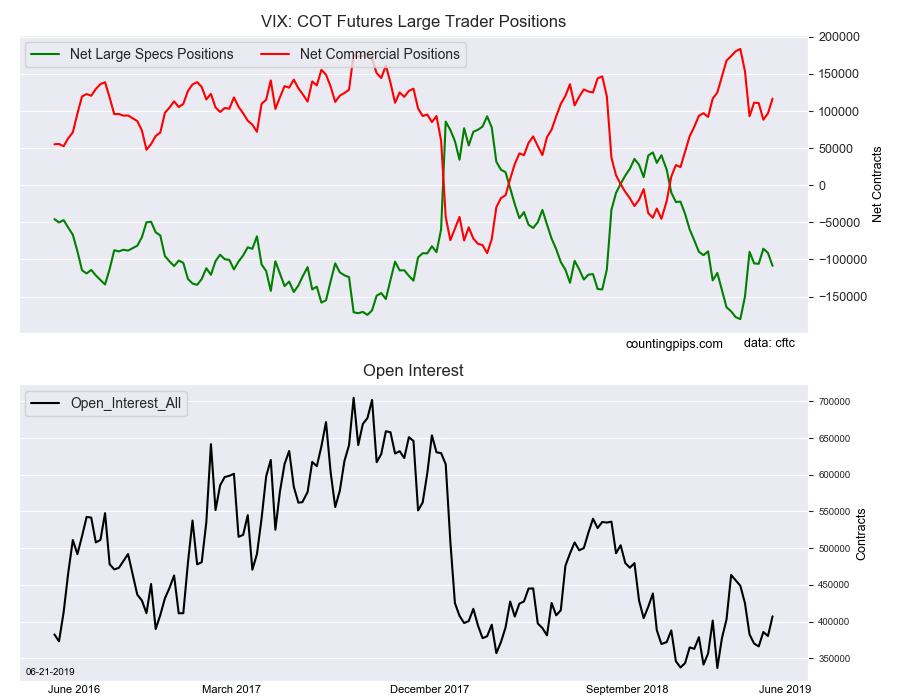
Large volatility speculators added to their bearish net positions in the VIX futures markets for a second straight week this week, according to the latest Commitment of Traders (COT) data released by the Commodity Futures Trading Commission (CFTC) on Friday.
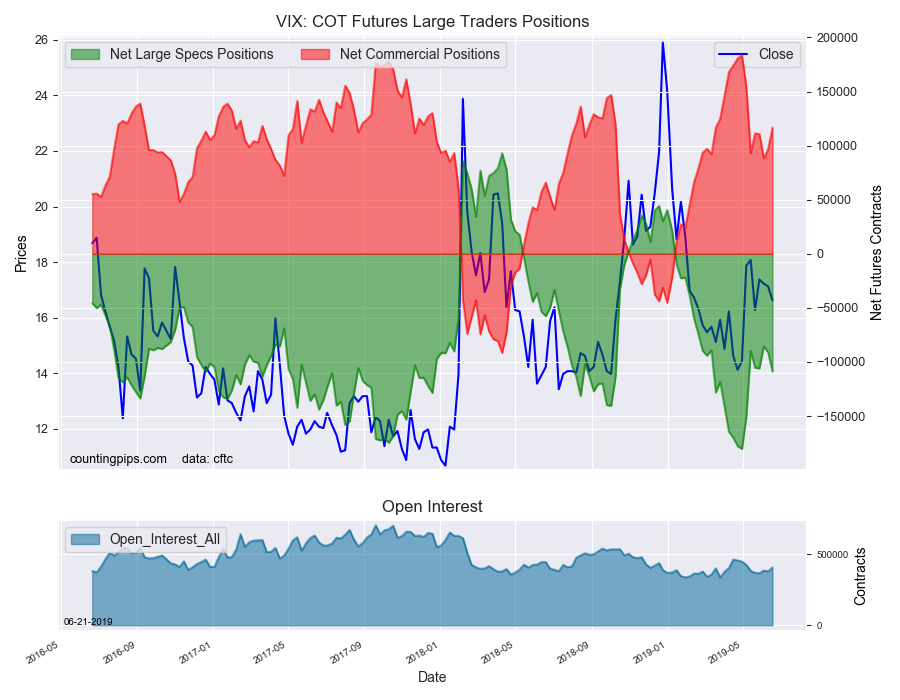
The non-commercial futures contracts of VIX futures, traded by large speculators and hedge funds, totaled a net position of -108,644 contracts in the data reported through Tuesday June 18th. This was a weekly change of -17,462 net contracts from the previous week which had a total of -91,182 net contracts.
The week’s net position was the result of the gross bullish position (longs) tumbling by -3,825 contracts (to a weekly total of 80,566 contracts) while the gross bearish position (shorts) gained by 13,637 contracts for the week (to a total of 189,210 contracts).
The large speculator position had recently risen to a record high bearish position of -180,359 contracts on April 30th. However, this was followed up by a sharp retreat of positions in the next few weeks. Since the middle of May, the speculators have started rebuilding their short positions with higher bearish bets in four out of the past five weeks.
This week continues in that trend and the overall short position is now at the highest bearish level since May 7th. The spec short position also rose over the -100,000 contract level for the first time in three weeks.
VIX Commercial Positions:
The commercial traders position, hedgers or traders engaged in buying and selling for business purposes, totaled a net position of 116,769 contracts on the week. This was a weekly gain of 19,849 contracts from the total net of 96,920 contracts reported the previous week.
VIX Futures:
Over the same weekly reporting time-frame, from Tuesday to Tuesday, the VIX Futures (Front Month) closed at approximately $16.62 which was a loss of $-0.50 from the previous close of $17.12, according to unofficial market data.
*COT Report: The COT data, released weekly to the public each Friday, is updated through the most recent Tuesday (data is 3 days old) and shows a quick view of how large speculators or non-commercials (for-profit traders) as well as the commercial traders (hedgers & traders for business purposes) were positioned in the futures markets.
The CFTC categorizes trader positions according to commercial hedgers (traders who use futures contracts for hedging as part of the business), non-commercials (large traders who speculate to realize trading profits) and nonreportable traders (usually small traders/speculators).
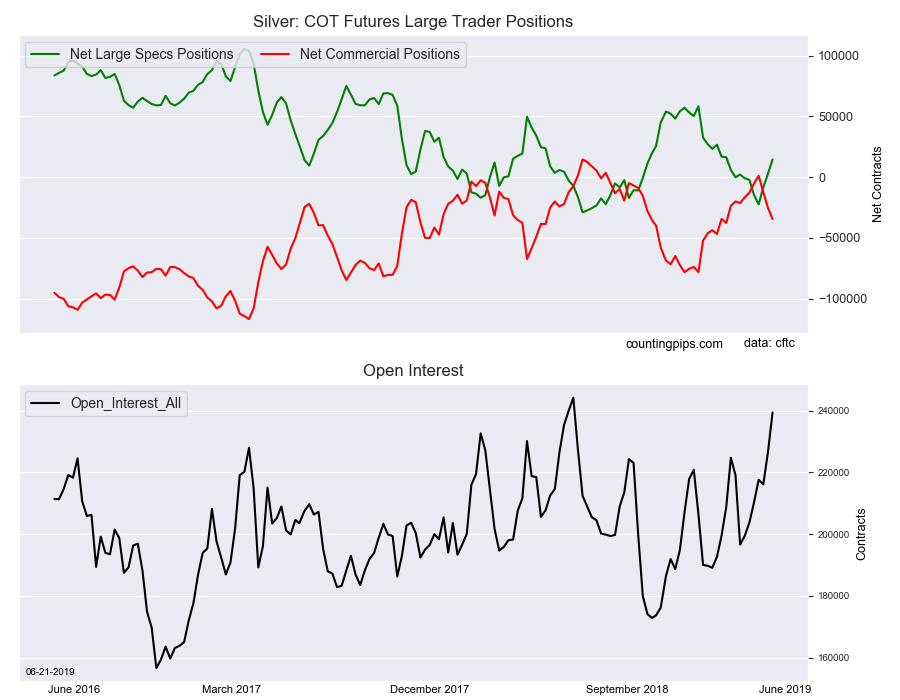
Large precious metals speculators raised their bullish net positions in the Silver futures markets this week, according to the latest Commitment of Traders (COT) data released by the Commodity Futures Trading Commission (CFTC) on Friday.
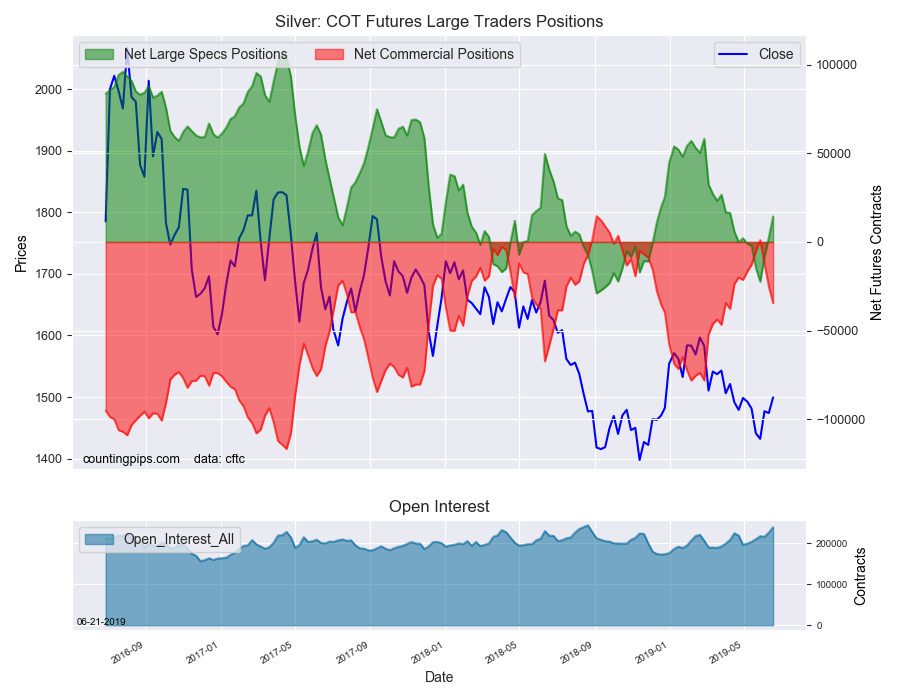
The non-commercial futures contracts of Silver futures, traded by large speculators and hedge funds, totaled a net position of 14,516 contracts in the data reported through Tuesday June 18th. This was a weekly gain of 11,856 net contracts from the previous week which had a total of 2,660 net contracts.
The week’s net position was the result of the gross bullish position (longs) rising by 8,050 contracts (to a weekly total of 93,275 contracts) while the gross bearish position (shorts) dropped by -3,806 contracts for the week (to a total of 78,759 contracts).
This week marked the third straight week of gaining bullish positions and has pulled the overall net position level from -8,443 contracts on June 4th to a bullish level of 14,516 contracts this week.
Previously, the large speculator position had deteriorated from a strong bullish level in February (a peak of +58,313 contracts on Feb. 26th). Bullish bets declined throughout April and dropped into an overall short position on May 7th. The sentiment continued lower throughout May and culminated at a low of -22,409 contracts on May 28th.
Silver Commercial Positions:
The commercial traders position, hedgers or traders engaged in buying and selling for business purposes, totaled a net position of -34,487 contracts on the week. This was a weekly drop of -9,296 contracts from the total net of -25,191 contracts reported the previous week.
Silver Futures:
Over the same weekly reporting time-frame, from Tuesday to Tuesday, the Silver Futures (Front Month) closed at approximately $1499.30 which was a rise of $25.30 from the previous close of $1474.00, according to unofficial market data.
*COT Report: The COT data, released weekly to the public each Friday, is updated through the most recent Tuesday (data is 3 days old) and shows a quick view of how large speculators or non-commercials (for-profit traders) as well as the commercial traders (hedgers & traders for business purposes) were positioned in the futures markets.
The CFTC categorizes trader positions according to commercial hedgers (traders who use futures contracts for hedging as part of the business), non-commercials (large traders who speculate to realize trading profits) and nonreportable traders (usually small traders/speculators).
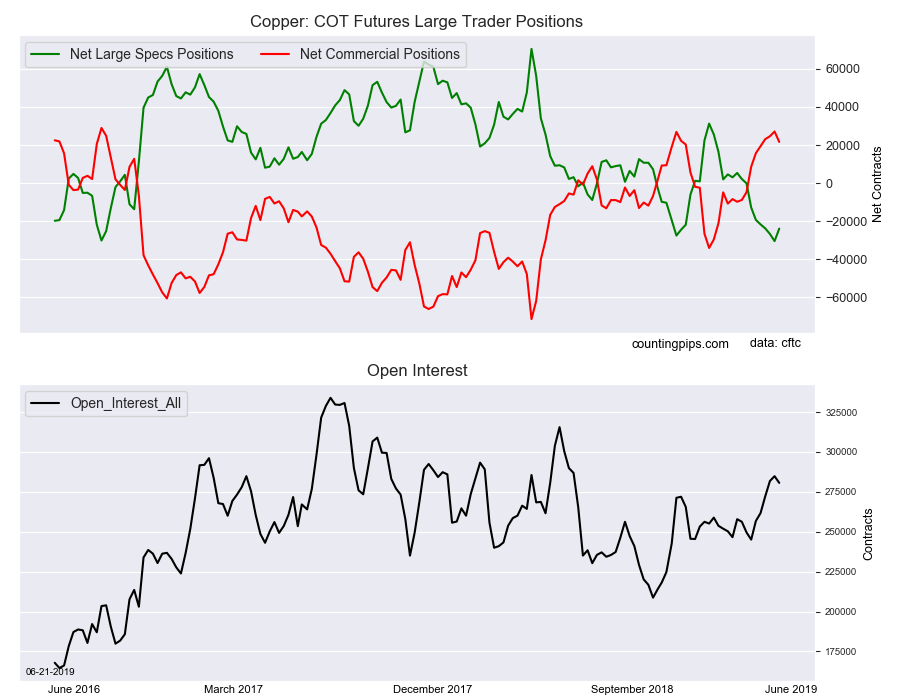
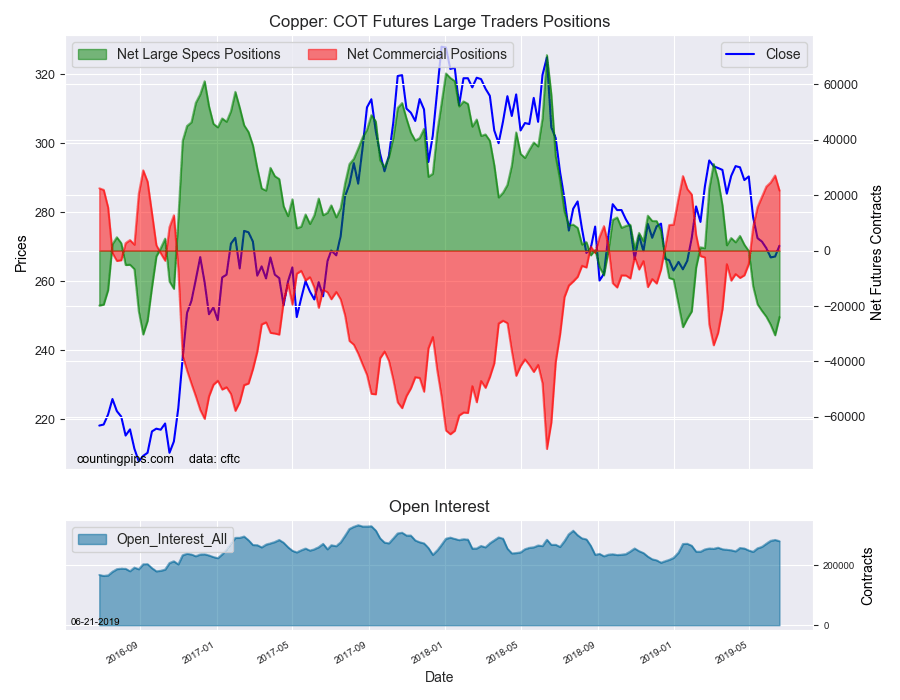
Large precious metals speculators cut back on their bearish net positions in the Copper futures markets this week after a streak of rising bearish bets, according to the latest Commitment of Traders (COT) data released by the Commodity Futures Trading Commission (CFTC) on Friday.
The non-commercial futures contracts of Copper futures, traded by large speculators and hedge funds, totaled a net position of -23,952 contracts in the data reported through Tuesday June 18th. This was a weekly change of 6,569 net contracts from the previous week which had a total of -30,521 net contracts.
The week’s net position was the result of the gross bullish position (longs) rising by 2,856 contracts (to a weekly total of 82,255 contracts) while the gross bearish position (shorts) fell by -3,713 contracts for the week (to a total of 106,207 contracts).
The large speculators had been boosting their bearish bets for eight straight weeks (by a total of -35,833 contracts) and to the most bearish standing of the last 155 weeks before this week’s turnaround. Overall, the Copper spec position has now been in a bearish level for eight weeks and above the -20,000 contract threshold for five consecutive weeks.
Copper Commercial Positions:
The commercial traders position, hedgers or traders engaged in buying and selling for business purposes, totaled a net position of 21,641 contracts on the week. This was a weekly loss of -5,465 contracts from the total net of 27,106 contracts reported the previous week.
Copper Futures:
Over the same weekly reporting time-frame, from Tuesday to Tuesday, the Copper Futures (Front Month) closed at approximately $270.30 which was a gain of $3.15 from the previous close of $267.15, according to unofficial market data.
*COT Report: The COT data, released weekly to the public each Friday, is updated through the most recent Tuesday (data is 3 days old) and shows a quick view of how large speculators or non-commercials (for-profit traders) as well as the commercial traders (hedgers & traders for business purposes) were positioned in the futures markets.
The CFTC categorizes trader positions according to commercial hedgers (traders who use futures contracts for hedging as part of the business), non-commercials (large traders who speculate to realize trading profits) and nonreportable traders (usually small traders/speculators).
Welcome to this week’s Market Wrap Podcast, I’m Mike Gleason.
Coming up Marc Faber, Dr. Doom, joins me for a must-hear discussion on debt, the global economy and the future of the dollar. Marc tells us how much he believes the average investor should have in gold and silver right now and reveals which precious metal he favors most going forward. So don’t miss a tremendous interview with Marc Faber, coming up after this week’s market update.
Well, what a week – big developments to report in politics, geopolitics, monetary policy, stocks, crude oil, and precious metals.
Let’s start with the gold market. On Thursday, gold prices surged $30, breaking through some major resistance levels and closing at a five-year high. The money metal ended up at $1,390 an ounce, just shy of the psychologically significant $1,400 level. It did cross over that during the Asian trading session last night and as of this Friday recording is back below it now to trade at $1,396 per ounce and is registering an impressive 4.0% gain this week.
Silver shows a weekly gain of 2.6% to bring spot prices to $15.32 an ounce. Silver has been following the lead of gold and has yet to show any real leadership of its own so far during this precious metals rally. Silver prices remain historically depressed versus gold, but that could change quickly.
Gold and silver mining equities have shown powerful relative strength over the past month, suggesting investors are anticipating follow through from the prices of the underlying metals. If you missed gold’s move to new multi-year highs, you’re not too late to catch a possible breakout move in silver – which has yet to even make a new 2019 high, let alone take out highs from previous years.
A catalyst for further gains in metals could be rate cuts from the Federal Reserve. On Wednesday, the Fed announced it would leave rates unchanged for now. That came as a disappointment to doves, but policymakers added language suggesting they are moving closer to acting.
Investors took the central bank’s statement to mean a rate cut in July is on the table, and probably another one after that. The S&P 500 responded by notching a new record high on Thursday.
The stock market stole gold’s limelight, and another leg higher for the aging bull market in stocks would likely diminish the safe haven appeal of precious metals. However, there is no rule that says stocks and metals can’t rise in tandem – especially if they share a common driver in monetary inflation.
Right now, stocks, bonds, and gold are all on bullish footing. Crude oil and other commodities are also threatening to trend higher, which would bring inflationary side effects to the economy.
Another apparent attack this week by Iran– this time on a U.S. drone – helped boost oil prices on fears of a larger conflict. A war with Iran and a blockade of oil tankers in the Persian Gulf could easily send oil prices spiking up into the triple digits.
In such a scenario, investors who hold economically sensitive stocks and low-yielding bonds would be in a vulnerable position.
Some of President Donald Trump’s top advisors clearly want war with Iran, but the President himself seems more interested in domestic issues like immigration and the economy. He formally launched his re-election campaign this week in the crucial battleground state of Florida.
Some national polls show Trump losing to Democrat frontrunner Joe Biden. But we would suggest these early polls don’t mean much.
To begin with, Biden will have a tough time securing his party’s nomination. He’s running on a center-left track record obtained during a different era in Democrat politics. He’s running against several hard left candidates who, combined, are more popular with today’s Democrat voters than he is.
The base of the party now essentially embraces socialism. Radical leftists who vote in primaries will insist that candidates commit to a long list of pie in the sky promises such as socialized medicine, slavery reparations, a Green New Deal, free college tuition, free abortions, and free everything for illegal aliens.
If the former Vice President wins the DNC nomination by going hard left on all these issues, he could make Trump look like the sensible moderate in the general election.
The Vice Presidency is often seen as a stepping stone to the Presidency. But that hasn’t been the case in recent years.
Joe Biden passed on the opportunity in 2016, claiming personal reasons. We can only imagine the pressure that was put on him privately by Hillary Clinton and her backers at the DNC to stay out of the race.
The previous Vice President, Dick Cheney, also declined to run.
Former Vice President Al Gore captured his party’s nomination but failed to win the general election in 2000. That same year Dan Quayle, Vice President to George H.W. Bush, ran unsuccessfully for the GOP nomination that was claimed by Bush junior.
Back in 1984, Jimmy Carter’s Vice President Walter Mondale got crushed in a landslide by Ronald Reagan.
When Richard Nixon resigned from office in 1974, VP Gerald Ford assumed the presidency but failed in 1976 to get elected to the nation’s highest office.
Since 1974, only one former Vice President has gone on to win a Presidential election. That was George H.W. Bush in 1988. Voters threw him out after just one term.
Fast forward to 2019. After running unsuccessfully for President more than three decades ago, then playing second fiddle to Barack Obama for eight years, then deferring to Hillary Clinton, it would be awkward for Joe Biden to try to explain why his time is now.
President Trump’s re-election prospects are probably better than the polls now suggest. If the GOP does keep the White House in 2020, would that be good news for stock market bulls and bad news for gold bugs? Not necessarily.
The last time a Republican was up for re-election was 2004. Incumbent President George W. Bush faced off against Democrat challenger John Kerry.
Gold and silver markets performed well in the second half of 2003 and made modest gains in 2004. The metals were in the early stages of a major bull market.
When George W. Bush won re-election in November 2004, gold was trading at a mere $450. Gold went on to hit a record $1,000 per ounce in early 2008. Over that same period, silver advanced from under $8 to over $20 an ounce. Precious metals vastly outperformed the stock market through the four years of W’s second term.
In the years ahead, forces now in motion should continue to exert upside pressure on gold and silver regardless of election outcomes. Steadily rising government debt and inflationary monetary policy are inevitable thanks to the political priorities of both Republicans and Democrats.
Well now, without further delay, let’s get right to this week’s exclusive interview.
Mike Gleason: It is my privilege now to be joined by a man who needs little introduction, Marc Faber, editor and publisher of the Gloom, Boom and Doom Report. Dr. Faber has been a long-time guest on financial shows throughout the world and is a well-known Austrian school economist and investment advisor, and it’s a tremendous honor to have him back on with us today.
Dr. Faber, thank you so much for joining us again, and how are you?
Dr. Marc Faber: Fine, and that it’s a pleasure for me to participate in this interview.
Mike Gleason: Well Marc, we’ll start out today with everyone’s favorite topic, that being Fed policy and what’s happening there because it continues to be such a key driver for everything, much to our dismay. The markets have been so addicted to Fed stimulus and cheat money since the Great Recession a decade ago, so is it possible that they can withdraw this stimulus? Or did we just learn over the last few months… going back to, say, November and December when we saw the equity market suffer dramatically over the idea of the Fed moving forward with those three to four planned rate hikes for 2019, after which the Fed has reversed course and completely backed off on any rate hikes this year… are we just looking at never-ending stimulus from the central banks now, Marc? What are you thinking as you’ve watched the events unfold over the last few months with respect to monetary policy and this apparent sea change?
Dr. Marc Faber: Well, it’s a complex issue. It’s particularly complex at the present time because the global central banks, I mean the major central banks, they can argue, well, there is little inflation in the system, and so we can continue to print money or to purchase assets, which, either way, is true. There is little consumer price inflation, partly because the economy of ordinary people is not particularly good. We have a split economy. The economy of the well-to-do or extremely well-to-do people is doing well, and the economy of the ordinary people in Europe, in Japan, in the U.S., is not doing well. And so there is little inflationary pressure, but there is a lot of inflation, or has been a lot of inflation in asset prices. Stocks are at highs in the U.S. essentially, not the oil industries but several industries. And we have now 10 trillion-dollar worth’s of bonds in the world that have negative interest rates, it’s in some kind of a bubble, or a big bubble.
And so we have this asset inflation, and in my view, the central banks and the policy makers, they realize that if the asset bubble really breaks, if the stock market drops 20%, if home prices drop 20%, if bond prices go down 20% or so, the whole world is in a depression. So, I think that when they started actually in 2008, with QE1 in December 2008, and I was asked at the time, “How do you think it will end?” I said, “They just started QE unlimited. I think they will continue to print money until the system breaks.” And that can take another few years.
But I think, yeah, it’s likely, if you were to look at the political landscape, you have on the one end the Republicans, at the present time under the leadership of Mr. Trump. He wants to spend on defense and on his wall and on all kinds of things. And the Democrats, they also want to spend on all kinds of things. So, you can be sure that the deficit in the U.S. will remain around a trillion dollars a year for the foreseeable future. And in my view it’s more likely that this deficit will go up, and possibly quite substantially. So, the money printing, in my view, will continue.
Now could you have QE, and at the same time the Fed raising interest rates? That is a possibility. But in the current environment, where the economy has been slowing down, I think they will rather do nothing, especially also under the pressure from the White House, which essentially accuses, or tells the world that if the Fed hadn’t raised interest rates, the stock market would be much higher. So, I think they will not increase rates further. I think they will not cut the rates, as Trump and Kudlow would suggest, to simply show them that they’re independent, and that they don’t need Mr. Trump and Mr. Kudlow to tell them what to do.
Mike Gleason: Despite what the Fed has been doing, we are still seeing a strong dollar because the Fed has been a bit more hawkish than the ECB and the BOJ – the Bank of Japan – and other major central banks throughout the world. Do you see this reversing at some point? We know Trump doesn’t want a strong dollar, so how do you see things playing out in the currency markets? Because for the most part, gold, if we relate it to gold, is going to trade off the U.S. dollar in many respects. As long we see strength in the dollar, it’s likely going to be difficult for gold to really catch fire. Give us your comments on the dollar and what you see ahead for the greenback.
Dr. Marc Faber: Well, I think the dollar is strong because many investors argue that the economy in the U.S. is either better conditioned than European economies. Who knows? But one reason the dollar has been strong is you have all these negative interest rates in Europe. In Germany the 10-year yield is now negative, and in Japan as well, in Switzerland as well. And in Spain you have interest rates on the 10-year government bonds of 1%, whereas in the U.S. it’s 2.58%. So, I could argue it’s logical that if you get more than twice as much interest in U.S. Treasuries than in Spanish bonds, and you’re an insurance company in Europe, or sovereign fund in the world, you rather buy U.S. Treasuries than Spanish bonds. I think it’s quite logical. So, I think that has supported the dollar.
But I personally, I think the dollar should in due course weaken, and as the dollar weakens it could also trigger weakness in the stock market.
Mike Gleason: As usual, when you’re a guest on our podcast, we like to get your take on what’s happening globally. In particular, we are interested in what you expect from Asia. There seems to always be talk in the U.S. media about China slowing down. Perhaps the tariffs are having an impact. However, the U.S. trade deficit doesn’t appear to be budging very much. What are you expecting with regards to the possibility of recession in China? And where do you see the global economy headed in the near term?
Dr. Marc Faber: Well as you know, the Chinese had all this excessive credit growth. Now you could argue, well, they have this excessive credit growth because they have also a very high propensity, or rate of capital spending to build apartment buildings and bridges and roads, and the whole infrastructure. This is very costly. And so the borrowings are very high. But whether China will go into recession or not is a question also, can in China some sectors be in a recession, like car sales are down this year, and other sectors continue to expand? It’s a huge country. It’s actually almost a continent with 1.3 billion people. So, different sectors will perform differently. But since I live in Asia, my observation is that there has been a slowdown in economic activity. We’re not in a recession, but we’re in a very low-growth phase. There’s very little growth at the present time, and if there is growth it is because of borrowings… but that is also the case in the U.S. Without a trillion-dollar deficit and the debt build-up, student loans and car loans and everything, and credit card loans, the U.S. economy wouldn’t be growing either.
Mike Gleason: We saw back in, I believe it was late summer 2015 when the Chinese economy really hit the skids there temporarily, and it almost started a massive global panic there in the equities markets. Is China still a key linchpin when it comes to how they’re doing, so goes the world to some respect? And do you see maybe some doom coming down the road for China that could find itself manifesting in other economies and other markets?
Dr. Marc Faber: Well, China consumes approximately 50% of all industrial commodities in the world. So if there is a recession in the manufacturing sector in China, yeah, of course the world feels it. Or if there is less demand for smart phones in China, and also, I have to mention here that India has also become a large market. So, if there’s less demand for these toys, or for these very sophisticated mobile phones, then obviously the world feels it because it affects Taiwan and South Korea. And in turn it affects American semiconductor companies and so forth and so on. So, it goes through like a bush fire. And if China travels less, if there are less international travelers, then you’re talking about 140 million Chinese, and if they drop by 10%, then it’s 14 million Chinese that will no longer travel. And that, every market will feel. So they have a huge impact on the global economy undoubtedly.
Mike Gleason: Marc, how about this move towards socialism that we’re seeing, whether we’re talking about monetary policy or when we look at the landscape of the Democrat presidential candidates who will challenge Trump in next year’s election here in the U.S., what do you make of this movement that does seem to be gaining steam in many respects throughout the world? And how might this impact financial markets and investment opportunities in your view?
Dr. Marc Faber: Well, I just wrote an essay about monetary inflation and the social impact of monetary inflation, because depending how the monetary inflation works through the system… in the case of hyperinflation, Germany in 1922, 1923, the middle class was essentially eliminated. They lost basically most of their savings one way or another. But the rich people made a lot of money. And I’m comparing it to the current time, where the middle class hasn’t lost money per se, but because the rich people became so rich, the middle class has kind of been pushed down relative to the super rich people. That creates then an unfriendly environment.
The people that vote, they don’t understand a lot. But it’s very easy for a politician to go to people and say, “You know why you’re not doing well? It’s because of Jeff Bezos, he’s got so much money, and because of Warren Buffet, he’s got so much money, and Bill Gates, and so forth. And because of these hedge fund managers, they don’t pay any tax or they don’t pay much tax,” which is actually true. The corporate world in America pays very little tax compared to individuals. If you look at the composition of tax revenues by the government, the bulk is paid by individuals, not by the corporate sector.
And so, through destroying wealth and income inequalities, the mood is in favor of taking money away from the wealthy people and distributing money to the ordinary people. And then they see, the ordinary people, how much is being spent on defense, in the case of the U.S., close to 750 billion dollars a year. And a lot of it is not accounted for. And they say, “Well, this money shouldn’t be spent on defense. It should be spent on social programs,” and so forth and so on. So the mood, towards socialism, especially we have surveys that showed the millennials, about 60% of the millennials, they are in favor of more government interventions.
Mike Gleason: Yeah, definitely something we’ll be keeping an eye on here over the next year or so, especially as we get close to the election season, we’ll see what happens there.
Well Marc, as we begin to wrap up here, give us some more of your thoughts on the precious metals. For instance, do you see better value in one of the PMs over the others perhaps? And given everything that we’ve been talking about here today, with all of the debt in the system and the potential of never-ending stimulus and perpetual money printing, do you envision it being a strong environment for the metals moving forward? And basically, how do you see the sector performing overall, say this year and next? And then what will it take for them to sustain a rally to the upside finally?
Dr. Marc Faber: Well, the one thing I want to say, that everybody who lived through the monetary inflation of Germany – which ended up in kind of a hyperinflation, but I just want to explain – in the case of Germany, the hyperinflation was also made possible because the other countries didn’t inflate. And so the mark depreciated against the foreign currencies, which then added to inflationary pressures. In the present state of monetary policy around the world, because everybody prints money, currencies don’t collapse against each other, with very few exceptions like the Turkish lira and the Argentine peso and so forth. But basically, the major currencies, they trade against each other.
So where will the collapse of the currencies come from? In my opinion, they’ll all collapse against precious metals. And it is conceivable, and this is something we just don’t know, it is conceivable that they’ll also collapse against some cryptocurrencies. Now, I think there is a chance, we’re not sure – this is a kind of a theory – it is conceivable that Bitcoin becomes the standard, the gold standard of cryptos. But I’m not sure.
All I want to say, investors, in an environment such as we have of money printing, they need to diversify. They need to own some equities. We don’t know whether these monetary inflations will end up with a deflationary bust, in which case you may want to own some U.S. Treasuries, or it could lead to high inflation, consumer price inflation, in which case you want to own maybe a farm or some properties overseas. Or you may wish to own some precious metals. I think in any scenario, you should own some precious metals. Or the question is, should you own 3% of your money in precious metals or 90%? That everybody has to decide for himself. I recommend about 20, 25% of your assets in precious metals.
And as to the question, which one is (likely to perform) best? I think platinum is the cheapest at the present time of the precious metals. And I think it has actually a favorable outlook. I think there will be a supply shortage, and that the price could significantly outperform gold and silver.
Mike Gleason: Yeah, we agree. Lots of geopolitical dynamics involved in platinum there, and that’s going to be an interesting market to follow.
Dr. Marc Faber: Yes, exactly.
Mike Gleason: Well, Dr. Faber, thanks so much for your time and for staying up late with us there in Thailand. It was certainly real joy to have you back on and get your insights on the state of things. And before we let you go, please tell folks how they can subscribe to the Gloom, Boom and Doom Report so they can get your great commentaries on a regular basis.
Dr. Marc Faber: Thank you. Well there’s a website, GloomBoomDoom.com. And there all the information it contained.
Mike Gleason: Again, it was a real privilege to speak with you, Dr. Faber. I hope we can do it again before too much longer. And have a great weekend. Thanks for joining us again.
Dr. Marc Faber: Yes, you too. Bye-bye. Thank you.
Mike Gleason: Well that will do it for this week. Thanks again to Dr. Marc Faber, editor and publisher of the Gloom, Boom and Doom Report. Again, the website is GloomBoomDoom.com. Be sure to check that out.
Mike Gleason: And don’t forget to check back here next Friday for our next Weekly Market Wrap Podcast. Until then, this has been Mike Gleason with Money Metals Exchange. Thanks for listening, and have a great weekend, everybody.
The Money Metals News Service provides market news and crisp commentary for investors following the precious metals markets.
Have been turning decidedly negative on USD of late, I stated at the start of the year that I expected the USD to moderate through 2019. However, as we all know currencies don’t do things in halves. Thus, a year of moderation will likely mean a period of strong declines coupled with period of strength.
We a clearly entering a period of declines for two reasons
First, market and economic fundamental reasoning. This being monetary policy shifts coupled with significantly weak US data falling US bond yields (the US 10-year yield fell below 2% for the first time in 3 years last week).
Last Wednesday the Federal Reserve for the first time since it’s GFC ‘response’ is now forecasting a rate cut rather than a hike.
It is only one by the end of 2020, but the market is forecasting 4 over the same period – this will begin to weigh on the USD and don’t be surprised to see the Fed downgrade its outlook further still as the year progresses.
However, it is more than just the Fed’s rates forecasting – it’s the fact the supply side of the US economy is slowing.
The Empire State manufacturing PMI fell at its most rapid pace on record for the month of June and recorded its lowest level since the trough of 2016.
The US home-builder survey decline for the first time this year. The decline was blamed on rising construction costs coupled with a shortage of construction workers and rising trade concerns.
This is a weakening outlook for the US and will force the Fed to act and will see the USD lower.
The second reason is geopolitical – The President is revitalising the term ‘Currency Wars’.
We have officially entered the race for the 2020 Presidential election. It is clear from the President’s re-election ‘speech’ coupled with a typical Twitter tirade basically accusing the ECB of currency manipulation that he is looking to bring the USD down in his next term.
Tweet 1: “Mario Draghi just announced more stimulus could come, which immediately dropped the Euro against the Dollar, making it unfairly easier for them to compete against the USA. They have been getting away with this for years, along with China and others,”
Tweet 2: “German DAX way up due to stimulus remarks from Mario Draghi. Very unfair to the United States!”
This has the potential to become quite problematic as the mechanisms at his disposal to physically pull the USD down are ‘limited’. But, trade threats, sanctions and even international litigation with the likes of the WTO are not out of realm of possibility for this President. Will be an interesting 18 months leading into November 2020.
When you combine these two factors – USD weakness is coming.
A BMO Capital Markets report gave the new figures for tons and grades and compared them to ones in a prior estimate.
In a June 17 research note, BMO Capital Markets analyst Edward Sterck reported that South32 Ltd. (S32:ASX; S32:LSE) published a mineral resource for its Taylor deposit in Arizona.
Sterck noted the new JORC compliant resource is generally similar to the NI 43-101 compliant one completed by Arizona Mining, the previous property owner, in January 2018, but with three differences, which he specified.
One is that the new resource encompasses more tons, 155 million tons (155 Mt) versus 145 Mt.
Secondly, grades in the new resource are lower across the board. When comparing South32 and Arizona Mining’s resources, grades, respectively, averaged 3.39% versus 4.1% zinc, 3.67% versus 4.4% lead and 69 grams per ton (69 g/t) versus 78 g/t silver.
Finally, the new resource reflects a 10% reduction in contained metal on a zinc equivalent basis when compared to Arizona Mining’s resource, despite the same cutoff grade of about 4%.
Sterck indicated that the prefeasibility study for Taylor is still expected before June 2020.
In other news, noted Sterck, South32 also released an updated resource estimate for its Illawarra met coal project. Resources there have dropped to 22 Mt from 114 Mt because the company “relinquished a portion of the license area.”
Disclosure: 1) Doresa Banning compiled this article for Streetwise Reports LLC and provides services to Streetwise Reports as an independent contractor. She or members of her household own securities of the following companies mentioned in the article: None. She or members of her household are paid by the following companies mentioned in this article: None. 2) The following companies mentioned in this article are billboard sponsors of Streetwise Reports: ?????. Click here for important disclosures about sponsor fees. 3) Comments and opinions expressed are those of the specific experts and not of Streetwise Reports or its officers. The information provided above is for informational purposes only and is not a recommendation to buy or sell any security. 4) The article does not constitute investment advice. Each reader is encouraged to consult with his or her individual financial professional and any action a reader takes as a result of information presented here is his or her own responsibility. By opening this page, each reader accepts and agrees to Streetwise Reports’ terms of use and full legal disclaimer. This article is not a solicitation for investment. Streetwise Reports does not render general or specific investment advice and the information on Streetwise Reports should not be considered a recommendation to buy or sell any security. Streetwise Reports does not endorse or recommend the business, products, services or securities of any company mentioned on Streetwise Reports. 5) From time to time, Streetwise Reports LLC and its directors, officers, employees or members of their families, as well as persons interviewed for articles and interviews on the site, may have a long or short position in securities mentioned. Directors, officers, employees or members of their immediate families are prohibited from making purchases and/or sales of those securities in the open market or otherwise from the time of the interview or the decision to write an article until three business days after the publication of the interview or article. The foregoing prohibition does not apply to articles that in substance only restate previously published company releases. As of the date of this interview, officers and/or employees of Streetwise Reports LLC (including members of their household) own securities of ?????, a company mentioned in this article.
Disclosures from BMO Capital Markets, South32, June 17, 2019
IMPORTANT DISCLOSURES
Analyst’s Certification I, Edward Sterck, hereby certify that the views expressed in this report accurately reflect our personal views about the subject securities or issuers. I also certify that no part of our compensation was, is, or will be, directly or indirectly, related to the specific recommendations or views expressed in this report.
Analysts who prepared this report are compensated based upon (among other factors) the overall profitability of BMO Capital Markets and their affiliates, which includes the overall profitability of investment banking services. Compensation for research is based on effectiveness in generating new ideas and in communication of ideas to clients, performance of recommendations, accuracy of earnings estimates, and service to clients.
Analysts employed by BMO Nesbitt Burns Inc. and/or BMO Capital Markets Limited are not registered as research analysts with FINRA. These analysts may not be associated persons of BMO Capital Markets Corp. and therefore may not be subject to the FINRA Rule 2241 restrictions on communications with a subject company, public appearances and trading securities held by a research analyst account.
Company Specific Disclosures Disclosure 9C: BMO Capital Markets makes a market in South32 in Europe.
For Important Disclosures on the stocks discussed in this report, please click here.
Sector expert Michael Ballanger offers his take on various factors affecting the stock and commodities markets prior to today’s Federal Open Market Committee meeting.
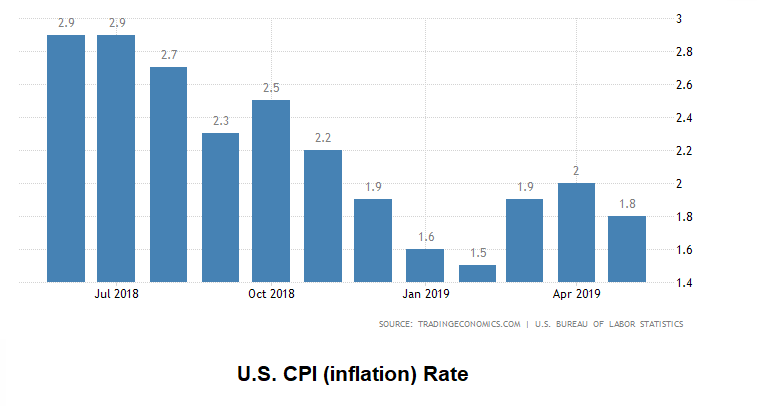
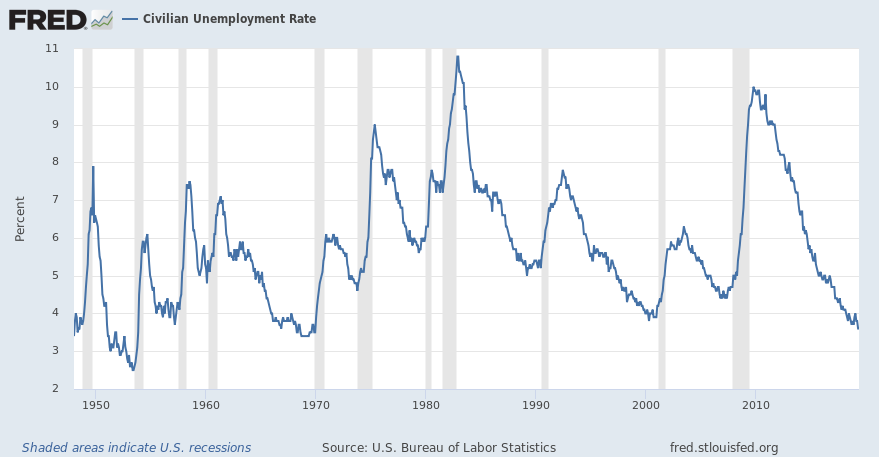
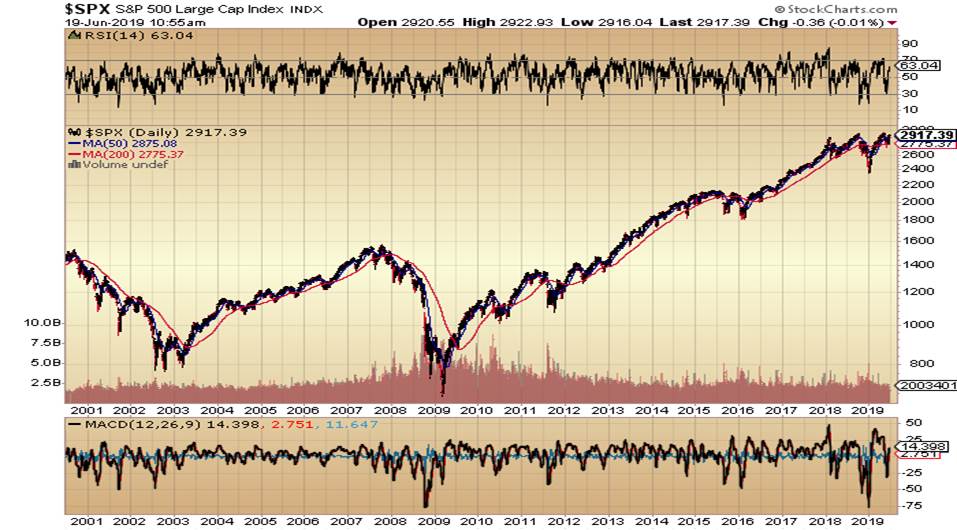
Question #1: With unemployment rates at 50-year lows, inflation below the Federal Reserve’s target, housing (bankers’ major collateral) at or near record highs, and stock markets within 2% of all-time highs, why in the Lord’s name is a rate cut even being contemplated?
Question #2: Can there be any doubt that the Federal Reserve Board is no longer “steward of the economy” but rather “Defender of the S&P”?
Many, many years ago, long before central bankers became rock stars, and during an era of true free market capitalism, to even imagine a Fed funds rate of 2.5% was to paint a backdrop of high unemployment, negative growth verging on depression, and sagging asset prices verging on deflation. A Fed funds rate of 6-8% was associated with vigilant inflation controls, strong growth and tight labor markets, where bond market vigilantes controlled long rates by their (as opposed to Fed or U.S. Treasury trading desks) selling or buying of treasuries.
This was the last period of non-interventionist monetary policy and it was a safer, kinder world within which investors could navigate their portfolio voyages with relatively reliable, simple indicators upon which to implement strategy. If one forecast accelerating growth and constrained supply, one bought gold and oil and waited for the reactions; if one predicted Fed tightening due to overheated labor markets, one sold bonds or shortened maturities while staying defensive in equity posturing. It was a dot-plotless, tweetless, FOMC-meeting-less, CNBC-less world, when the only financial show worth watching was Louis Rukeyser’s “Wall Street Week.”
I suspect that by the time this missive is delivered, the Federal Open Market Committee (FOMC) has either cut or left alone the Fed funds rate, sending stocks either higher or lower, but what is painfully obvious, at least to this self-effacing scribe, is that economic performance no longer propels stocks. All stock price movements are either event-driven or interference-driven, and that might also be said for both gold and silver.
Another idiosyncratic feature of all markets in the Year of Our Lord 2019 is that these FOMC circus shows are treated like Major League baseball final games, complete with interviews, guest appearances, and revisionist commentary with the only thing missing being the guy in the yellow frock selling beer and hot dogs. In the hours that lead up until 2:15 p.m. EST on FOMC day, stocks go into lockdown as the algobots are unable to focus on anything that doesn’t have the word “Fed” in it. You could have an outhouse explode in Times Square and stocks would barely budge. . .
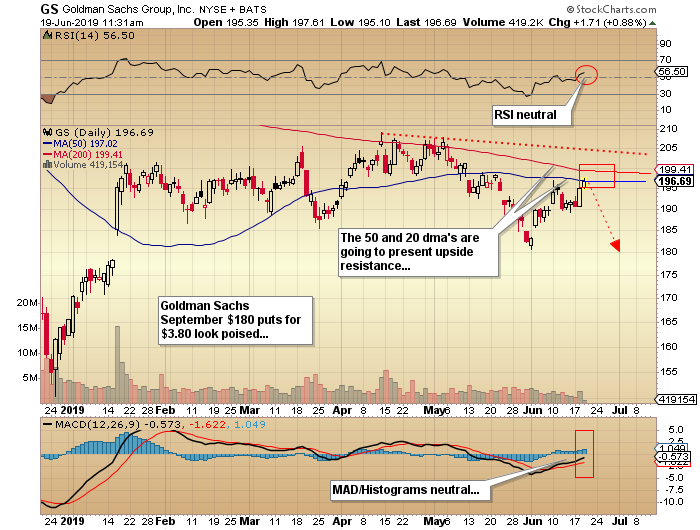
The following charts are illustrations of just how benign the U.S. economy has become. There are no emergencies, financial crises, or political boondoggles that would prompt anyone to action in the arena of fiscal stimulus or interventionist molding of “conditions.” Take a look at these four charts and ask yourselves whether a rate cut is warranted or whether a return to “quantitative easing” is required.
The answer: They are not required. However, since it is the fourth chart that governs Fed policy, a 100-point crash in the S&P would indeed prompt a call-to-arms by the Fed and you can bet that is what Trump will demand if there is any type of negative reaction after 2:15.
Nothing appears to be requiring attention here. . .
Nothing appears to be requiring attention here. . .
Lowest unemployment rate in 50 years?
Less than 2% from all-time highs!
The prior four charts show me there really is nothing urgent in the economic backdrop that requires stimulus other then the Fed trying to stay “ahead of the curve,” with the Trade War being the potential catalyst for a slowdown. It is evident from Mario Draghi’s actions at the European Central Bank and Haruhiko Kuroda’s at the Bank of Japan that total capitulation to the sanctity of stock markets was the primary driver for policy, and that will eventually be the driver for Jerome Powell and the Fed. However, the risks will be greatest just before the markets decide that the central bankers are now, and have always been, clueless in their stewardship of the global economy becauese when that occurs, there are no arrows remaining in the stock market quiver.
The “Squid” is ready to resume its downtrend. . .
Not only do I not know whether the Fed will cut or not this afternoon, I don’t particularly care. The trade, as I see it, is to fade the advance because it appears that a cut has now been reflected by yesterday’s 28-point surge in the S&P. If they cut, traders will “sell the news,” and if they don’t, yesterday’s jump will be reversed.
Ergo, the Goldman Sachs Sept. $180 puts for $3.80 appear to be ripe for accumulation. I have also put on a modest position in the SPY July $280 puts at $1.63 earlier. Remember that you should never go overboard, either bearish or bullish, going into the FOMC, and always keep a bunch of cash available in the event there are surprises.
Gold is this morning was trading down a tad and as I tweeted yesterday, despite egregiously overbought conditions for the metals and the miners with plus-70 relative strength indexes (RSIs) everywhere, prices are holding, which has to impress. The odds favor fading the metals and miners based upon the RSIs given that five prior times, big plunges followed.
Let the absurdity prevail. . .
Originally trained during the inflationary 1970s, Michael Ballanger is a graduate of Saint Louis University where he earned a Bachelor of Science in finance and a Bachelor of Art in marketing before completing post-graduate work at the Wharton School of Finance. With more than 30 years of experience as a junior mining and exploration specialist, as well as a solid background in corporate finance, Ballanger’s adherence to the concept of “Hard Assets” allows him to focus the practice on selecting opportunities in the global resource sector with emphasis on the precious metals exploration and development sector. Ballanger takes great pleasure in visiting mineral properties around the globe in the never-ending hunt for early-stage opportunities.
Disclosure: 1) Michael J. Ballanger: I, or members of my immediate household or family, own securities of the following companies mentioned in this article: Goldman Sachs. My company has a financial relationship with the following companies referred to in this article: None. I determined which companies would be included in this article based on my research and understanding of the sector. Additional disclosures are below. 2) The following companies mentioned in this article are billboard sponsors of Streetwise Reports: None. Click here for important disclosures about sponsor fees. 3) Statements and opinions expressed are the opinions of the author and not of Streetwise Reports or its officers. The author is wholly responsible for the validity of the statements. The author was not paid by Streetwise Reports for this article. Streetwise Reports was not paid by the author to publish or syndicate this article. Streetwise Reports requires contributing authors to disclose any shareholdings in, or economic relationships with, companies that they write about. Streetwise Reports relies upon the authors to accurately provide this information and Streetwise Reports has no means of verifying its accuracy. 4) This article does not constitute investment advice. Each reader is encouraged to consult with his or her individual financial professional and any action a reader takes as a result of information presented here is his or her own responsibility. By opening this page, each reader accepts and agrees to Streetwise Reports’ terms of use and full legal disclaimer. This article is not a solicitation for investment. Streetwise Reports does not render general or specific investment advice and the information on Streetwise Reports should not be considered a recommendation to buy or sell any security. Streetwise Reports does not endorse or recommend the business, products, services or securities of any company mentioned on Streetwise Reports. 5) From time to time, Streetwise Reports LLC and its directors, officers, employees or members of their families, as well as persons interviewed for articles and interviews on the site, may have a long or short position in securities mentioned. Directors, officers, employees or members of their immediate families are prohibited from making purchases and/or sales of those securities in the open market or otherwise from the time of the interview or the decision to write an article until three business days after the publication of the interview or article. The foregoing prohibition does not apply to articles that in substance only restate previously published company releases.
Charts courtesy of Michael Ballanger.
Michael Ballanger Disclaimer: This letter makes no guarantee or warranty on the accuracy or completeness of the data provided. Nothing contained herein is intended or shall be deemed to be investment advice, implied or otherwise. This letter represents my views and replicates trades that I am making but nothing more than that. Always consult your registered advisor to assist you with your investments. I accept no liability for any loss arising from the use of the data contained on this letter. Options and junior mining stocks contain a high level of risk that may result in the loss of part or all invested capital and therefore are suitable for experienced and professional investors and traders only. One should be familiar with the risks involved in junior mining and options trading and we recommend consulting a financial adviser if you feel you do not understand the risks involved.
Mongolia’s central bank left its policy rate steady at 11.0 percent, saying inflation is expected to remain around its target level amid heightened risks for the global economic outlook and the uncertain outlook for commodity prices. The Bank of Mongolia (BOM), which has kept its rate steady since raising it by 1 percentage point in November 2018 to bolster the exchange rate of the tughrik, said fiscal discipline, resiliency in the banking sector, and independence of the central bank is essential to weather the potential external risks and to sustain macroeconomic stability. In its statement from June 19, BOM’s monetary policy committee noted the deepening of the trade dispute between the U.S. and China, which is amplifying external risks, and said a potential deterioration in its terms of trade coincided with the completion of a large mining project and the maturing of large external debt, which makes it important to sustain the external balance and build financial buffers at all levels, including households, companies, local regions and communities. At an unscheduled policy meeting on Nov. 27, 2018 BOM raised its rate after the tughrik came under pressure in the second half of the year and ended 8.0 percent lower during the year in light of a growing external deficits from a relatively high fiscal deficit, rising U.S. interest rates and China’s decision to limit coal imports. But this year the tughrik has been more stable, with the tughrik today trading at 2,661 to the U.S. dollar, down just under 1 percent this year, as economic growth has improved and inflation stabilized. Mongolia’s inflation rate rose to 7.9 percent in May from 7.0 percent in April due to higher meat prices from a disruption in domestic supply and gasoline prices. But BOM demand-driven core inflation was stable. BOM’s inflation target is 8.0 percent. Rapid growth in mining, an expansion in corporate lending and increased investments and tight fiscal policy have helped boost Mongolia’s economy, with growth in the first quarter up 8.6 percent, the fifth consecutive quarter of accelerating annual growth, and the strongest expansion since the third quarter of 2014. BOM has forecast 2019 growth of at least 6.9 percent after growth of over 6 percent in 2018. In January the International Monetary Fund (IMF) said Mongolia’s growth remains strong and tight fiscal policy led to a surplus in 2018, adding authorities dampened excessive domestic demand that was limiting the build-up of international reserves and were ready to tighten further.
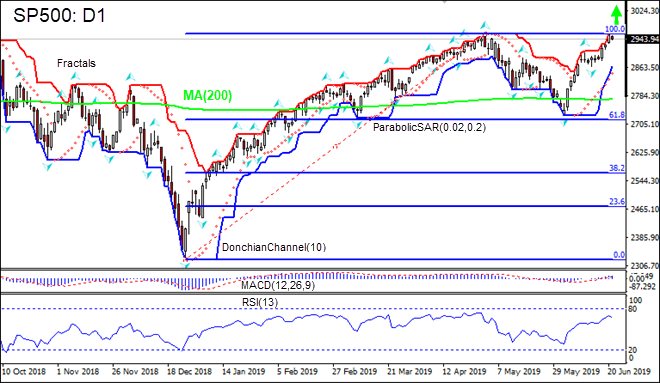
Federal Reserve indicated it would act to support expansion with data pointing to continued strength of US economy. Will the SP500 stock index continue advancing?
US monetary authority indicated a leaning toward easier policy at June 17-18 policy meeting. While the Federal Reserve left federal funds rates unchanged in 2.25%-2.5% range, chairman Powell said the central bank would “act as appropriate to sustain the expansion”. US economic data were positive on balance ahead of the Federal Reserve meeting: US retail sales grew 0.5% in May, industrial production rose 0.4% when 0.2% rise was expected, and utilization edged up 0.2 percentage point to 78.1%. And while housing starts declined 0.9% on month in May, building permits rose 0.3% after 0.2% increase in April. With the Federal Reserve vowing to take measures if expansion is jeopardized in case of prolonged US-China tariff standoff positive economic data are bullish for US equities market.
On the daily timeframe SP500: D1 is rising since failure to close below Fibonacci 61.8 level. It has returned above 200-day moving average MA(200). These are bullish developments.
The Donchian channel indicates uptrend: it is tilted up.
The MACD indicator is above the signal line and the gap is widening, which is a bullish signal.
The RSI oscillator is rising but has not reached the overbought zone.
We believe the bullish momentum will continue as the price breaches above the upper boundary of Donchian channel at 2959.22. This level can be used as an entry point for placing a pending order to buy. The stop loss can be placed below the lower Donchian boundary at 2866.47. After placing the order, the stop loss is to be moved every day to the next fractal low, following Parabolic signals. Thus, we are changing the expected profit/loss ratio to the breakeven point. If the price meets the stop loss level (2866.47) without reaching the order (2959.22), we recommend cancelling the order: the market has undergone internal changes which were not taken into account.
Sector expert Michael Ballanger reacts to today’s Federal Open Market Committee meeting.
To the surprise of the many and the chagrin of the few, the Fed opted to do nothing with policy today and left rates unchanged despite clarion calls for a cut. As I wrote about earlier, there was (and is) zero rationale for a rate cut, what with GDP humming along and the best employment numbers in fifty years (if you believe them). Stocks moved higher despite several attempts at profit-taking, but that was no surprise because the Fed wanted to make damn certain the response to the statement and the ensuing presser would be a positive outcome.
The victims were bond yields (lower) and the U.S. dollar (lower), but the S&P rose 8.71 (0.30%), while gold had at its highest close for 2019 at $1,364.45. The lower U.S. dollar contributed to the advance in the metals, but we are still caught in a resistance quagmire between $1,350 and $1,375, with the relative strength index (RSI) screaming “Overbought!” after an $80 advance.
I am modestly short (hedged) via the GLD puts and await a signal that all is well and good with the gold trade before giving the “all clear” sign. On five occasions dating back to August 2016 has RSI for the GLD hit 70+, and every single time we got a sharp decline immediately thereafter. Each one of those events saw a sharp increase in the Commercial aggregate short position, which advanced sharply into the rise and led to each of the crashes. In the past two weeks, the aggregate short position held by the bullion banks has exploded from under 80,000 to over 200,000, and that, if nothing else, calls for caution.
I also went back to our old friend Goldman Sachs and bought the Sept $180 puts for $3.70 in the morning, before the Fed decision was announced. It is noteworthy that the financials all sold off after 2:15, which was not the type of reaction I would have expected with rates remaining unchanged. Higher rates are bullish for banks, as their spreads are currently disastrous given the inversion of the yield curve. The “Squid” is right back to the zone where I got short back in May, and appears ready for another descent. We shall see. . .
Last point on gold: The singular greatest danger over the intermediate term is that there is no “breakout” on this run, and that it catches an entire generation of generalists long at the top. As gold investors, we need a breakout above $1,375 that decisively surpasses that band of resistance in increasing volume and momentum, such that resistance becomes support and the entire metals complex undergoes a structural lift in valuation and sponsorship.
I am currently hedging against that materializing but praying that it indeed happens, because the gold market since 2011 has been like eight years of root canal surgery without any sort of sedation or tranquilization (an experience that Melania Trump knows all too well). As I wrote about at $1,287 three weeks ago, we will have our day, and whether it is here in June or later on in 2019, it is coming.
Originally trained during the inflationary 1970s, Michael Ballanger is a graduate of Saint Louis University where he earned a Bachelor of Science in finance and a Bachelor of Art in marketing before completing post-graduate work at the Wharton School of Finance. With more than 30 years of experience as a junior mining and exploration specialist, as well as a solid background in corporate finance, Ballanger’s adherence to the concept of “Hard Assets” allows him to focus the practice on selecting opportunities in the global resource sector with emphasis on the precious metals exploration and development sector. Ballanger takes great pleasure in visiting mineral properties around the globe in the never-ending hunt for early-stage opportunities.
Disclosure: 1) Michael J. Ballanger: I, or members of my immediate household or family, own securities of the following companies mentioned in this article: Goldman Sachs. My company has a financial relationship with the following companies referred to in this article: None. I determined which companies would be included in this article based on my research and understanding of the sector. Additional disclosures are below. 2) The following companies mentioned in this article are billboard sponsors of Streetwise Reports: None. Click here for important disclosures about sponsor fees. 3) Statements and opinions expressed are the opinions of the author and not of Streetwise Reports or its officers. The author is wholly responsible for the validity of the statements. The author was not paid by Streetwise Reports for this article. Streetwise Reports was not paid by the author to publish or syndicate this article. Streetwise Reports requires contributing authors to disclose any shareholdings in, or economic relationships with, companies that they write about. Streetwise Reports relies upon the authors to accurately provide this information and Streetwise Reports has no means of verifying its accuracy. 4) This article does not constitute investment advice. Each reader is encouraged to consult with his or her individual financial professional and any action a reader takes as a result of information presented here is his or her own responsibility. By opening this page, each reader accepts and agrees to Streetwise Reports’ terms of use and full legal disclaimer. This article is not a solicitation for investment. Streetwise Reports does not render general or specific investment advice and the information on Streetwise Reports should not be considered a recommendation to buy or sell any security. Streetwise Reports does not endorse or recommend the business, products, services or securities of any company mentioned on Streetwise Reports. 5) From time to time, Streetwise Reports LLC and its directors, officers, employees or members of their families, as well as persons interviewed for articles and interviews on the site, may have a long or short position in securities mentioned. Directors, officers, employees or members of their immediate families are prohibited from making purchases and/or sales of those securities in the open market or otherwise from the time of the interview or the decision to write an article until three business days after the publication of the interview or article. The foregoing prohibition does not apply to articles that in substance only restate previously published company releases.
Charts courtesy of Michael Ballanger.
Michael Ballanger Disclaimer: This letter makes no guarantee or warranty on the accuracy or completeness of the data provided. Nothing contained herein is intended or shall be deemed to be investment advice, implied or otherwise. This letter represents my views and replicates trades that I am making but nothing more than that. Always consult your registered advisor to assist you with your investments. I accept no liability for any loss arising from the use of the data contained on this letter. Options and junior mining stocks contain a high level of risk that may result in the loss of part or all invested capital and therefore are suitable for experienced and professional investors and traders only. One should be familiar with the risks involved in junior mining and options trading and we recommend consulting a financial adviser if you feel you do not understand the risks involved.