Forex Technical Analysis & Forecast 21.06.2019 (EURUSD, GBPUSD, USDCHF, USDJPY, AUDUSD, USDRUB, GOLD, BRENT)

Article By RoboForex.com

EURUSD, “Euro vs US Dollar”

EURUSD is consolidating around 1.1288. If later the price breaks the range to the upside, the instrument may extend the structure towards 1.1339; if to the downside – start another correction with the target at 1.1264.


EURUSD_Технический анализ
Risk Warning: the result of previous trading operations do not guarantee the same results in the future

GBPUSD, “Great Britain Pound vs US Dollar”

GBPUSD is consolidating around 1.2697. According to the main scenario, the instrument is expected to form a new descending structure to break 1.2671 and then continue trading inside the downtrend with the first target at 1.2616.

GBPUSD_Технический анализ
Risk Warning: the result of previous trading operations do not guarantee the same results in the future

USDCHF, “US Dollar vs Swiss Franc”

USDCHF has the daily descending structure. Today, the pair may form one more ascending structure with the predicted target at 0.9915. After that, the instrument may be corrected towards 0.9853 and then start a new growth to reach 1.0040.

USDCHF_Технический анализ
Risk Warning: the result of previous trading operations do not guarantee the same results in the future

USDJPY, “US Dollar vs Japanese Yen”

USDJPY has finished another descending structure of the third wave to the downside at 107.40. Possibly, today the pair may consolidate near the lows and even update 106.99. If later the price breaks the range to the upside, the instrument may form one more ascending structure with the first target at 107.85.

USDJPY_Технический анализ
Risk Warning: the result of previous trading operations do not guarantee the same results in the future

AUDUSD, “Australian Dollar vs US Dollar”

AUDUSD has finished the correctional structure of Flag pattern. Today, the pair may fall towards 0.6881 and then start another growth to reach 0.6911. Later, the market may form a new descending structure with the target at 0.6829.

AUDUSD_Технический анализ
Risk Warning: the result of previous trading operations do not guarantee the same results in the future

USDRUB, “US Dollar vs Russian Ruble”

There was a gap down during the market opening and USDRUB is still trading downwards; it has already completed the structure with the short-term target at 62.92. Possibly, the pair may be corrected towards 63.87 and then resume trading inside the downtrend with the key target of the third descending wave at 62.77.

USDRUB_Технический анализ
Risk Warning: the result of previous trading operations do not guarantee the same results in the future

XAUUSD, “Gold vs US Dollar”

Gold has almost completed the extension of the daily ascending structure. Possibly, today the pair may consolidate close to the highs. If the price breaks the range to the downside, the instrument may form a new descending structure with the first target at 1374.85. Later, the market may grow towards 1393.33 and then resume trading downwards with the short-term target at 1339.20.

GOLD_Технический анализ
Risk Warning: the result of previous trading operations do not guarantee the same results in the future

BRENT

After breaking 64.10, Brent is still trading upwards; right now, it is forming a continuation pattern right where it broke the descending channel. Today, the pair may grow with the short-term target at 66.60. After that, the instrument may start a new correction to return to 64.10 and then continue growing with the first target at 67.70.

BRENT_Технический анализ

Article By RoboForex.com

Attention!
Forecasts presented in this section only reflect the author’s private opinion and should not be considered as guidance for trading. RoboForex LP bears no responsibility for trading results based on trading recommendations described in these analytical reviews.


Precious Metals Break To Fresh Highs

By Orbex

Gold Bulls React to Policy Guidance and Geopolitical risks

Gold climbed above $1,400/oz today, perhaps for a false weekly break. It set up for the fourth weekly winning streak on the back of a dovish Fed and increasing geopolitical risks. The yellow metal opened the week near $1340/oz on Monday, June 17. This makes it nearly impossible for it to turn bearish in the few hours left.

The precious metal had marked a 5-year high on Thursday, just cents shy of the psychological level. This came after Wednesday’s FOMC meeting.

Policymakers are now leaning significantly dovish as US economic growth continues to slow according to economic indicators. This helped the yellow metal soar to fresh weekly highs above $1400/oz.

The markets have continued to react aggressively since the Fed. This is thanks to tensions in the Iranian territory increasing. Iran’s military reportedly shot down a US military drone. As if that wasn’t enough, media sources reported that Iran also struck a missile on a Saudi Arabian water plant.

Fed Priced in For Two Rate Cuts Now

History indicates that a 0.25 basis points cut may not be enough to stabilize the US economy after this aggressive hiking cycle. Participants have factored a 100% cut in July’s meeting. However, we can expect the Fed to either go with a 50-point cut in the next meeting, or 25 in the next meeting and another 25 on September 18.

Traders and investors now worry both about the Fed’s language and also about the latest piece of data in the US. The dollar was sold off massively over the past few sessions as an array of weak data increased economic uncertainties.

Philly Manufacturing Disappoints at the Wrong Time

The gold call was a relatively easy one to make. Especially when factoring in the list of uncertainties including a dovish Fed, Iran-US escalation, the US-Sino trade war and now, US economic indicators.

Philadelphia’s Fed manufacturing index fell to near zero on Thursday. Economists had expected a figure of 12.6 but the activity index fell short to only a figure of 0.3. The sentiment report supported expectations of a rate cut as the decline reflected muted optimism for the rest of 2019.

Safe Haven Status Restored As US-Iran Conflict Escalates

On Thursday, the Islamic Revolution Guards Corps (IRGC) reportedly shot down a US military drone near a vital oil shipping lane.

US officials had blamed Iran for the two oil tank attacks on the Gulf of Oman earlier in the week. However, the IRGC said that the drone was attacked and taken down after violating Iran’s airspace near the Strait of Hormuz.

Following the drone shootdown, Trump said that the US “will not stand for it” and posted on his twitter that “Iran made a very big mistake”. The interference allowed gold to jump higher as concerns over military confrontation rose.

Gold Breaks Multiyear Bearish Pattern

The rally above $1400/oz could just be short-lived. However, it is likely to be revisited shortly given the break of an impressive bearish pattern.

goldDespite a number of previous infections occurring over the past 5 years, without a significant upside, this bullish run isn’t falling flat after breaking outside a cap and handle pattern as well as a long-standing triangle.

Silver Also Up, Remains Within Corrective Pattern

Silver rose to a fresh 2019 high above $15/oz for the week ending June 21st. However, it has remained within the triangle pattern, keeping the upside limited to $15.60/oz for now.

With a double bottom near $14/oz and two optimistic weeks over the period of the last month,  the chances of a breakout are increasing. Adding to that, the May 27 correction down to 78.6% Fibonacci makes this bullish scenario more aggressive.

silver

By Orbex


Fibonacci Retracements Analysis 21.06.2019 (BITCOIN, ETHEREUM)

Article By RoboForex.com

BTCUSD, “Bitcoin vs US Dollar”

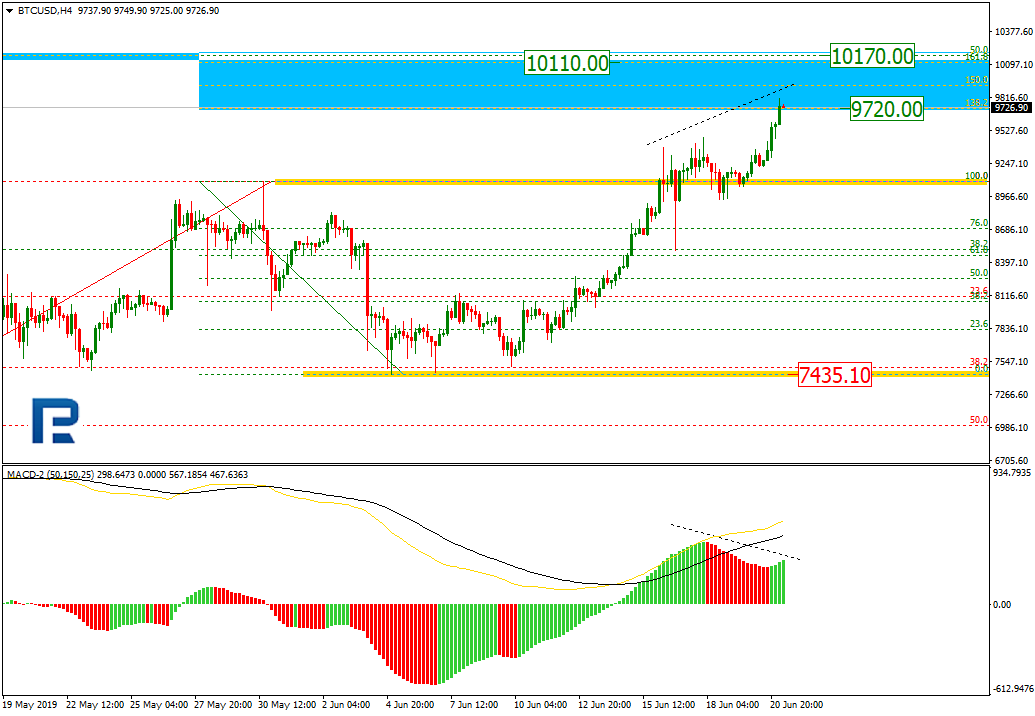
As we can see in the H4 chart, the ascending tendency continues. After breaking its previous high, BTCUSD has moved into the post-correctional extension area between 138.2% and 161.8% fibo at 9720.00 and 10110.00 respectively. The next upside target may be mid-term 50.0% fibo at 10170.00. The key support is at 7435.10. At the same time, there is a divergence on MACD, which may indicate a trend reverse.

BTCUSD_Анализ по Фибоначчи
Risk Warning: the result of previous trading operations do not guarantee the same results in the future

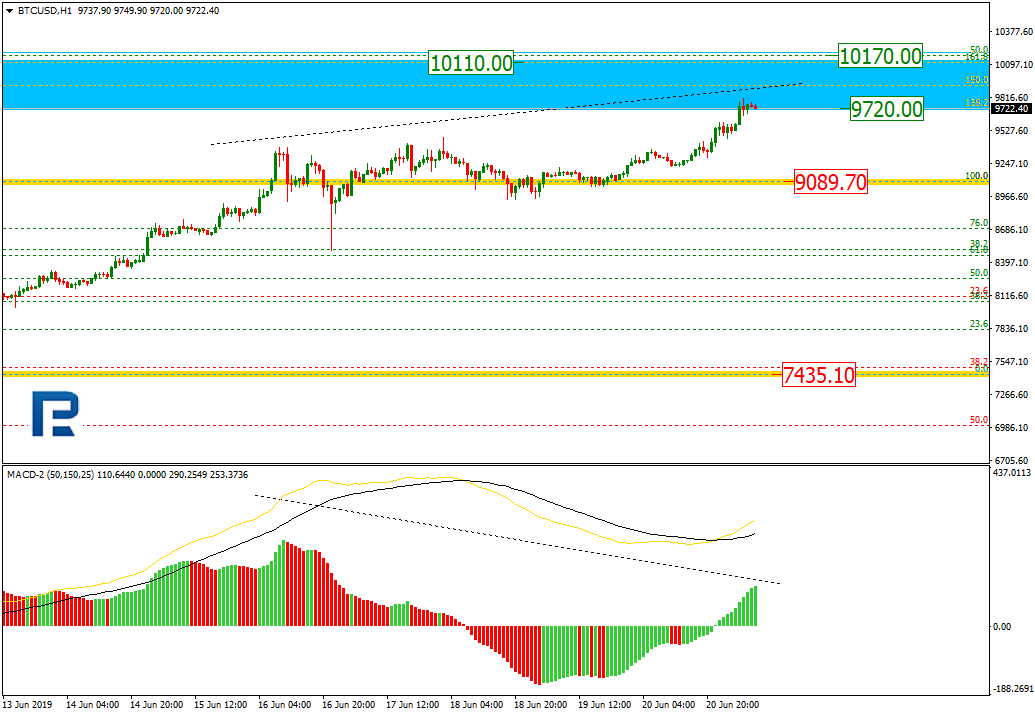
The H1 chart shows more detailed structure of the current uptrend.

Bitcoin_Анализ по Фибоначчи
Risk Warning: the result of previous trading operations do not guarantee the same results in the future

ETHUSD, “Ethereum vs. US Dollar”

As we can see in the H4 chart, ETHUSD is about to reach its significant high at 288.82. If the price breaks it, the instrument may continue growing towards the post-correctional extension area between 138.2% and 161.8% fibo at 313.00 and 327.50 respectively. The support is the low at 226.56.

Ethereum_Анализ по Фибоначчи
Risk Warning: the result of previous trading operations do not guarantee the same results in the future

In the H1 chart, the pair is getting closer to the high at 288.82. At the same time, there is a divergence on MACD.

ETHUSD_Анализ по Фибоначчи
Risk Warning: the result of previous trading operations do not guarantee the same results in the future

Article By RoboForex.com

Attention!
Forecasts presented in this section only reflect the author’s private opinion and should not be considered as guidance for trading. RoboForex LP bears no responsibility for trading results based on trading recommendations described in these analytical reviews.
What Facebook’s Libra tells us: traditional banking is finished and cryptocurrencies are mainstream

By George Prior

Facebook’s jump into cryptocurrencies is another nail in the coffin for traditional banks, says the CEO of one of the world’s largest independent financial advisory organisations.

Nigel Green, the founder and chief executive of deVere Group, is speaking after the social media giant this week set out details of Libra, its own digital currency, to be launched next year.

Mr Green affirms: “Facebook’s launch into cryptocurrencies tells us two things.

“First, the role of traditional banks will decline at a quicker rate than many had previously predicted.  Facebook’s Libra cryptocurrency will be able to transact across traditional payment rails. They have partnered with PayPal, Mastercard, Visa and Stripe, amongst others to fuel merchant acceptance of the digital currency.

“If you have cryptocurrency on these payment methods, the purpose of and use for traditional banks will surely shrink.

“Cryptocurrencies and fintech [financial technology] solutions are already taking business away from banks.  They are filling a gap left by the traditional way of doing things as the world speeds up and becomes increasingly globalised and digitalised.

“The jump into cryptocurrencies – which are the future of money – by Facebook which already has 2.7 billion users can really only be seen as another nail in the coffin for banks.”

He continues: “Second, tech giants entering the cryptocurrency sector indicates that digital money, as a concept, is fully mainstream and inevitably the way the world is going.  This is something we have been arguing for a long time now – despite protestations from financial traditionalists.

“Where Facebook leads, others will inevitably follow, and this will quicken the pace of mass adoption of cryptocurrencies.”

The deVere CEO concludes: “This is a major development in the crypto-verse and it is surely just the beginning. This is set to revolutionise how people access, manage and use money across the world and it will positively disturb the wider banking sector. Banking as we have known it until now is coming to an end.”

About:

deVere Group is one of the world’s largest independent advisors of specialist global financial solutions to international, local mass affluent, and high-net-worth clients.  It has a network of more than 70 offices across the world, over 80,000 clients and $12bn under advisement.


Central Banks Shift To Dovish Forward Guidance

By Orbex

Following the FOMC meeting on Wednesday and the surprise comments from the ECB’s Draghi on cutting rates further, many other central banks have shifted course.

The latest is the Bank of Japan. Overshadowed by other major themes, the Bank of Japan left interest rates unchanged. BoJ Governor Kuroda said that the central bank was ready to increase stimulus as global outlook turns murky.

Euro Gains on a Weak USD

As the US dollar weakened following the FOMC meeting, the common currency posted strong gains on the day. Economic data from the eurozone was sparse. The reversal in the EURUSD came after both the ECB and the Fed came out with dovish forward guidance. Flash manufacturing PMI reports from the eurozoneare due later today.

EURUSD Likely to Consolidate Near Current Highs

The single currency managed to reverse the losses from earlier this week. Price posted strong gains as it broke past the 1.1250 level. At the time of writing, the EURUSD is trading near the 1.1300 handle. We expect price action to remain anchored around this level in the near term. The 4-hour chart signals a hidden bearish divergence which could see price dipping to 1.1250 to establish support.

eurusd

Sterling Muted to BoE

Following weeks of voting, Boris Johnson is set to become the next Prime minister of the United Kingdom. Having won the UK conservative party leadership vote, Johnson is set to replace PM May who resigned after failing to deliver a Brexit deal. Elsewhere, the BoE held its monetary policy meeting but left the interest rates unchanged. The sterling was unmoved on the outcome of the meeting.

GBPUSD Could Continue Higher

The GBPUSD currency pair continued to maintain its gains over the week. Price is testing the resistance level of 1.2716 at the time of writing. A breakout above this level is required to keep the momentum going. The upside bias comes on the bullish divergence seen on the daily chart. A close above 1.2716 could confirm this view as GBPUSD will be targeting 1.2895 next.

GBPUSD

Gold Maintains the Upside Momentum

The precious metal continued to surge higher on the day as price tested $1400 an oz earlier this morning. The gains come as central banks shift to dovish forward guidance across the globe. Meanwhile, rising tensions between Washington and Tehran also add to the global concerns of a potential fallout into a war.

XAUUSD Could Consolidate Near Highs

Following a week of strong gains, gold could pause its gains in the short term. After this morning’s spike to 1400.00, which is a key psychological level, gold prices could see a pullback. In the short term, support could be seen at 1390.25. However, for this pullback to occur, the precious metal will need to signal a bearish reversal pattern near the current highs.

XAUUSDBy Orbex


The Analytical Overview of the Main Currency Pairs on 2019.06.21

by JustForex

The EUR/USD currency pair

Technical indicators of the currency pair:
  • Prev Open: 1.12260
  • Open: 1.12942
  • % chg. over the last day: +0.61
  • Day’s range: 1.12872 – 1.13091
  • 52 wk range: 1.1111 – 1.2009

EUR/USD stabilized after rapid growth. Right now the trending instrument is consolidating. The local support and resistance levels are 1.12700-1.13100. USD remains under pressure due to the dowish Fed policy. The regulator is willing to lower the rates at the next few meetings. Review several releases from the EU and the US and open positions from the key levels.

The Economic News Feed for 21.06.2019:

  • – Business Activity Report (EU) – 10:30 (GMT+3:00);
  • – Secondary Real Estate Sales (EU) – 17:00 (GMT+3:00);
EUR/USD

The price fixed above 50 MA and 100 MA which points to the power of the buyers.

The MACD histogram is in the positive zone but below a signal line which gives a weak signal to buy EUR/USD.

The Stochastic Oscillator is in the neutral zone, the %K line is below the %D line which points towards correctino of EUR/USD.

Trading recommendations
  • Support levels: 1.12700, 1.12400, 1.12100
  • Resistance levels: 1.13100, 1.13400

If the price fixes above 1.13100, expect further growth towards 1.13400-1.13600.

Alternatively, the quotes can fall towards 1.12500-1.12300.

The GBP/USD currency pair

Technical indicators of the currency pair:
  • Prev Open: 1.26408
  • Open: 1.27033
  • % chg. over the last day: +0.53
  • Day’s range: 1.26903 – 1.27247
  • 52 wk range: 1.2438 – 1.3631

GBP/USD is moving sideways. There is no defined trend. GBP is testing the key support and resistance levels are 1.26750-1.27250. The Bank of England kept the monetary policy at the same level. The regulator has worsened the economy growth forecasts for the country. The Central Bank is also worried about the high-stress environment in the world trade and the Brexit ambiguousness. Keep an eye on the US economic reports and open positions from the key levles.

The Economic News Feed for 21.06.2019 is calm.

GBP/USD

The price fixed above 50 MA and 200 MA which points to the power of the buyers.

The MACD histogram is in the positive zone but below the signal line which gives a weak signal to buy GBP/USD.

The Stochastic Oscillator is in the neutral zone, the %K line is below the %D line which points towards a correctino of GBP/USD.

Trading recommendations
  • Support levels: 1.26750, 1.26300, 1.26000
  • Resistance levels: 1.27250, 1.27600

If the price fixes above 1.27250, expect further growth towards 1.27600-1.27800.

Alternatively, the quotes can descend towards 1.26400-1.265200.

The USD/CAD currency pair

Technical indicators of the currency pair:
  • Prev Open: 1.32787
  • Open: 1.31897
  • % chg. over the last day: -0.72
  • Day’s range: 1.31622 – 1.31960
  • 52 wk range: 1.2727 – 1.3664

USD/CAD is consolidating after a rapid fall since the beginning of the week. The key support and resistance levels are 1.31600 and 1.32200. USD remains under pressure. A technical correction is possible soon. We expect important report from Canada. Keep an eye on the oil quotes dynamics and open positions from the key levels.

At 15:30 (GMT+3:00) Canada will publish a retail sales report.

USD/CAD

The price is fixed below 50 MA and 200 MA which points to the power of the buyers.

The MACD histogram is in the negative zone but above the signal line which gives a weak signal to sell USD/CAD.

The Stochastic Oscillator is in the neutral zone, the %K line is above the %D line which points towards a correction of USD/CAD.

Trading recommendations
  • Support levels: 1.31600, 1.31300, 1.31000
  • Resistance levels: 1.32200, 1.32500, 1.33000

If the price fixes below 1.31600 local support, expect further descend towards 1.31300-1.31000.

Alternatively, the quotes can correct towards 1.32500-1.32800.

The USD/JPY currency pair

Technical indicators of the currency pair:
  • Prev Open: 108.099
  • Open: 107.288
  • % chg. over the last day: -0.74
  • Day’s range: 107.049 – 107.370
  • 52 wk range:: 104.97 – 114.56

USD/JPY remains in a bearish mood. Right now the trading instrument is testing the key minimums. The local support and resistance levels are 107.000 and 107.400. The demand for USD remains low after the Federal Reserve meeting. The USD/JPY quotes have prospects for further descend. Keep an eye on the US Treasury bonds’ yield and open positions from the key levels.

The Economic News Feed for 21.06.2019 is calm.

USD/JPY

The price fixed below 50 MA and 100 MA which points to the power of the buyers.

The MACD histogram is in the negative zone but above the signal line which gives a weak signal to sell USD/JPY.

The Stochastic Oscillator is in the neutral zone, the %K line is above the %D line which points towards a recovery of USD/JPY.

Trading recommendations
  • Support levels: 107.000, 106.500
  • Resistance levels: 107.400, 107.600, 107.850

If the price fixes below 107.000, epxect further growth towards 106.600-106.400.

Alternatively, the quotes can grow towards 107.600-107.850.

by JustForex

What To Expect From US Housing Data

By Orbex

The last major data point for this week comes out later today and is Existing Home Sales from the US.

As one of the most important consumer sectors in the US that is highly dependent on credit, it can give us some important insight into how the core of the economy is doing.

Over the last couple of years, the Fed’s policy of raising rates while dramatically reducing their balance sheet has led to a significant reduction of liquidity in the economy.

The most affected have been emerging markets, but that doesn’t mean the US is immune. The phenomenon has an extra impact on the housing market, considering that unemployment is at a record low, and there should be more people looking to buy homes.

What We Are Looking For

Expectations are for Existing Home Sales to come in at 5.20M, which is basically in line with last month’s 5.19M. The number did some bouncing around at the beginning of the year because of the government shutdown. But the trend has been pretty consistent: slower sales over time.

An explanation might be that as the economy improves, people are opting to buy new houses instead of used. On Tuesday we get New Home Sales which are projected to come in at 685K. This is up slightly from the 673K in the prior month. The trend has been on the upside since the end of last year.

The Trends

Overall, if we combine both figures, the number of homes sold in America has dropped by about 200K since the beginning of the year. November last year also saw the peak in average mortgage rates at 4.94%. However, it fell back to the level it was near the beginning of the Fed’s hiking cycle, registering 3.84% yesterday.

Given population growth, the relative robustness of the economy, and low unemployment, we ought to see home sales increasing and upward pressure on yields.

The median home price in the US according to the Fed dropped 4.7% to $307.7K during the first quarter. This is not to be confused with the average house price, which in April contracted for the first time in seven years according to Zillow.

The Market is Cyclical

We haven’t had that combination of factors since before the subprime crisis in 2007. Typically average house prices in the US rise around 7% annually (often tracking somewhere around double the inflation rate).

Is the housing market running out of steam? And what does this mean for the finance industry, where mortgage delinquencies are still higher than credit card NPAs?

It’s not all concerning news, of course. The US is by far not in the same situation it was 12 years ago. While housing inventories remain high, they also peaked in November, and have since broadly been declining. In the meantime, housing permits and starts (which were reported last Tuesday) have remained largely consistent.

Consumer Demand is Key

The important question is whether mortgage yields and the housing market are being driven by structural issues, or whether it’s because people are holding off buying for some reason. And if it’s the latter case, what reason would lead Americans to forego buying homes?

Around the time in the drop in home sales, there were quite a lot of news articles worrying about the housing market, but they have since gone silent.

In the short term, the housing condition is likely not to have a major impact on the currency market. And maybe we are having some anomalous data points which will smooth out as we get firm data at the close of the first quarter.

But, with the Fed leaving the door open for a cut this year, yields might be expected to go down. If the increased access to cheaper credit doesn’t motivate homebuyers, we might want to keep an eye on this.

By Orbex


The US Currency Is Still Under Pressure

by JustForex

The US dollar has reached a low for three months against the basket of major currencies after the Fed meeting. The US currency is still under pressure since the regulator may reduce the key interest rate in the near future. The US dollar index #DX closed in the negative zone (-0.59%) yesterday.

Yesterday, the Bank of England left a key interest rate unchanged at 0.75%, as investors forecasted. At the same time, the regulator lowered the UK economic growth forecast to zero in the second quarter of 2019 and pointed out the risks associated with growing fears of no-deal Brexit. Also, a rather weak report on retail sales in the UK for May was published.

Mixed economic data from the US were published yesterday. Philadelphia Fed manufacturing index increased by only 0.3% in June, while experts expected growth by 10.6. However, initial jobless claims counted to 216K instead of 220K. Today we expect a report on existing home sales in the US, as well as a number of indicators on economic activity in the Eurozone.

The “black gold” prices are rising. At the moment, futures for the WTI crude oil are testing the mark of $57.25 per barrel.

Market Indicators

Yesterday, the bullish sentiment was observed in the US stock market: #SPY (+0.96%), #DIA (+0.95%), #QQQ (+0.93%).

The 10-year US government bonds yield has become stable after a significant collapse the day before. Currently, the indicator is at the level of 2.02-2.03%.

The news feed on 2019.06.21:

– Statistics on economic activity in Germany and the Eurozone at 10:30 (GMT+3:00) and 11:00 (GMT+3:00);
– Core retail sales in Canada at 15:30 (GMT+3:00);
– Existing home sales in the US at 17:00 (GMT+3:00).

by JustForex

Gold breaks through a multi-year resistance zone – strong buy!

By Admiral Markets

Source: Economic Events June 21, 2019 – Admiral Markets’ Forex Calendar

Last Wednesday, the eyes of the market were on the Fed rate decision and their projection for the US economy, as well as the proposed monetary policy decisions from the Fed.

While the US central bank did not cut rates, markets found several hints in the Fed statement for several cuts in the second half of 2019 (e.g. in the Fed Dot plot), starting with the next meeting in July where the Fed Watch Tool now shows market participants expecting a cut with a 100% probability.

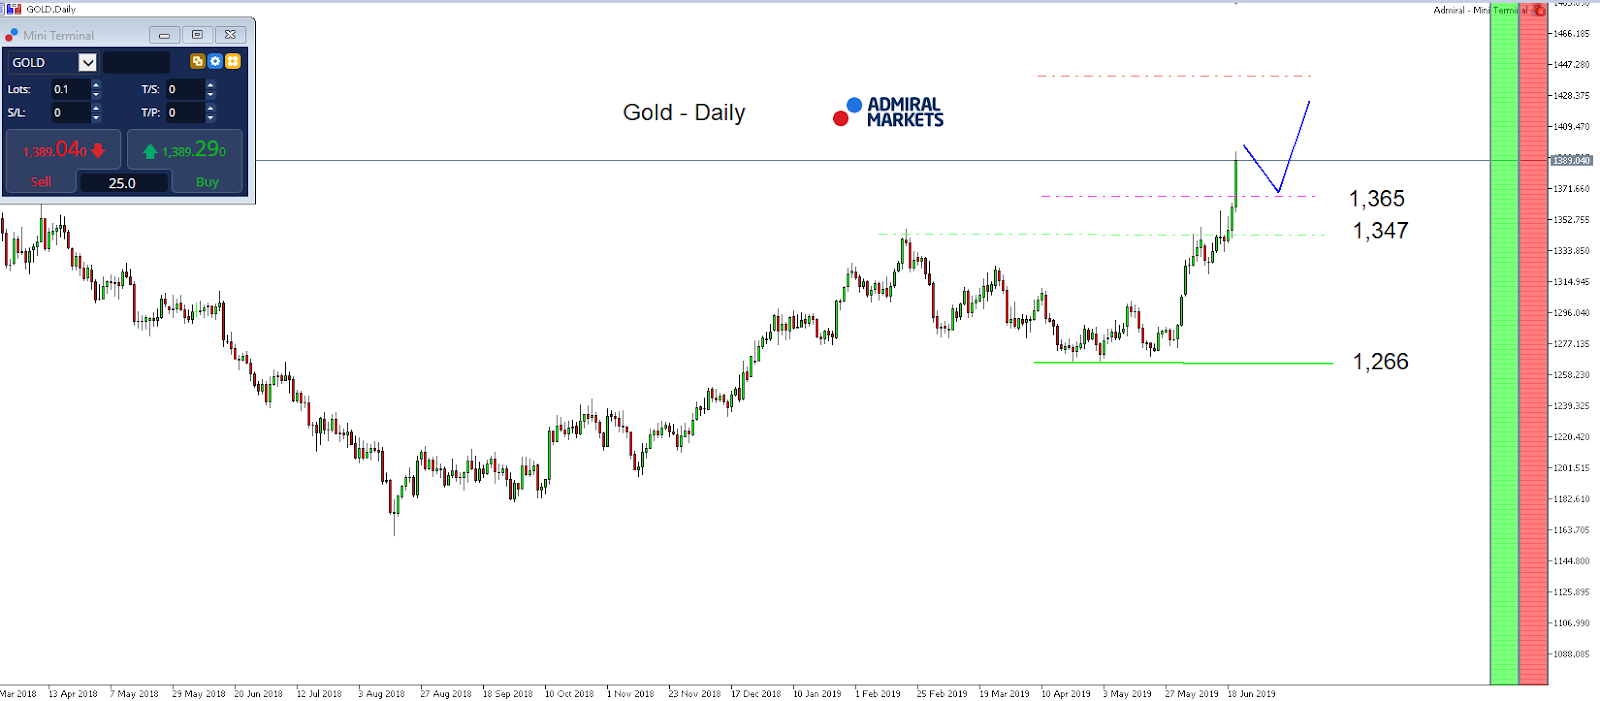
As a result, Gold pushed already to new yearly highs on Wednesday and took out the multi-year-resistance zone around 1,360/365 in the early hours of trading on Thursday.

As we discussed in our weekly market outlook last Monday, […]A break higher and above 1,360/365 can be considered a strong mid-term buy-signal which sees a projected target somewhere around 1,700 USD, and possibly even higher.[…]

That said, under the given fundamental and technical outlook, the current device in Gold seems clearly to be ‘Buy the dip’, with finding an interesting first long-trigger around 1,360/365 USD.

In general, the bullish picture in Gold on a daily time-frame stays active as long as we trade above 1,266 USD:

Source: Admiral Markets MT5 with MT5-SE Add-on Gold Daily chart (between March 19, 2018, to June 20, 2019). Accessed: June 20, 2019, at 10:00pm GMT – Please note: Past performance is not a reliable indicator of future results, or future performance.

In 2014, the value of Gold fell by 1.7%, in 2015, it fell by 10.4%, in 2016, it increased by 8.1%, in 2017, it increased by 13.1%, in 2018, it fell by 1.6%, meaning that after five years, it was up by 6.4%.

Investing in Forex with Admiral Markets

Admiral Markets offers professional traders the ability to trade with a custom, upgraded version of MetaTrader 5, allowing you to experience trading at a significantly higher, more rewarding level. Experience benefits such as the addition of the Market Heat Map, so you can compare various currency pairs to see which ones might be lucrative investments, access real-time trading data, and so much more. Click the banner below to start your FREE download of MT5 Supreme Edition!

Download MetaTrader 5 and begin trading today!

Disclaimer: The given data provides additional information regarding all analysis, estimates, prognosis, forecasts or other similar assessments or information (hereinafter “Analysis”) published on the website of Admiral Markets. Before making any investment decisions please pay close attention to the following:

  1. This is a marketing communication. The analysis is published for informative purposes only and are in no way to be construed as investment advice or recommendation. It has not been prepared in accordance with legal requirements designed to promote the independence of investment research, and that it is not subject to any prohibition on dealing ahead of the dissemination of investment research.
  2. Any investment decision is made by each client alone whereas Admiral Markets shall not be responsible for any loss or damage arising from any such decision, whether or not based on the Analysis.
  3. Each of the Analysis is prepared by an independent analyst (Jens Klatt, Professional Trader and Analyst, hereinafter “Author”) based on the Author’s personal estimations.
  4. To ensure that the interests of the clients would be protected and objectivity of the Analysis would not be damaged Admiral Markets has established relevant internal procedures for prevention and management of conflicts of interest.
  5. Whilst every reasonable effort is taken to ensure that all sources of the Analysis are reliable and that all information is presented, as much as possible, in an understandable, timely, precise and complete manner, Admiral Markets does not guarantee the accuracy or completeness of any information contained within the Analysis. The presented figures refer that refer to any past performance is not a reliable indicator of future results.
  6. The contents of the Analysis should not be construed as an express or implied promise, guarantee or implication by Admiral Markets that the client shall profit from the strategies therein or that losses in connection therewith may or shall be limited.
  7. Any kind of previous or modeled performance of financial instruments indicated within the Publication should not be construed as an express or implied promise, guarantee or implication by Admiral Markets for any future performance. The value of the financial instrument may both increase and decrease and the preservation of the asset value is not guaranteed.
  8. The projections included in the Analysis may be subject to additional fees, taxes or other charges, depending on the subject of the Publication. The price list applicable to the services provided by Admiral Markets is publicly available from the website of Admiral Markets.
  9. Leveraged products (including contracts for difference) are speculative in nature and may result in losses or profit. Before you start trading, you should make sure that you understand all the risks.

By Admiral Markets

EURUSD: correction after 2 days of growth

By Alpari.com

Previous:

On Thursday the 20th of June, trading on the euro closed up. The euro made gains against the dollar on the back of a rising EURGBP cross and a broadly weaker dollar, which slid over expectations of a rate slash by the US Fed. Rising oil prices provided additional support to the majors via commodity currencies. The EURUSD pair reached the 1.1316 mark, after which it underwent a correction to 1.1271.

Brent oil rose by 3.8% to 64.78. This occurred in response to Iran shooting down a US drone, along with America’s response, increasing tensions in the Middle East.

Day’s news (GMT+3):

  • 10:30 Germany: Markit manufacturing PMI (Jun).
  • 11:00 Eurozone: Markit PMI composite (Jun).
  • 11:30 UK: public sector net borrowing (May).
  • 15:00 UK: BoE quarterly bulletin (Q2).
  • 15:30 Canada: retail sales (Apr).
  • 16:45 US: Markit manufacturing PMI (Jun), Markit services PMI (Jun).
  • 17:00 US: existing home sales (May).
  • 20:00 US: Baker Hughes US oil rig count.

EURUSD H1Current situation:

At the time of writing, the euro is trading at 1.1284. Buyers are having a difficult time in today’s Asian session. After the drone incident, US President Donald Trump approved air strikes on Iran. He called them off later, but giving the order again at any moment would be very much his style. Details of this incident were reported by the New York Times.

Talk of interest rates has been replaced on the front pages by the situation in the Middle East. The ongoing retreat towards safe havens could trigger a big correction on the euro. As of now, I’m expecting a downwards correction to the 45th degree at 1.1263. If the pair drops faster than forecasted, it should fall as far as 1.1255/50.

By Alpari.com