The week ahead will see the GDP themes dominating the news wires amid a somewhat slow week.
Various economies will be releasing their respective GDP figures this week, including the US, UK, and Canada.
The RBNZ’s monetary policy meeting will be held this week. No changes are expected to the official cash rate at this week’s meeting.
Data from the eurozone will see the flash estimates on inflation coming out. The data which covers the month of June is forecast to show that inflation grew at the same pace as the month before. Headline CPI is forecast to rise 1.2% on the year while core CPI is forecast to rise 1.0% on the year in June.
Given the fact that ECB President Draghi commented on the dovish policy from the central bank, this week’s inflation report from the eurozone will be closely watched.
GDP data from the US is forecast to show no change, as are the second revised GDP estimates from the UK. Canada’s monthly GDP data is forecast to show a 0.2% increase in growth. This marks a slower pace of increase compared to 0.5% in the month before.
Here’s a quick recap of what’s to come in the currency markets this week.
RBNZ Monetary Policy Meeting
The Reserve Bank of New Zealand will be holding its monetary policy meeting this week early Wednesday. No changes are expected to the official cash rate which is projected to remain steady at 1.50%.
The basis for this view comes as the RBNZ cut rates at its meeting in May.
The markets are currently expecting to see the RBNZ lower interest rates once more in August this year. Thus, investors will be looking closely to the RBNZ’s monetary policy statement. This comes as recent economic data saw New Zealand’s GDP advancing 0.6% on the quarter.
While the GDP expansion in Q1 was in line with estimates, the annualized growth rate was at just 2.5%. But this is still lower comparing to 2016’s highs of 4.0% GDP expansion.
Business investment has declined, however, with investment in equipment turning flat over the year. With China bearing the brunt of the US tariffs, the slowdown in China will be affecting New Zealand and Australia as well, some of its closest trading partners.
Ahead of the RBNZ meeting, New Zealand’s trade balance figures will be coming out. Forecasts point to a headline print of 200 million, down from 433 million previously. Later in the week, the ANZ Business confidence survey report will also be coming out.
Business confidence slipped to -32 previously and this decline could continue into the latest survey.
US Q1 GDP Final Estimates
The first quarter final GDP estimates will be released this week. Economists forecast no change and expect the US economy to maintain a growth rate of 3.1% in the first 3 months of the year.
This marks an unchanged print compared to the second estimates. However, given the recent data about the current account gap narrowing, there is scope for the GDP to be tweaked somewhat higher.
Besides the GDP report, other important events over the week include a speech by Fed Chair Jerome Powell. Powell will be speaking after the Fed opted to hold rates steady at its meeting last week.
The US personal spending and income data are also due this week. Economists forecast personal spending to rise by 0.2%, which marks the same pace of increase as the month before. Personal income is, however, forecast to rise 0.5%, advancing from the 0.3% increase registered previously.
The week concludes with the University of Michigan’s inflation expectations and consumer sentiment report. Consumer sentiment is expected to dip softly to 97.4 from 97.9 previously. Inflation expectationscurrently stand at 2.6%.
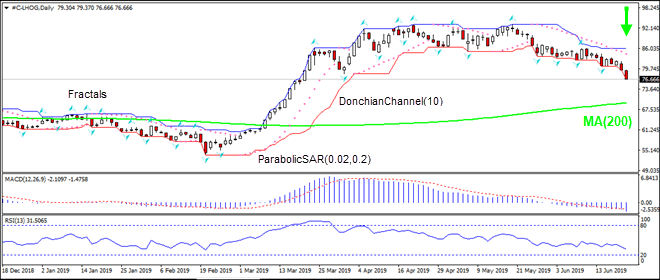
US exports of pork to Mexico is declining. Will the LHOG continue sliding?
US exports of pork to Mexico were 232,392 metric tons in the first four months of 2019, 18% down compared to the same time period a year ago, according to the US Department of Agriculture. Lower export demand is bearish for pork prices. At the same time the flooding in Midwest is expected to negatively impact corn and soybean crops, which are main feed for pigs. And tighter feed supply is an upside risk for hog prices.
On the daily timeframe the LHOG: D1 is falling toward the 200-day moving average MA(200).
The Parabolic indicator gives a sell signal.
The Donchian channel indicates downtrend: it is widening down.
The MACD indicator gives a bearish signal: it is below the signal line and the gap is widening.
The RSI oscillator is falling but has not breached into the oversold zone.
We believe the bearish momentum will continue after the price breaches below the lower boundary of Donchian channel at 76.65. This level can be used as an entry point for placing a pending order to sell. The stop loss can be placed above the upper Donchian boundary at 86.06. After placing the order, the stop loss is to be moved every day to the next fractal high, following Parabolic signals. Thus, we are changing the probable profit/loss ratio to the breakeven point. If the price meets the stop loss level (86.06) without reaching the order (76.65), we recommend cancelling the order: the market has undergone internal changes which were not taken into account.
EURUSD is still consolidating above 1.1365. Possibly, today the pair may test this level from above. If the price breaks it, the instrument may start another correction with the first target at 1.1344. Later, the market may form one more ascending structure to return to 1.1365 and then start a new decline to reach 1.1266.
GBPUSD, “Great Britain Pound vs US Dollar”
GBPUSD is consolidating around 1.2746. According to the main scenario, the instrument is expected to form one more ascending structure towards 1.2760 and then resume trading downwards to reach 1.2727. If later the price breaks this level, the instrument may continue trading inside the downtrend with the first target at 1.2700.
USDCHF, “US Dollar vs Swiss Franc”
USDCHF is still consolidating above 0.9750. Today, the pair may form one more ascending structure with the first target at 0.9800.
USDJPY, “US Dollar vs Japanese Yen”
USDJPY is consolidating around 107.33. Possibly, today the pair may grow to reach 107.55 and then form a new descending structure towards 107.22. If later the price breaks this level, the instrument may continue trading inside the downtrend with the short-term target at 106.90.
AUDUSD, “Australian Dollar vs US Dollar”
After forming another consolidation range above 0.6907, AUDUSD broke it upwards; by now, it has extended the third wave towards 0.6960. Today, the pair may fall towards 0.6935 and then start another growth to reach 0.6983.
USDRUB, “US Dollar vs Russian Ruble”
USDRUB is still consolidating around 63.24. Possibly, today the pair may form a new descending structure towards 62.77. After that, the instrument may start a new growth with the target at 64.00.
XAUUSD, “Gold vs US Dollar”
Gold is consolidating around 140.00. If later the price breaks the range to the upside, the instrument may extend the structure towards 1418.20; if to the downside – start another decline with the target at 1366.00.
BRENT
Brent is still trading upwards; right now, it is forming another continuation pattern at 65.20. The short-term target is at 66.60. After that, the instrument may start a new correction to return to 64.20 and then continue growing with the first target at 67.70.
Attention! Forecasts presented in this section only reflect the author’s private opinion and should not be considered as guidance for trading. RoboForex LP bears no responsibility for trading results based on trading recommendations described in these analytical reviews.
In case of XAUUSD, it’s better to analyze the current situation using the daily chart. From the technical point of view, we can see that the pair has reached the post-correctional extension area between 138.2% and 161.8% fibo. At the same, we should note that the price is getting closer to long-term correctional 50.0% fibo at 1422.00. The support is the previous low at 1346.68. At the same time, there is a divergence on MACD, which may indicate a possible reverse soon.
In the H4 chart, there is a divergence on MACD, which indicates a possible pullback in the nearest future. The downside targets are 23.6%, 38.2%, and 50.0% fibo at 1378.30, 1357.40, 1324.30, and 1340.60 respectively. The resistance is the high at 1411.85.
USDCHF, “US Dollar vs Swiss Franc”
Let’s consider the long-term scenario of USDCHF on the daily chart. There was a divergence on MACD, which made the pair reverse and start a new descending tendency. By now, it has already reached 38.2 fibo. The next downside targets may be 50.0% and 61.8% fibo at 0.9712 and 0.9589 respectively. The resistance is at 23.6% fibo at 0.9987.
In the H4 chart, the downtrend continues; the pair has already reached the post-correctional extension area between 138.2% and 161.8% fibo. The next target may be 50.0% fibo at 0.9712. At the same time, there is a convergence on MACD, which indicates a possible pullback soon.
Attention! Forecasts presented in this section only reflect the author’s private opinion and should not be considered as guidance for trading. RoboForex LP bears no responsibility for trading results based on trading recommendations described in these analytical reviews.
The rationale for investing in this Canadian firm is presented in a ROTH Capital Partners report.
In a June 19 research note, analyst Joe Reagor reported that ROTH Capital Partners initiated coverage on Integra Resources Corp. (ITR:TSX.V; IRRZF:OTCQB) with a Buy rating and a CA$1.40 per share price target. The company’s stock is currently trading at around CA$0.88 per share. The updated resource estimate released June 17, 2019, prompted ROTH’s move.
“We view Integra as an early-stage exploration company with a strong management team looking to repeat its success by advancing its Idaho project and attracting an acquirer,” Reagor summarized. “We also believe the project has significant resource expansion potential.”
He then individually reviewed the compelling aspects of the company.
One is the updated resource estimate for Integra’s flagship project DeLamar, a past-producing mine in southwestern Idaho that consists of the DeLamar and Florida Mountain gold and silver deposits.
Per the new update, DeLamar now contains Measured and Indicated resources of 172.4 million ton (172.4 Mt) with an average of 0.7 grams per ton (0.7 g/t) gold equivalent (Au eq). Current Inferred resources are 28.3 Mt grading 0.55 g/t Au eq. These numbers result in 4.4 million ounces of contained Au eq, a 23.5% increase since the prior report.
“With this increased resource estimate, we believe Integra is poised to release an initial preliminary economic assessment for the project in H2/19,” which will be the next major catalyst for the stock,” Reagor commented.
He added that the DeLamar property likely offers further resource growth potential. Integra plans to tap into that by drilling another 13,000 meters there this year.
Another benefit to Integra is the jurisdiction its project is in, Idaho, which has been mining friendly for a long time. Reagor noted permitting risk is lower for DeLamar because mining took place there historically.
A third positive is Integra’s management team that “has done it before,” Reagor noted, referring to the company’s CEO George Salamis and Chairman Stephen de Jong having advanced and sold Integra Gold to Eldorado Gold in 2017. Management’s previous success, the analyst added, “will enable the company to raise the necessary capital to advance its DeLamar asset towards a construction decision.” Integra is well positioned to move the project forward quickly.
Disclosure: 1) Doresa Banning compiled this article for Streetwise Reports LLC and provides services to Streetwise Reports as an independent contractor. She or members of her household own securities of the following companies mentioned in the article: None. She or members of her household are paid by the following companies mentioned in this article: None. 2) The following companies mentioned in this article are billboard sponsors of Streetwise Reports: None. Click here for important disclosures about sponsor fees. 3) Comments and opinions expressed are those of the specific experts and not of Streetwise Reports or its officers. The information provided above is for informational purposes only and is not a recommendation to buy or sell any security. 4) The article does not constitute investment advice. Each reader is encouraged to consult with his or her individual financial professional and any action a reader takes as a result of information presented here is his or her own responsibility. By opening this page, each reader accepts and agrees to Streetwise Reports’ terms of use and full legal disclaimer. This article is not a solicitation for investment. Streetwise Reports does not render general or specific investment advice and the information on Streetwise Reports should not be considered a recommendation to buy or sell any security. Streetwise Reports does not endorse or recommend the business, products, services or securities of any company mentioned on Streetwise Reports. 5) From time to time, Streetwise Reports LLC and its directors, officers, employees or members of their families, as well as persons interviewed for articles and interviews on the site, may have a long or short position in securities mentioned. Directors, officers, employees or members of their immediate families are prohibited from making purchases and/or sales of those securities in the open market or otherwise from the time of the interview or the decision to write an article until three business days after the publication of the interview or article. The foregoing prohibition does not apply to articles that in substance only restate previously published company releases.
Disclosures from ROTH Capital Partners, Integra Resources Corp., Company Note, June 19, 2019
Regulation Analyst Certification (“Reg AC”): The research analyst primarily responsible for the content of this report certifies the following under Reg AC: I hereby certify that all views expressed in this report accurately reflect my personal views about the subject company or companies and its or their securities. I also certify that no part of my compensation was, is or will be, directly or indirectly, related to the specific recommendations or views expressed in this report.
Shares of Integra Resources Corp. (OTCMKTS: IRRZF) may be subject to the Securities and Exchange Commission’s Penny Stock Rules, which may set forth sales practice requirements for certain low-priced securities.
ROTH Capital Partners, LLC expects to receive or intends to seek compensation for investment banking or other business relationships with the covered companies mentioned in this report in the next three months.
EUR\USD remains in a bullish mood. Last week, the euro updated key extremes and reached three-month highs. The demand for Greenback has weakened significantly since the Fed meeting. The regulator is ready to consider the question of lowering interest rates at upcoming meetings. Additional support for the single currency provide positive data on business activity in the euro area, which were published on Friday. At the moment, EUR/USD quotes are consolidating. Local levels of support and resistance are 1.13550 and 1.13850, respectively. Trading instrument has the potential for further growth. Positions must be opened from key levels.
The Economic News Feed for 24.06.2019:
– IFO Business climate index (EU) – 00:00 (GMT+3:00);
The price fixed above 50 MA and 100 MA which points to the power of the buyers.
The MACD histogram is in the positive zone but below the key line which gives a weak signal t buy EUR\USD
The Stochastic Oscillator is in the neutral zone, the %K line is below the %D line which points to a correction of EUR\USD.
Trading recommendations
Support levels: 1.13550, 1.13400, 1.13100
Resistance levels: 1.13850, 1.14000, 1.14400
If the price fixes above 1.13850, expect a growth towards 1.14200-1.14400.
Alternatively, the quotes can correct towards 1.13200-1.14400.
The GBP/USD currency pair
Technical indicators of the currency pair:
Prev Open: 1.27033
Open: 1.27328
% chg. over the last day: +0.32
Day’s range: 1.27297 – 1.27595
52 wk range: 1.2438 – 1.3631
GBP/USD shows a steady uptrend. Currently, sterling is consolidating near monthly highs. GBP/USD quotes are testing local resistance at 1.27600. 1.27250 is already a “mirror” support. Demand for the USD remains at a fairly low level. Trading instrument has the potential for further growth. We recommend to keep track of current information on the issue of Brexit. Positions must be opened from key levels.
The Economic News Feed for 24.06.2019 is calm.
The price fixed above 50 MA and 100 MA which points to the power of the buyers.
The MACD histogram is in the positive zone and keeps rising which gives a strong signal to buy GBP\USD.
The Stochastic Oscillator is in the neutral zone, the %K line is crossing the %D line. There are no signals at the moment.
Trading recommendations
Support levels: 1.27250, 1.26750, 1.26450
Resistance levels: 1.27600, 1.28000
If the price fixes above 1.27600, expect further growth towards 1.28000.
Alternatively, the quotes can descend towards 1.26900-1.26600.
The USD/CAD currency pair
Technical indicators of the currency pair:
Prev Open: 1.31897
Open: 1.32137
% chg. over the last day: +0.24
Day’s range: 1.31817 – 1.32164
52 wk range: 1.2727 – 1.3664
USD/CAD continues to consolidate. There is no unidirectional trend. CAD is testing local supply and demand zones: 1.31500-1.31750 and 1.32250-1.32500, respectively. USD/CAD quotes can decline further. Additional support for the CAD is provided by the positive dynamics of oil prices. Positions must be opened from key levels.
The Economic News Feed for 24.06.2019 is calm.
The indicators do not provide precise signals, the price has crossed 50 MA.
The MACD histogram started to descend which points to the bearish mood.
The Stochastic Oscillator is in the oversold zone, the %K line is crossing the %D line. There are no signals at the moment.
Trading recommendations
Support levels: 1.31750, 1.31500, 1.31200
Resistance levels: 1.32250, 1.32500, 1.33000
If the price fixes below 1.31750, expect further descend towards 1.31400-1.31200.
Alternatively, the quotes can grow towards 1.32600-1.32800.
The USD/JPY currency pair
Technical indicators of the currency pair:
Prev Open: 107.288
Open: 107.304
% chg. over the last day: +0.02
Day’s range: 107.266 – 107.481
52 wk range: 104.97 – 114.56
The USD / JPY currency pair stabilized after a sharp decline last week. The technical picture is ambiguous. At the moment, the USD / JPY quotes are consolidating. Local levels of support and resistance are: 107.250 and 107.500, respectively. The yen has the potential for further growth against the US dollar. We recommend to pay attention to the dynamics of the yield of US government securities. Positions must be opened from key levels.
The Economic News Feed for 24.06.2019 is calm.
The indicators do not provide precise signals, the price has crossed 50 MA.
The MACD histogram is close to 0. There are no signals.
The Stochastic Oscillator is in the overbought zone, the %K line is crossing the %D line. There are no signals.
Trading recommendations
Support levels: 107.250, 107.000
Resistance levels: 107.500, 107.700, 107.850
If the price fixes below 107.250, expect further descend towards 107.000-106.800.
Alternatively, the quotes can grow towards 107.800-108.000.
Canaccord Genuity explained in a report its reasons for severely reducing its target price on this cobalt company post offer.
In a June 18 research note, analyst Eric Zaunscherb reported that Canaccord Genuity reduced its target price on Cobalt 27 Capital Corp. (KBLT:TSX.V; CBLLF:OTC; 27O:FSE) by about 68% to CA$5 per share from CA$15.50 due to the proposed acquisition of the company’s main assets by Pala Investments and due to the related switch in the basis for valuing the company.
Zaunscherb commented that the deal is a good one for Pala and it is unlikely another entity will make a better offer. Pala agreed to buy 100% of Cobalt 27’s issued and outstanding common shares for about CA$501 million. In return, it will gain Cobalt 27’s 2,900 tons of refined cobalt metal in bonded warehouses, its cobalt stream on Vale’s Voisey’s Bay nickel-cobalt mine as of 2021 and its debt.
As part of the arrangement, a newly listed entity called Nickel 28 Capital Corp. will be formed to hold an 8.56% direct participating interest in the operating Ramu nickel-cobalt mine, along with an array of exploration and development project royalties, several minor equity interests and $5 million in cash, noted Zaunscherb.
The current spot price for cobalt is around $15 per pound. In comparison, the cobalt price in Canaccord Genuity’s deck is at least $33 per pound, Zaunscherb pointed out, reflecting an expected pricing rebound as artisanal miners in the Democratic Republic of the Congo back off producing at the low prices and as electric vehicle and energy storage system sales increase demand.
With the Cobalt 27 acquisition, Zaunscherb highlighted, “Pala’s offer crystalizes this upside at these low levels, and therefore, the financial services firm switched to using the cobalt spot price in its valuation, thus lowering its target price on Cobalt 27 significantly.
“In other words,” the analyst explained, “our previous target captured the impact of a rebound in cobalt prices over the next 12 months while the revised target reflects cash in hand plus the stub shareholding in a nickel vehicle.”
Despite the reduced target price, Canaccord Genuity maintains its Speculative Buy rating on Cobalt 27, which “reflects a 15% projected return and the slim outside chance of an alternative bid surfacing,” Zaunscherb noted.
Disclosure: 1) Doresa Banning compiled this article for Streetwise Reports LLC and provides services to Streetwise Reports as an independent contractor. She or members of her household own securities of the following companies mentioned in the article: None. She or members of her household are paid by the following companies mentioned in this article: None. 2) The following companies mentioned in this article are billboard sponsors of Streetwise Reports: None. Click here for important disclosures about sponsor fees. 3) Comments and opinions expressed are those of the specific experts and not of Streetwise Reports or its officers. The information provided above is for informational purposes only and is not a recommendation to buy or sell any security. 4) The article does not constitute investment advice. Each reader is encouraged to consult with his or her individual financial professional and any action a reader takes as a result of information presented here is his or her own responsibility. By opening this page, each reader accepts and agrees to Streetwise Reports’ terms of use and full legal disclaimer. This article is not a solicitation for investment. Streetwise Reports does not render general or specific investment advice and the information on Streetwise Reports should not be considered a recommendation to buy or sell any security. Streetwise Reports does not endorse or recommend the business, products, services or securities of any company mentioned on Streetwise Reports. 5) From time to time, Streetwise Reports LLC and its directors, officers, employees or members of their families, as well as persons interviewed for articles and interviews on the site, may have a long or short position in securities mentioned. Directors, officers, employees or members of their immediate families are prohibited from making purchases and/or sales of those securities in the open market or otherwise from the time of the interview or the decision to write an article until three business days after the publication of the interview or article. The foregoing prohibition does not apply to articles that in substance only restate previously published company releases.
Disclosures from Canaccord Genuity, Cobalt 27 Capital Corp., June 18, 2019
Analyst Certification: Each authoring analyst of Canaccord Genuity whose name appears on the front page of this research hereby certifies that (i) the recommendations and opinions expressed in this research accurately reflect the authoring analysts personal, independent and objective views about any and all of the designated investments or relevant issuers discussed herein that are within such authoring analyst’s coverage universe and (ii) no part of the authoring analysts compensation was, is, or will be, directly or indirectly, related to the specific recommendations or views expressed by the authoring analyst in the research.
Analysts employed outside the US are not registered as research analysts with FINRA. These analysts may not be associated persons of Canaccord Genuity Inc. and therefore may not be subject to the FINRA Rule 2241 and NYSE Rule 472 restrictions on communications with a subject company, public appearances and trading securities held by a research analyst account.
The authoring analysts who are responsible for the preparation of this research have received (or will receive) compensation based upon (among other factors) the Investment Banking revenues and general profits of Canaccord Genuity. However, such authoring analysts have not received, and will not receive, compensation that is directly based upon or linked to one or more specific Investment Banking activities, or to recommendations contained in the research.
Required Company-Specific Disclosures (as of date of this publication) Cobalt 27 Capital Corp. currently is, or in the past 12 months was, a client of Canaccord Genuity or its affiliated companies. During this period, Canaccord Genuity or its affiliated companies provided investment banking services to Cobalt 27 Capital Corp.
In the past 12 months, Canaccord Genuity or its affiliated companies have received compensation for Investment Banking services from Cobalt 27 Capital Corp.
In the past 12 months, Canaccord Genuity or any of its affiliated companies have been lead manager, co-lead manager or co-manager of a public offering of securities of Cobalt 27 Capital Corp. or any publicly disclosed offer of securities of Cobalt 27 Capital Corp. or in any related derivatives.
Canaccord Genuity or one or more of its affiliated companies intend to seek or expect to receive compensation for Investment Banking services from Cobalt 27 Capital Corp. in the next three months.
After the incredible week we’ve seen, with the Fed leaving rates unchanged and precious metals rocketing higher above their previous five-year highs, it’s time we pay attention to what’s happening in the financial sector and the US stock market majors. Closing out this week, we heard all traders and investors pay very close attention to the US dollar, precious metals, and the US major indexes.
There are a number of major factors taking place throughout the world that will likely drive future price trends over the next 30 to 60 days. Tensions in the Middle East, debt issues in China and Europe, central bank actions throughout the world and the US, and the ultimate driver of price moves – fear and greed. We’ve mentioned to a number of associates recently that our research focuses on the transition of traders from fear into greed. Our belief is that as traders begin to fear certain events or price trends, the price action tends to become more volatile. As this volatility increases and trends accelerate, traders transition this fear into greed where they attempt to take advantage of opportunities generated by large price swings.
We believe the global markets are entering a fear cycle populated by many of the issues and uncertainties we mentioned above. The fact that a number of unsettled, and potentially dangerous, global economic and political issues are taking place increases the fear component in the markets. This increased fear, and combination with increased volatility, will transition into increased greed as price trends accelerate.
This XLF weekly chart, below, highlights a price pattern formation, the Pennant/Flag formation, that we believe is nearly complete. This price formation is setting up an apex pattern that should complete near July 12 through July 20. It is very likely that a breakout or break down price reaction will take place before July 20. Our researchers believe the dominant price trend of the breakout will be to the downside and that a possible 15 to 25% downside price move in the financial sector is likely.
This type of downside price rotation would likely push price lower, towards the November/December 2018 lows before finding support.
This Goldman Sachs weekly chart highlights a similar price pattern as the XLF above. When we see these types of patterns across multiple charts, it lends credibility to the overall analysis and research we are conducting. In other words, when we see the same thing setting up across multiple charts it becomes almost impossible to misinterpret. Please pay special attention to the Fibonacci projected target levels, the extended lines, and colored squares to the right of prices, to understand the type of volatility that is currently within the markets.
When volatility is narrow, price expansion or contraction is also fairly narrow. When volatility is excessive, price expansion or contraction is also labeled as excessive. Currently, in all of these charts, we are seeing price volatility, based on our proprietary Fibonacci price modeling system, in the range of 10% to 20% or more.
Our researchers believe the markets are setting up for a breakdown price swing, potentially retesting lows near November/December 2018, and shaking out the markets. It is very common for the US stock market to experience price volatility and downwards price trends 8 to 20 months prior to a US Presidential election. We’ve authored a number of articles regarding this phenomenon. As we move closer to the actual election date, prices tend to stabilize an advance as outcomes and policies become more clear.
We believe a breakdown in the financial sector, as well as the US stock market, could only be a few weeks away. Our longer-term super cycle analysis suggests a possible peak in August or early September 2019. You can see from this SPY weekly chart, below, the SPY has already reached new all-time high again.
Given the dates of our super cycle research and the near completion of these pennant/flag formations, we believe the next 4 to 7 weeks of trading could be extremely volatile and attempt to create a very short term sideways flag formation on the daily charts that will prompt our price peak near the end of August or early September.
Any price breakdown in the US stock market will prompt a price anomaly pattern to set up where the price will move away from historical and predictive price ranges, base after finding support, then rally back towards new all-time highs again. Therefore, much like November/December 2018, we believe the downside rotation we are expecting after the breakout of the pennant/flag formation will react in a similar manner. We believe the next 3 to 5 weeks could be full of volatile sideways price rotation, ultimately attempting a new washed out price high in the SPY, ES, and DOW (possibly above the psychological level of $300, $3000 or $30,000) followed by an immediate -12 to -18% downside price move.
Ultimately, based on our research, the downside price move could be in excess of -20 to -25% or more. We believe the December 2018 lows will likely hold as ultimate support. Yet the reality of price volatility is that any fear/greed price swing could move well beyond these lows while attempting to hammer out a bottom.
We urge all traders to be very cautious over the next 3 to 5 weeks. Ultimately, this upside price swing will likely end near the psychological levels we’ve suggested and, as fear turns into greed, price rotation will likely push the global markets dramatically lower starting sometime in August or September 2019. This means we have about 5 to 7 weeks of volatile sideways trading near a pennant/flag apex that will likely result in large price rotation and the set up of a shorter-term pennant/flag formation on Daily charts. We believe this short-term pennant/flag formation set up will create the ultimate peak in late August or early September and prompt the larger downside move we are expecting.
Skilled traders will not get married to their long positions or short positions until this washout volatility is completed and tends really begin to take shape. Our advice to skilled traders is to expect some increased volatility, some wild price rotation, and a shakeout new-high, new-low type price formation (setting up the new short-term pennant/flag pattern) over the next few weeks. This is really becoming more of a traders market where short-term targets and trades will be keys to success. Longer-term trends and trend following systems will likely get chewed up over the next 45 to 65+ days.
Our super cycle research has given us a very clear picture as to what to expect over the next 24 months or longer.
I am going to give away and ship out silver rounds to anyone who buys a 1-year, or 2-year subscription to my Wealth Trading Newsletter. You can upgrade to this longer-term subscription or if you are new, join one of these two plans listed below, and you will receive:
The potential impact on the company of likely macroeconomic tailwinds are discussed in a Raymond James report.
In a June 19 research note, analyst Pavel Molchanov reported that Raymond James downgraded its recommendation on SunPower Corp. (SPWR:NASDAQ) to Market Perform from Outperform following the stock’s year-to-date 104% jump. The previous target price was $9 per share, and the share price currently is around $10.34. Raymond James does not have a current target price on SunPower.
Also noteworthy is that, looking forward, SunPower will likely face some macroeconomic tailwinds, Molchanov highlighted. They include the upcoming incremental decrease in the federal Investment Tax Credit (ITC) that will likely cause demand pullback as it plays out, affecting distributed, or commercial and residential, deployments the most. Starting in 2020, the ITC will drop from 30% to 10% for commercial and to 0% for residential.
There also is the probability of renewed price pressure on photovoltaic (PV) modules, Molchanov pointed out, as Chinese competitors continue to capture market share and the Section 201 tariff phases out, from 25% today to 20% in 2020, 15% in 2021 and zero subsequently. The latter will diminish the pricing advantage that SunPower and other tariff-exempt companies had.
However, SunPower “has a solid position due to its status as an integrated player, including leverage to distributed PV and battery storage, both being themes that we like,” Molchanov noted. It also has the “added bankability advantage of having the energy giant Total as a ‘big brother.'”
Disclosure: 1) Doresa Banning compiled this article for Streetwise Reports LLC and provides services to Streetwise Reports as an independent contractor. She or members of her household own securities of the following companies mentioned in the article: None. She or members of her household are paid by the following companies mentioned in this article: None. 2) The following companies mentioned in this article are billboard sponsors of Streetwise Reports: None. Click here for important disclosures about sponsor fees. 3) Comments and opinions expressed are those of the specific experts and not of Streetwise Reports or its officers. The information provided above is for informational purposes only and is not a recommendation to buy or sell any security. 4) The article does not constitute investment advice. Each reader is encouraged to consult with his or her individual financial professional and any action a reader takes as a result of information presented here is his or her own responsibility. By opening this page, each reader accepts and agrees to Streetwise Reports’ terms of use and full legal disclaimer. This article is not a solicitation for investment. Streetwise Reports does not render general or specific investment advice and the information on Streetwise Reports should not be considered a recommendation to buy or sell any security. Streetwise Reports does not endorse or recommend the business, products, services or securities of any company mentioned on Streetwise Reports. 5) From time to time, Streetwise Reports LLC and its directors, officers, employees or members of their families, as well as persons interviewed for articles and interviews on the site, may have a long or short position in securities mentioned. Directors, officers, employees or members of their immediate families are prohibited from making purchases and/or sales of those securities in the open market or otherwise from the time of the interview or the decision to write an article until three business days after the publication of the interview or article. The foregoing prohibition does not apply to articles that in substance only restate previously published company releases.
Disclosures from Raymond James, SunPower Corp., June 19, 2019
ANALYST INFORMATION
Analysts Holdings and Compensation: Equity analysts and their staffs at Raymond James are compensated based on a salary and bonus system. Several factors enter into the bonus determination, including quality and performance of research product, the analyst’s success in rating stocks versus an industry index, and support effectiveness to trading and the retail and institutional sales forces. Other factors may include but are not limited to: overall ratings from internal (other than investment banking) or external parties and the general productivity and revenue generated in covered stocks.
The analyst Pavel Molchanov, primarily responsible for the preparation of this research report, attests to the following: (1) that the views and opinions rendered in this research report reflect his or her personal views about the subject companies or issuers and (2) that no part of the research analyst’s compensation was, is, or will be directly or indirectly related to the specific recommendations or views in this research report. In addition, said analyst(s) has not received compensation from any subject company in the last 12 months.
RAYMOND JAMES RELATIONSHIP DISCLOSURES Certain affiliates of the RJ Group expect to receive or intend to seek compensation for investment banking services from all companies under research coverage within the next three months.
Raymond James & Associates, Inc. makes a market in the shares of SunPower Corporation, Enphase Energy, Inc. and TPI Composites, Inc.
Raymond James & Associates or one of its affiliates owns more than 1% of the outstanding shares of TPI Composites, Inc.
Additional Risk and Disclosure information, as well as more information on the Raymond James rating system and suitability categories, is available here.
There’s an air of caution in the markets at the start of a week that’s bookended by new US sanctions on Iran and the meeting between US President Donald Trump and Chinese President Xi-Jinping. Asian stocks are seeing a mixed Monday morning, while futures for the S&P 500 remain steady, indicating that equity bulls are losing some momentum ahead of a crucial catalyst for risk sentiment.
The outcome from the Trump-Xi meeting promises significant implications for investors who are finalizing their outlooks for the second half of 2019. Markets are expecting to see whether the US-China brinkmanship will give way to a truce that could ease trade tensions, or if markets will still have to contend with the protracted standoff over the coming months.
While the Trump-Xi meeting is a meaningful step towards de-escalating tensions, markets could also be left disappointed if the high-stakes meeting yields naught, leaving the status quo of the heightened conflict intact. Such a risk suggests that investors would want to avoid getting ahead of themselves in anticipating a market-friendly outcome from the meeting.
Oil jumps on new US sanctions on Iran
Both Brent and WTI are climbing by over 0.6 and 0.8 percent respectively at the time of writing, after President Trump tweeted about placing “major additional sanctions on Iran” on Monday. This is stoking market concerns that heightened geopolitical tensions could ultimately weigh on the global supply of Oil. In the meantime, energy stocks in Japan and Australia are climbing higher, contrasting the losses in their respective benchmark equity indices.
Oil’s recent surge frames the OPEC+ meeting next week, as Oil producers face the delicate task of rebalancing Oil markets. While rising geopolitical tensions have been doing the legwork for OPEC+ in sending crude higher, the demand outlook remains plagued by uncertainties surrounding US-China trade tensions, which threatens to be a major drag on Oil consumption through the rest of 2019. Unless there’s a seismic shift in the supply-demand equation this week, the OPEC+ alliance may have little choice but to extend its supply cuts into the second half of the year, which should help support Oil prices.
Gold to remain support amid global uncertainties
Gold’s stay above the psychological $1400 mark highlights the cautionary tone across various asset classes on Monday. Rising geopolitical tensions as well as the uncertainty over the US-China standoff ensure that safe haven assets remain in a supportive environment for the time being.
While it’s hard to imagine US-led tensions melting away rapidly in the immediate-term, recent history has only demonstrated that the geopolitical landscape remains highly fluid and can turn on a dime. Still, any potential declines in Gold triggered by de-escalating in tensions over the near-term should be mitigated by the expressed easing bias out of major central banks.
Disclaimer: The content in this article comprises personal opinions and should not be construed as containing personal and/or other investment advice and/or an offer of and/or solicitation for any transactions in financial instruments and/or a guarantee and/or prediction of future performance. ForexTime (FXTM), its affiliates, agents, directors, officers or employees do not guarantee the accuracy, validity, timeliness or completeness, of any information or data made available and assume no liability as to any loss arising from any investment based on the same.