By CentralBankNews.info Kyrgyzstan’s central bank left its benchmark discount rate steady at 4.25 percent, citing the positive dynamics of aggregate demand and low inflation risks from foreign markets, with inflation in the medium term expected to approach the bank’s target range of 5 – 7 percent. The decision to maintain the rate comes after the National Bank of the Kyrgyz Republic (NBKR) cut its rate twice this year, most recently in May, and seven times since March 2016. Since March 2016 the discount rate has been cut by 575 basis points. As in May, NBKR said it may consider changing the current direction of its monetary policy “in the case of risks in the internal and external environment.” The central bank said inflation as of June 14 rose to 0.9 percent as the prices of fruits and vegetables recovered, up from 0.1 percent in May following deflation in the previous three months. NBKR said it maintained its forecast for inflation to be 4.0 percent year-on-year at the most by December and average 1.0 percent in the absence of shocks. Economic growth is also continuing, with real gross domestic product up 5.6 percent in the first 5 months of the year and up by 1.5 percent when output from the Kumtor gold mine is excluded.
US stock market ended mostly lower on Monday led by energy stocks as president Trump announced new, ‘hard-hitting’ sanctions on Iran. The S&P 500 slipped 0.2% to 2945.35. Dow Jones industrial however added 0.03% to 26727.54. The Nasdaq composite slid 0.3% to 8005.70. The dollar weakening slowed: the live dollar index data show the ICE US Dollar index, a measure of the dollar’s strength against a basket of six rival currencies, lost 0.2% to 96.00 and is lower currently. Futures on US stock indices point to lower openings today.
DAX 30 underperforms European indexes
European stocks pullback continued on Monday . GBP/USD turned lower while EUR/USD continued climbing with both pairs higher currently. The Stoxx Europe 600 index slid 0.3% led by auto shares as Daimler lost 4% after 2019 earnings outlook downgrade. The DAX 30 fell 0.5% to 12274.57 after the Ifo Institute for Economic Research on reported German business sentiment fell to its lowest level since November 2014. France’s CAC 40 edged down 0.1% and UK’s FTSE 100 slipped 0.1% to 7416.69.
Hang Seng leads Asian indexes pullback
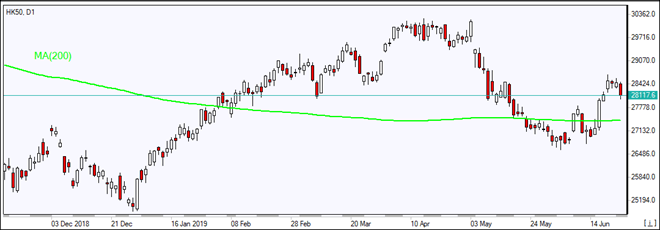
Asian stock indices are mostly falling today despite news US Trade Representative Robert Lighthizer and China’s Vice Premier Liu He talked Monday by phone. Nikkei closed 0.4% lower at 21193.81 with yen resuming its climb against the dollar. Markets in China are retreating: the Shanghai Composite Index is down 0.9% and Hong Kong’s Hang Seng Index is 1.3% lower. Australia’s All Ordinaries Index pulled back 0.1% as Australian dollar resumed sliding against the greenback.
Brent futures prices are extending losses today with Middle East tension providing support. Prices fell yesterday: August Brent crude lost 0.5% to $65.20 a barrel on Monday.
Note: This overview has an informative and tutorial character and is published for free. All the data, included in the overview, are received from public sources, recognized as more or less reliable. Moreover, there is no guarantee that the indicated information is full and precise. Overviews are not updated. The whole information in each overview, including opinion, indicators, charts and anything else, is provided only for familiarization purposes and is not financial advice or а recommendation. The whole text and its any part, as well as the charts cannot be considered as an offer to make a deal with any asset. IFC Markets and its employees under any circumstances are not liable for any action taken by someone else during or after reading the overview.
What happens to the gold price this week will likely set the trend for the foreseeable future. While many precious metals investors disregard technical analysis and key chart formations, you can bet your bottom dollar that large traders and institutions are watching the price action of the yellow metal quite carefully. And if you think that these large traders and institutions don’t believe in market intervention, then you are sadly mistaken.
The entire market is rigged, so we should get past the notion that only the gold and silver prices are controlled. Furthermore, one of the reasons that the gold and silver prices have languished over the past 5+ years has to do with the “Grand Trading Market Casino.” For example, one of the new trendy stocks is ROKU.
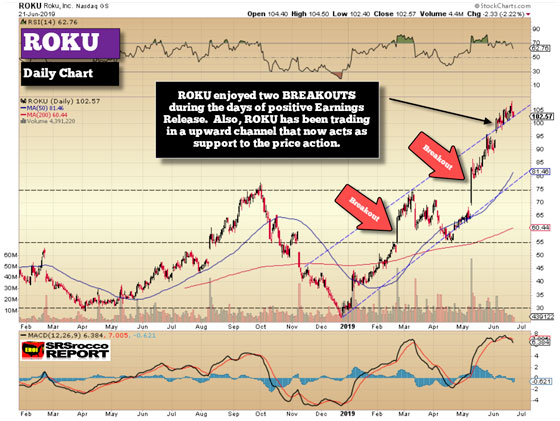
ROKU, a TV streaming platform company, has seen its stock price surge from $26 to $105 over the past six months. That’s a 300% increase from the December 2018 lows. Why would anyone want to mess around with gold, that may go up or down 5-10%, when you can make triple-digit gains on ROKU?
As we can see, ROKU enjoyed two extensive BREAKOUTS during the days of positive earnings release. When these positive earnings releases occurred at key technical levels, the stock price shot up 15-20% in a single day. You will also notice how ROKU is trading off the upward blue channel (blue dashed lines). There is no coincidence that ROKU is trading this way.
Moreover, ROKU is trading close to 10 million shares a day, the same as the GLD ETF. So, traders, hedge funds, and institutions are focusing on stocks like ROKU because the share price action is providing excellent returns in a very short period of time. It doesn’t matter that the markets are rigged, or that central banks are providing trillions of dollars of liquidity. What matters to those who play in these markets, are the NICE RETURNS that can be made in the “Grand Market Casino.”
While ROKU’s stock is certainly hitting all-time highs, the company still hasn’t made a profit in the past four years. Of course, Wall Street analysts say not to worry because it will take the company 5+ years to be profitable. But what if that fifth or sixth year takes place during the next big recession?? Just look what happened to ROKU’s stock from October to Dec 24th, 2018. Do you honestly believe ROKU’s financials and revenues fell that much to push the stock down by 65% in three months?? No, ROKU’s share got BUSHWACKED because the entire market was in freefall. That is, until the central banks came to the rescue.
Unfortunately, for many investors, ROKU is just another high-tech over-valued stock that will crash along with the markets when the lousy economic fundamentals finally kick in.
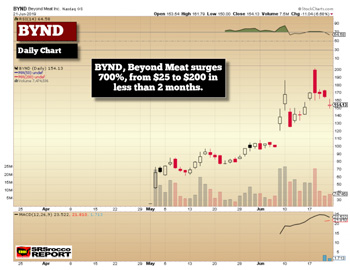
And what about the recent IPO of Beyond Meat (BYND)? The stock price opened at $25 on May 2nd and reached $200 on June 19th, less than two months later. Talk about a COOL 700% return in a lousy seven weeks. Again, why on earth would investors pay attention to the precious metals market when they can get rich on stocks like ROKU and BYND??
These crazy stock prices become even more insane when we compare them to “Real companies.” How does Beyond Meat’s present stock price of $154, based on Q1 2019 total revenues of pitiful $40 million compare to Tyson Foods trading at $79 a share with $40 billion in Q1 2019 revenues? Where is the fundamental logic behind Beyond Meat’s valuation???? There isn’t any. But, the flow of funds focused on high-flying stocks in the market keep investors from paying much attention to gold… up until now.
So, getting back to gold. The problem with many precious metals investors is that they don’t believe technical analysis works in a rigged market. What they fail to understand is that most participants in the market realize that central bank intervention is taking place. It’s not a state secret any more.
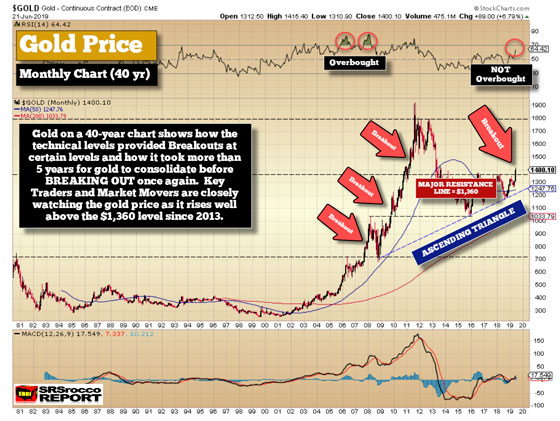
However, there is some METHOD to the MADNESS when it comes to the gold price action over the past 40 years. Here is a monthly chart of the gold price going back until 1981:
Now, there is no coincidence that gold enjoyed a nice BREAKOUT in 2007 when it finally surpassed the long-term $700+ resistance level. And then when gold surpassed the $1,000 level, it had another BREAKOUT to $1,400. Of course, there were important “Fundamental factors” that pushed gold above that $700 level, but when it finally surpassed it, it shot up to $1,000 quite quickly.
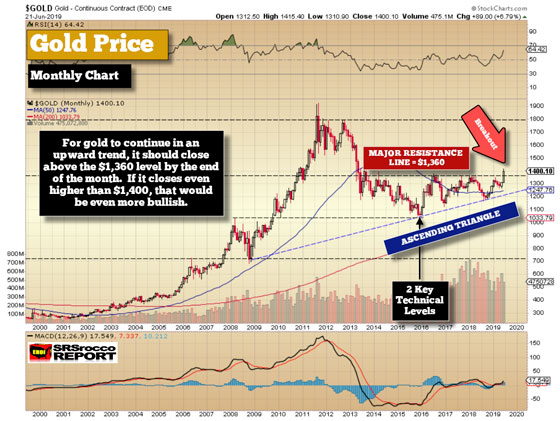
If we look at the 20-year gold monthly chart, we can see some interesting trends:
After gold surged to $1,900, like with all stocks, it experienced a typical correction. Normally, stocks will correct back down to prior support-resistance levels. After gold fell back to the $1,350-$1,360 level in 2013, it continued lower to $1,050. Now, once again, there is no coincidence that the gold price bottomed at $1,050 in late 2015 right at the very same level it that peaked in 2008. You can see that black dashed line at $1,050. Furthermore, the Ascending Triangle baseline (blue dashed line) was another bottoming area for gold when both key technical levels converged.
However, the technical $1,050 level where gold bottomed was also based on fundamental data on the gold production cost. At that time, the top gold miners were producing gold at $1,025-$1,100 an ounce. The declining production gold cost was due to the oil price falling to a low of $26 from a high of $110 in 2011. So, technical analysis in the chart also provided a clue as to the bottom in the gold price.
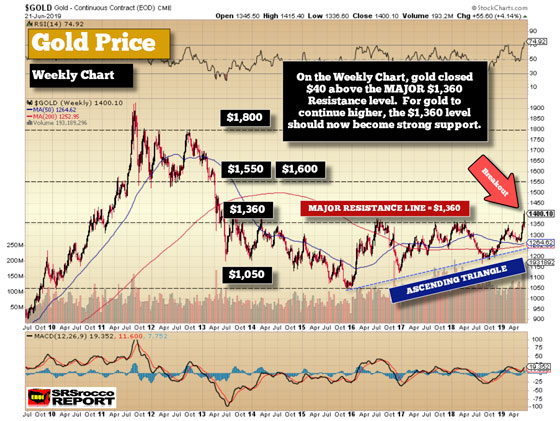
If we look at the weekly gold chart, we can see the Key Technical levels:
It has been more than five years since the gold price reached $1,400. So, it’s an important milestone. According to gold’s price action, the important technical levels are $1,050, $1360, $1,550 (or $1,600), and $1,800. There is a reason the gold price has traded off these technical levels. Traders and institutions are trained to use these technical levels as a guide.
So, are the central banks using these technical levels to control the gold price? Likely. However, when the fundamentals of the market get to the point where the central banks are no longer able to keep the gold price capped under a certain level, like the Fed announcing interest rate cuts, then the traders, hedge funds, and institutions in the market take over. And when the gold price surpasses certain key technical levels, then BREAKOUTS occur.
IMPORTANT NOTE: Years ago, I did not pay attention to Technical Analysis, so I did not understand the value of these key technical levels or how to spot them. Even though gold will become one of the best assets to own in the future, its price rise will likely take place at these key technical levels, regardless if precious metals investors believe it or not.
For gold to continue a BULLISH TREND, it will need to close above the $1,360 level at the end of the month, shown in the top two charts. If it closes below that $1,360 level, then it will just take more time for the trend to push above that level for an extended period. But, if we do see continued buying of gold next week, then we will likely be in a new Bull Market for gold.
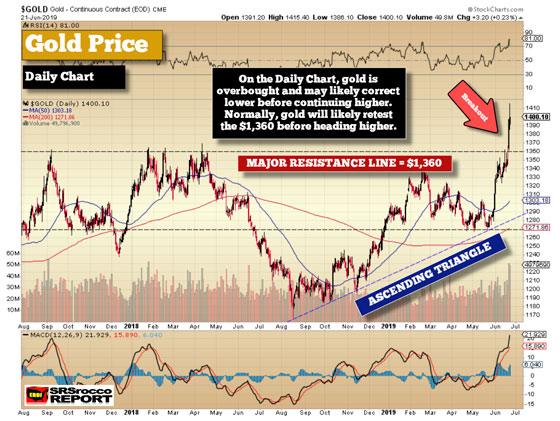
The last chart is the Gold Daily Chart. It clearly shows how gold shot above that critical $1,360 level:
While gold is overbought on the Daily chart (shown at the top right part of the chart, 81 RSI), it isn’t on the first Monthly gold chart above. Even if the gold price falls to the $1,370-$1,380 range by the end of the week, that could still be a positive sign, because it’s still above the key $1,360 by the end of the month.
If we continue to see more “Iran War News” in the media this week, the gold price may head to the $1,410-$1,425+ level. Regardless, for gold to finally break above its 5-year $1,360 is a crucial milestone for traders and investors. A significant close above $1,360 for June could be very Bullish for the yellow metal.
Lastly, if we do see gold close above the key level and move higher in July, it will likely retest the $1,360 level before doing so. Then look for the next technical level of $1,550-$1,600 for gold to find serious resistance.
In conclusion, technical analysis provides traders, hedge funds, and institutions, key levels to focus on. When these technical levels are breached, either to the upside or downside, then we can see significant movement in the price action. So, for gold to head to $2,000 and higher, it will likely do so in and around these key technical levels.
The Money Metals News Service provides market news and crisp commentary for investors following the precious metals markets.
The main event for Forex markets this week will be the G20 summit which gets underway in Japan on Thursday.
President Trump and Chinese leader Xi Jinping are scheduled to meet alongside the event. In the wake of the recent escalation in the US/China trade war, this has taken on fresh importance.
Trump Shocks The Market
In May, Donald Trump shocked markets when he announced that 10% tariffs on $200 billion of Chinese goods had been increased to 25%. The announcement came despite prior expectations that the two countries were close to agreeing on a deal on trade.
However, Trump said that the tariffs were a consequence of China taking too long to sign a deal and for allegedly backpedaling on negotiations. China responded in kind by raising 25% tariffs on $60 billion of US goods, adding that it would not “back down” to what it calls unfair US practices.
Tensions Boil Over
Following the tariff increases, tensions then increased further. Trump announced his addition of Chinese tech giant Huawei to the “Entity List”. This is a list of 44 Chinese companies prohibited from dealing with US firms unless they get prior government approval.
Following this move, China then rocked markets by suggesting that it could place restrictions on rare earths exports. These materials are used in many high tech applications and could pose a huge threat to the US economy if restricted.
Will We See A Truce?
The two leaders are due to discuss a range of topics at the meeting later in the week. But the main issues will be that of the blocking of Huawei and other Chinese companies, and of course, the trade tariffs.
Following China’s retaliatory tariffs, Trump threatened to tariff the remaining $300 billion of Chinese goods entering the US. Forex traders will now be hoping for a repeat of the last G20 meeting in November, where the two leaders were able to strike a compromise. This time, though, the compromise should aim to put an end to the trade war.
Powell Under Pressure
The escalation in tariffs has also taken a toll on central banks.
The Fed, which had been following a program of gradual policy tightening, has recently shifted its view. It is now signaling potential easing to come later in the year. Citing the negative impact of Trump’s trade war, Fed chairman Powell told markets that many policymakers now feel that some level of easing will be necessary in the coming months.
Indeed, the Fed chairman has been under a great deal of pressure over the year from Donald Trump. The President has constantly criticized him and called for lower rates. With China’s central bank easing further over the year, Trump has cited the need for the US central bank to ease in order to allow the President’s trade war to continue.
Technical Perspective
The prospect of fresh easing from the Fed and the subsequent weakness in USD has seen gold prices exploding higher over recent sessions. XAUUSD is now trading at levels not seen since 2013 after breaking out above the 1391.17 level. While above here, focus is on a further push higher targeting the 1432.21 level next. To the downside, any drop lower should find support into the 1366.09 level, keeping focus on a further move higher.
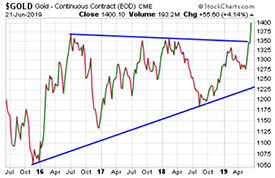
Gold prices have broken out of a massive multi-year consolidation pattern to the upside. That suggests the possibility of a massive multi-year rally ahead!
To be sure, there is also the possibility of some retracing and back-testing this summer before the $1,400 level is conquered for good.
The fall and winter periods are typically more conducive to big precious metals rallies.
Seasonality, however, isn’t a dependable trading tool. Some technical analysts (who will go unnamed here) wrongly turned bearish on gold and gold stocks after they put in a disappointing early spring performance and were thought to be headed straight into the summer doldrums.
Instead, the summer solstice arrived with gold’s chart displaying a powerfully bullish long-term setup.
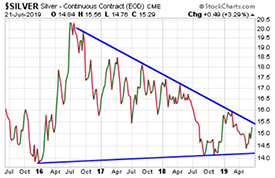
The one glaring problem with the current setup in precious metals markets: silver hasn’t yet confirmed gold’s breakout.
Silver needs to break above $15.50, then $16.00 (the last intermediate cycle high) in order to establish a bullish trend on par with gold’s.
The white metal’s lagging price performance in recent months has resulted in it trading at its biggest discount to gold in three decades.
Hardy silver bugs are excited at this rare opportunity to buy more ounces on the cheap. Others are understandably concerned that silver isn’t showing any leadership during rallies in the metals sector.
Silver, being a smaller and naturally more volatile market than gold, is supposed to amplify gold’s moves on both the upside and downside. So why is silver instead acting like an anemic version of gold?
Lots of reasons can be proffered – from record central bank buying of gold, to silver’s reliance on industrial demand, to low (official) inflation, to market manipulation.
It probably comes down largely to investor psychology. When precious metals markets have been out of the “mainstream” news cycle for years – trumped by a rising stock market and the rise of digital currencies – the general public won’t be interested in precious metals.
The super-rich and large institutional investors who are more apt to take contrarian positions in overlooked assets generally prefer gold over silver because it is more convenient for them to accumulate in large quantities.
We are still in the stealth phase of a precious metals bull market. When we enter the public participation phase – and demand for physical bullion increases – we have no doubt that silver will shine.
The Money Metals News Service provides market news and crisp commentary for investors following the precious metals markets.
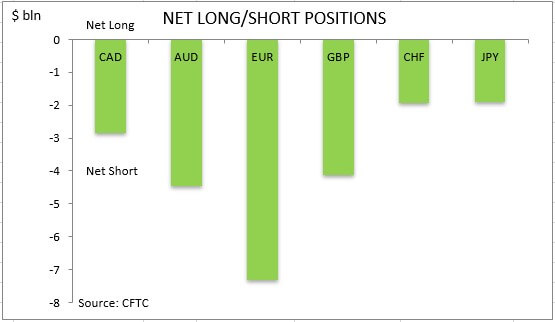
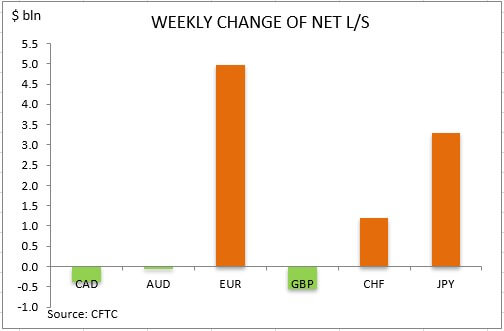
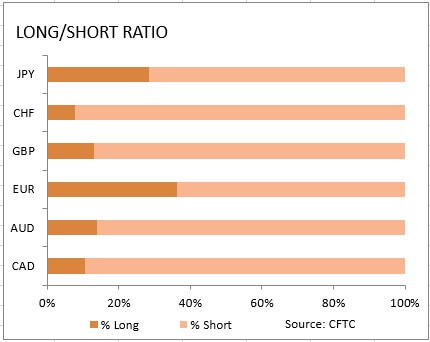
US dollar net long bets fell significantly to $22.60 billion from $31.05 against the major currencies during the one week period, according to the report of the Commodity Futures Trading Commission (CFTC) covering data up to June 18 and released on Friday June 21. The dollar weakening accelerated after weak inflation report showed the cost of living increase over the past 12 months slowed to 1.8% from 2% and retail sales growth was slower than expected.
Note: This overview has an informative and tutorial character and is published for free. All the data, included in the overview, are received from public sources, recognized as more or less reliable. Moreover, there is no guarantee that the indicated information is full and precise. Overviews are not updated. The whole information in each overview, including opinion, indicators, charts and anything else, is provided only for familiarization purposes and is not financial advice or а recommendation. The whole text and its any part, as well as the charts cannot be considered as an offer to make a deal with any asset. IFC Markets and its employees under any circumstances are not liable for any action taken by someone else during or after reading the overview.
On Friday, peripheral bond yields in Europe took a turn for the worse (that is, they rose).
This came after several prominent analysts pointed to private rhetoric by officials in Rome to say “arrivederci” to the EU.
This isn’t a new development. Italy’s relationship with Brussels is, at best, strained. And given the more nationalist and populous sentiment of the government, a potential ‘Italeave’ is something they at least like talking about.
But, how serious is it? The short answer is not much. But that doesn’t mean it can’t drive markets and move risk profiles that have impacts on the exchange rate.
After all, most people said that Britain seriously wouldn’t leave the EU, either. So, even though there is a really broad consensus that deputy PM Salvini is talking tough to appease his popular support more than anything, many investors are quietly hedging their bets. Hence, the move in the Italian yields.
What’s to be Gained?
The central contention between Brussels and Rome right now is the budget for next year. Specifically how much deficit spending the Italian government is “allowed”. Northern Europe tends to be quite strict when it comes to maintaining a budgetary surplus (known as a “fiscal rule”). Italy has a long history of deficit spending. And they adjust to it by debasing their currency.
The situation makes Italy extra uncomfortable in the euro. There are some substantial arguments for Italy to have its own currency. However, the issue at hand is next year’s budget, in which Italy plans to spend more than the EU’s target. But Italy is not alone, and this is causing extra friction.
Why Just Italy?
France, now the second largest economy in the EU, has an even bigger budget deficit. And it’s largely not being criticized for it as much as Italy.
Salvini has argued that this is unfair. He claims that several other countries in the euro area have budget deficits higher than Italy, yet the third largest economy is the only one being singled out. That being said, Italy is also the only country openly defying the rule.
The EU elections gave something of a boost to the Italian position. With Macron fighting strong popular unrest and losing substantially in the polls, there was a sign that the fiscal rule was unpopular.
The election results saw an erosion of the traditional parties across Europe in favor of populists. Even so, the EU continued to talk tough about Italy, saying that discussion of sanctions for Italy’s budget would happen the first week of July.
Is it Working?
Over the weekend, the London-based Financial Times reported that the EU would hold off on launching disciplinary action against Italy over the budget issue.
How long would that “hold off” last? Well, that’s uncertain, since transparency about the budget dispute hasn’t been a thing.
Given the worsening global situation, and Italy flirting with another technical recession (average GDP growth for the last five quarters has been 0), there is an increasing consensus that European action against Italy would only make the entire situation worse.
According to PM Conte, the EU’s sanctions (called EU Deficit Procedure, or EDP) would include €2.0B in spending cuts. That would likely impede growth in Italy, pushing it back into technical recession or worse. It would also generally inflame the potential populist backlash from the third largest voting block in the EU.
And the Markets?
The markets hate uncertainty. And without a clear resolution to the Rome-Brussels dispute, investors are likely to take a risk-off approach. This means higher yields for Italian debt, also making the budget situation for the country worse. Some relief can come from an ECB rate cut, which might help lower debt service costs for Italy and bring their budget closer to the EU target.
Should the EU confirm that no action will be taken, this likely would be seen as a short term relief by the market ending that particular uncertainty. But, then we have the next problem that it might encourage other EU countries in arrears to also defy Brussels, and have a negative effect in the long term. Either way, keep an eye on peripheral yields to gauge risk sentiment.
The War on Cash isn’t a conspiracy theory. It’s an open agenda. It’s being driven by an alignment of interests among bankers, central bankers, politicians, and Silicon Valley moguls who stand to benefit from an all-digital economy.
Last week, Facebook – in partnership with major banks, payment processors, and e-commerce companies – launched a digital currency called Libra. Unlike decentralized, free-floating cryptocurrencies, Libra will be tied to national fiat currencies, integrated into the financial system, and centrally managed.
Critics warn Libra is akin to a “spy coin.” It’s certainly not for anyone who wants to go off the financial grid.
Many of the companies involved in Libra (including Facebook itself) routinely ban users on the basis of their political views. Big Tech has booted scores of individuals and groups off social platforms for engaging in “far right” speech. If Libra one day becomes the predominant online payment method, then political dissidents could effectively be banned from all e-commerce.
You can still obtain some degree of anonymity in the offline world by using paper cash. But that will become impossible in the cashless future envisioned by bankers.
Last week Bank of America CEO Brian Moynihan touted new developments in digital payment systems while speaking at a Fortune conference. He said, “We want a cashless society…we have more to gain than anybody from a pure operating costs.”
They gain – at the expense of our financial privacy. A cashless society is the end of a long road to monetary ruin that began many decades ago with the abandonment of sound money backed by gold and silver.
The Money Metals News Service provides market news and crisp commentary for investors following the precious metals markets.
EURUSD continues rising. On Monday June 24th, the instrument is mostly trading close to 1.1376. Market players aren’t as active as usual, but it may change in a moment.
The USD still remains under significant pressure after the US Federal Reserve gave very clear signals last week that it was ready to cut the rate in case the country’s economy slowed down. On one hand, it means that the USA are ready to continue its trade wars against China and others and for this purpose they require quite soft monetary policy in the country to avoid any slowdowns in its economy and inflation. On the other hand, the USA don’t need their currency to be strong right now, so they may kill two birds with one stone.
Other members of the FOMC are also saying that it’s the high time to cut the rate, by 50 basis points. Of course, it sounds too negative for the USD.
This week, the macroeconomic calendar is quite empty. As always, all interesting reports at the end of the month are centered on Friday.
As we can see in the H4 chart, after completing the five-wave rising structure, EURUSD is consolidating at its top. Possibly, the pair may form a reversal patterns close to the highs. After breaking 1.1355, the price may start a new descending wave (as a correction) to reach 1.1222. From the technical point of view, this scenario is confirmed by Stochastic Oscillator, as its signal line is trading inside the “overbought area”. To confirm the above-mentioned wave, the indicator must leave the area.
In the H1 chart, EURUSD is consolidating around 1.1375. Possible, the pair may extend the ascending structure towards 1.1394. After reaching this level, the price may start a new decline towards 1.1355 and, as a result, break the ascending channel and start a new wave to the downside with the first target at 1.1305. From the technical point of view, this scenario is confirmed by MACD Oscillator, as its signal line is ready to move downwards and reach 0. After breaking is, the instrument may quicken its decline towards 1.1222.
Disclaimer
Any predictions contained herein are based on the authors’ particular opinion. This analysis shall not be treated as trading advice. RoboForex shall not be held liable for the results of the trades arising from relying upon trading recommendations and reviews contained herein.
The US dollar continued its descent as the index fell for three consecutive days. The declines came about amid the quadruple witching on Friday leading to some outflows in the USD.
Economic data was mixed on the day as existing home sales rose 5.34 million beating estimates. However, Markit’s flash manufacturing and services PMI came out weaker than expected for June.
Euro Rises to 3-Month High
The common currency gained 0.67% on the day on Friday to close at a 3-month high. The gains in the euro were led by a factor of weaker USD and somewhat better than expected regional flash PMI’s. For the eurozone, the combined PMI reading was disappointing. Manufacturing PMI fell to 47.0 while services PMI rose to 53.4. ECB President Draghi was heard informing EU officials about the weakening growth in the eurozone.
Can EURUSD Maintain the Gains?
With the common currency trading flat, for the most part, this year, the recent close above $1.1300 is critical. A continued momentum to the upside could see the euro rising to $1.1400 as the next level. However, there is scope for prices to pull back in the short term. Temporary support is seen near the 1.1339 level which could see price falling back to establish support more firmly. This will eventually signal a reversal that could keep EURUSD on track to test the $1.1400 handle eventually.
WTI Settles Near 3-week High
Crude oil prices maintained the momentum into Friday’s close as price settled near a 3-week high. Price action remained biased to the upside, but the pace of gains was limited compared to the previous days. This came as President Trump was close to ordering an attack on Iran but refrained at the last minute. Investors expect to see diplomacy take the front-seat, adding to easing pressures. Over the weekend, Trump announced fresh sanctions on Iran.
Oil Prices Could Correct in Near Term
Following the rally to the identified resistance level of 57.50, crude oil prices closed with a spinning top pattern on Friday. A bearish follow-through is required today in order to confirm the short-term downside. The lower support is found at 54.24 which could be tested in the near term. A rebound off the 54.24 level could pave the way for oil prices to break past the 57.5 resistance level and aim for the $60 handle.
Gold Rallies to 6-Year High
The precious metal continued its bullish trend, as it closed Friday with 5 consecutive weeks of gains. Gold prices briefly tested highs of $1400 an ounce before retreating back to settle at $1399.29. The gains come as most of the central banks shift to a dovish bias alongside some global uncertainty on trade.
Will Gold Pull Back from the Current Highs?
The XAUUSD could see some form of a pullback in the near term, especially after testing the 1400 level. The immediate lower support is seen at the 1354 handle. Establishing support at this level could keep the bias to the upside. However, following the pullback, gold will need to break past the current highs above 1400 to keep the gains coming. To the downside, a close below 1354 could send gold lower to the 1320 support.