Sharing market analysis and my opinions every day is far from easy and sometimes I feel like a song on repeat. My focus and goal has always been to try to alert fellow traders and investors of what is unfolding now in the financial markets around the globe because it appears we are about to experience another financial life-changing event much like the 2000 stock market top, and the late 2007 bull market top which will play out over the next 24+ months
If you lost money during the last bear market then you need a new game plan to take advantage of falling prices and the solution is not just to by gold, silver, and miners. In fact, you could lose a lot buying and holding them over the next year if you are not careful. We all know what the precious metals sector did during the last equities bear market (they crashed 64% with the stock market before starting to rally).
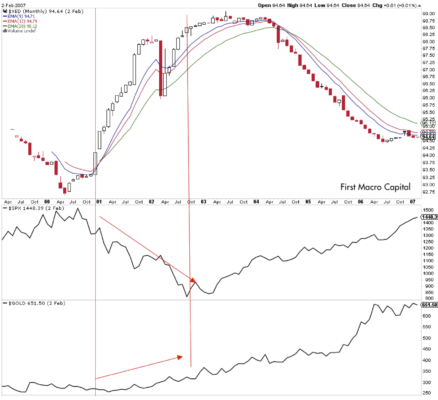
2007 Bull Market Top – SP500 and XAU Gold Miners Index
From a technical analysis standpoint, we are still a long ways away from a confirmed bear market. We do need a see a rather larger drop to break the December low we saw in the SP500 index. But, each month more warning signs pop up to confirm we would be in a full-blown bear market b the end of 2019.
Miners Are Outperforming US Equities – Top Is Near!
Last month I talked about how I have been waiting for gold miners to start outperforming the US stocks market. Once miners start outperforming in a big way (just like we saw in 2007), we know the stock market is topping out and something really bad is about to happen.
In the last couple of weeks, the gold miners index is up over 16% while the SP500 is up only 6%, this feels like the start-of-the-end if you know what I mean.
It’s a known fact that stock market prices lead earnings, news, and the economy. Stock prices start to flatten, chop sideways, and sell off typically 3-6 months or more before negative data starts to become daily headline news.
I have been predicting a top for form since early 2018 with the book I co-authored called “The Crash of 2019 and 2020 – How You Can Profit” only available to subscribers of the Wealth Building Newsletter.
I can tell you that huge moves are about to start unfolding not only in metals, or stocks but globally and some of these super cycles are going to last years. A gentleman by the name of Brad Matheny goes into great detail with his simple to understand guide and charts. His financial market research is one of a kind and a real eye-opener. PDF guide: 2020 Cycles – The Greatest Opportunity Of Your Lifetime
Concluding Thoughts:
In short, the financial markets including commodities move in a wave like pattern and you want to own them and be to long when they are rising, and in cash or sell short (inverse ETF) when they are falling.
As a technical analysis and trader since 1997 I have been through a few bull/bear market cycles, I have a good pulse on the market and timing key turning points for both short-term swing trading and long-term investment capital. The opportunities are massive/life-changing if handled properly.
I urge you visit my Wealth Building Newsletter and if you like what I offer, join me with the 1 or 2-year subscription to lock in the lowest rate possible and ride my coattails as I navigate these financial market and build wealth while others lose nearly everything they own.
As we can see in the H4 chart, USDCAD has tested the support level while trading downwards and formed Hammer reversal pattern. The current situation implies that the reversal pattern and a sideways movement may indicate a possible rebound from the channel’s downside border and a new growth with the target at 1.3400. However, we shouldn’t ignore a possibility that the instrument may break the support level and continue its decline to reach 1.3100.
AUDUSD, “Australian Dollar vs US Dollar”
As we can see in the H4 chart, AUDUSD has formed Shooting Star reversal pattern while testing the channel’s upside border. The current situation implies that the instrument may rebound to resume falling towards 0.6838. However, we shouldn’t ignore a possibility that the instrument may break the level and continue growing to reach 0.7000.
Attention! Forecasts presented in this section only reflect the author’s private opinion and should not be considered as guidance for trading. RoboForex LP bears no responsibility for trading results based on trading recommendations described in these analytical reviews.
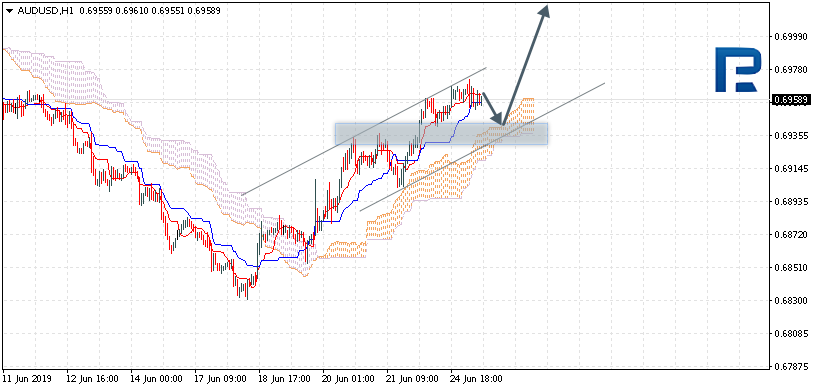
AUDUSD is trading at 0.6958; the instrument is moving above Ichimoku Cloud, thus indicating an ascending tendency. The markets could indicate that the price may test the cloud’s upside border at 0.6940 and then resume moving upwards to reach 0.7025. Another signal to confirm further ascending movement is the price’s rebounding from the channel’s downside border. However, the scenario that implies further growth may be cancelled if the price breaks the cloud’s downside border and fixes below 0.6910. In this case, the pair may continue falling towards 0.6825.
NZDUSD, “New Zealand Dollar vs US Dollar”
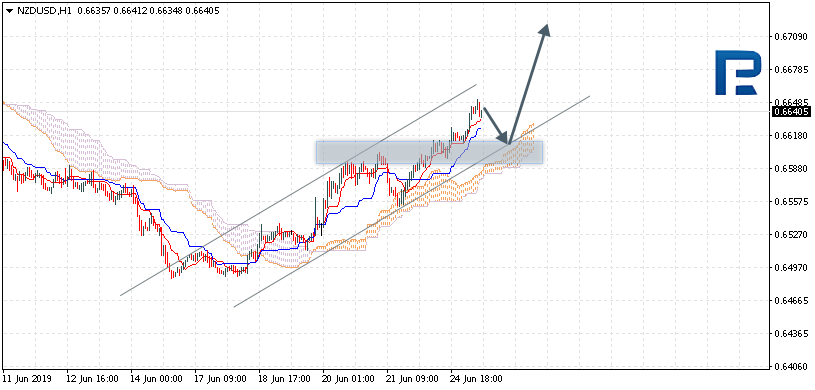
NZDUSD is trading at 0.6640; the instrument is moving above Ichimoku Cloud, thus indicating an ascending tendency. The markets could indicate that the price may test the cloud’s upside border at 0.6615 and then resume moving upwards to reach 0.6710. Another signal to confirm further ascending movement is the price’s rebounding from the support level. However, the scenario that implies further growth may be cancelled if the price breaks the cloud’s downside border and fixes below 0.6575. In this case, the pair may continue falling towards 0.6505.
USDCAD, “US Dollar vs Canadian Dollar”
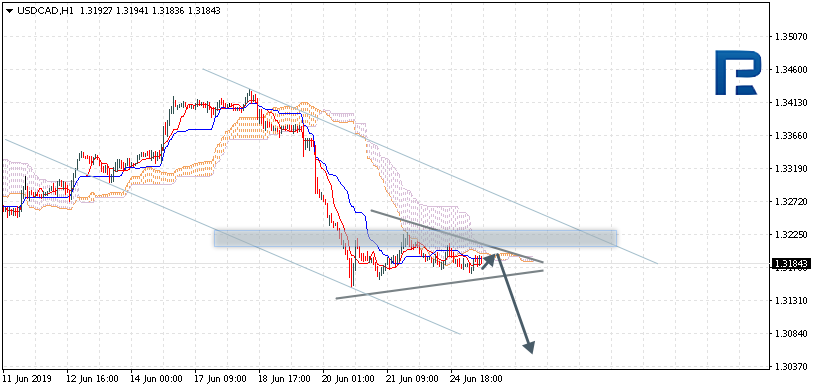
USDCAD is trading at 1.3184; the instrument is moving below Ichimoku Cloud, thus indicating a descending tendency. The markets could indicate that the price may test the cloud’s downside border at 1.3185 and then resume moving downwards to reach 1.3045. Another signal to confirm further descending movement is the price’s rebounding from the resistance level. However, the scenario that implies further decline may be cancelled if the price breaks the cloud’s upside border and fixes above 1.3235. In this case, the pair may continue growing towards 1.3325. After breaking Triangle’s downside border and fixing below 1.3140, the price may continue moving downwards.
Attention! Forecasts presented in this section only reflect the author’s private opinion and should not be considered as guidance for trading. RoboForex LP bears no responsibility for trading results based on trading recommendations described in these analytical reviews.
The US dollar continued to post declines on Monday. Economic data on the day was sparse with only the German Ifo data coming out. President Trump once again brought up the Fed, noting that the central bank should cut rates.
Meanwhile, investors look to this weekend’s G20 summit where Trump and his Chinese counterpart Xi are expected to meet. The markets maintain the hopes that the US and China could still be able to salvage the trade talks.
Euro Tests $1.1400 Handle
The German Ifo business climate report released on Monday saw the index slipping for the third consecutive month. Data showed that the index fell to 97.4 in June compared to 97.9 in May. The data comes on the back of the German Bundesbank signaling that growth could contract in the second quarter of the year. The euro, however, brushed aside the data as it rose to test the $1.1400 handle.
Can the EURUSD Post Further Gains?
The currency pair has been rather bullish over the past week. However, as it approaches the $1.1400 handle, we could expect to see some pullback in price. The near term support is at 1.1339 which could hold any short term declines. Price will need to convincingly close above the 1.1400 handle in order to confirm further upside. The next main target to the upside is at 1.1541.
Oil Holds Steady, Awaiting Further Cues
WTI crude oil prices were trading flat on Monday after last week’s gains. The US administration announced fresh sanctions on Iran, but the market reaction was muted. Meanwhile, the UAE, Saudi Arabia, the UK, and the US issued a warning expressing grave concerns for rising tensions in the Middle East and specifically Iran.
Will Oil Correct Lower?
The commodity closed with a doji pattern for the second consecutive day near the resistance area of 57.50. The breach of the minor trend line indicates a possible downside correction in price. The initial support is seen at the 54.50 handle. If the bearish momentum picks up, oil prices could fall to the 54.50 level. Alternately, a reversal near the current levels could see further upside, pushing WTI to 59.50.
Gold Keeps Bullish Momentum Going
The precious metal continued to push higher as it rallied to fresh six-year highs. Gold gained over 1.5% on Monday as it comfortably closed past the $1400 level an ounce. The gains in gold prices come with a mix of a weaker USD and a call from President Trump for the Fed to cut rates. The US-Iran tensions also contributed to the solid gains.
Will Gold Hit 1450 an Ounce?
The current bullish momentum in gold prices could see the precious metal rising to the 1450 handle which marks the next key level of interest. Price is now posting gains for the sixth consecutive week. The main resistance level is seen at 1470 handle. To the downside, the latest support is at 1404.50 which could stall any short term correction in prices.
EUR/USD keeps showing a positive trend. EUR reached 1.14000. USD remains under pressure after the Fed meeting. Current local levels of support and resistance are 1.13750 and 1.14100. Financial markets participants are waiting for a meeting of the leaders of the United States and China during the G20 summit, which will be held June 28-29 in Osaka. In the near future, technical correction of EUR/USD quotes is possible. Open positions from the key levels.
The Economic News Feed for 25.06.2019:
– Consumer Trust Index CB (US) – 17:00 (GMT+3:00);
– New Real Estate Sales (US) – 17:00 (GMT+3:00);
The price fixed above 50 MA and 100 MA which points to the power of the buyers.
The MACD histogram is in the positive zone but below the signal line which gives a weak signal to buy EUR/USD.
The Stochastic Oscillator is in the neutral zone, the %K line is below the %D line which points towards a correction of EUR/USD.
Trading recommendations
Support levels: 1.13750, 1.13400, 1.13100
Resistance levels: 1.14100, 1.14500
If the price fixes above 1.14100, consider buying EUR/USD, the price will move towards 1.14500-1.14700.
Alternatively, the price can correct towards 1.13400-1.13100.
The GBP/USD currency pair
Technical indicators of the currency pair:
Prev Open: 1.27328
Open: 1.27142
% chg. over the last day: -0.10
Day’s range: 1.27142 – 1.27554
52 wk range: 1.2438 – 1.3631
GBP/USD stabilized after a long rally. At the moment, GBP / USD quotes are in lateral movement. The trading tool tests local support and resistance levels: 1.27150 and 1.27600, respectively. In the near future technical correction is not excluded. Today we recommend to pay attention to economic releases from the USA. Positions must be opened from key levels.
The Economic News Feed for 25.06.2019 is calm.
The price fixed above 50 MA and 100 MA which points to the power of the buyers.
The MACD histogram is in the positive zone and keeps rising which gives a strong signal to buy GBP/USD.
The Stochastic Oscillator is in the neutral zone, the %K line started to cross the %D line. There are no signals at the moment.
Trading recommendations
Support levels: 1.27150, 1.26750, 1.26450
Resistance levels: 1.27600, 1.28000
If the price fixes above 1.27600, expect further growth towards 1.28000.
Alternatively, the quotes can correct towards 1.26750-1.26500.
The USD/CAD currency pair
Technical indicators of the currency pair:
Prev Open: 1.32137
Open: 1.31794
% chg. over the last day: -0.12
Day’s range: 1.31713 – 1.31962
52 wk range: 1.2727 – 1.3664
CAD keeps trading in a flat. The technical picture is ambiguous. A correction is possible soon. The local support and resistance are 1.31750 and 1.32150. Keep an eye on the US economic reports and the oil quotes dynamics. Open positions from the key levels.
The Economic News Feed for 25.06.2019 is calm. At 15:30 (GMT+3:00) Canada will publish a wholesales report.
The indicators do not provide precise signals, the price has crossed 50 MA.
The MACD histogram is close to 0. There are no signals at the moment.
The Stochastic Oscillator is in the neutral zone, the %K line is crossing the %D line. There are no signals at the moment.
Trading recommendations
Support levels: 1.31750, 1.31500, 1.31200
Resistance levels: 1.32150, 1.32500, 1.33000
If the price fixes below 1.31750, expect further descend towards 1.31400-1.31200.
Alternatively, the quotes can grow towards 1.32500-1.32700.
The USD/JPY currency pair
Technical indicators of the currency pair:
Prev Open: 107.304
Open: 107.289
% chg. over the last day: -0.03
Day’s range: 106.778 – 107.409
52 wk range: 104.97 – 114.56
The USD/JPY once again started to decline. Trading instrument updated local minima. The demand for “safe” assets remains at a fairly high level due to the growth of geopolitical tensions between the US and Iran. At the moment, the USD/JPY quotes are consolidating in the range of 106.800-107.100, respectively. Trading instrument has the potential to further decline. We recommend to pay attention to the dynamics of the yield of US government securities. Positions must be opened from key levels.
The Economic News Feed for 25.06.2019 is calm.
The price fixed below 50 MA and 200 MA which points to the power of the sellers.
The MACD histogram is in the negative zone and below the signal line which gives a strong signal to sell USD/JPY.
The Stochastic Oscillator is in the neutral zone, the %K line is above the %D line which points to the bullish mood.
Trading recommendations
Support levels: 106.800, 106.500
Resistance levels: 107.100, 107.400, 107.700
If the price fixes below 106.800, expect further descend towards 106.500-106.300.
Alternatively, the quotes can grow towards 107.400-107.600.
Best Recession Indicator Eurodollar Index Flashed Red
What next for S&P 500 & Gold?
The most important index, the Eurodollar Index, is one index that no one is paying attention to, and it just turned RED. The last time it turned red was one month before the US Federal Reserve (Fed) started cutting interest rates in 2007, and one month before the fed started cutting in 2001. In both cases, the US entered a recession within six months. How do we know no one is paying attention to the Eurodollar Index?
Google Says No One Is Paying Attention
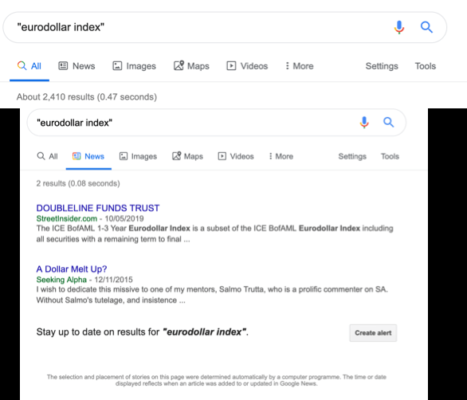
You probably have never seen the coming chart before. When you do a Google search on Eurodollar Index…What happens? You only get 2,410 search results on Google. Think about that for a second. There are tens of thousands of investment professionals around the world, maybe even hundreds of thousands, there hundreds of millions of retail investors, and yet when you do a very specific search on the Eurodollar Index, less than 3,000 searches show up.
Then when you look at news articles, the media isn’t paying attention to the Eurodollar Index either. Only 2 news articles have been written on it.
Yet, “The volume in Eurodollars (traded at the CME) is beyond anything you gold and crude oil can comprehend. Consider the following volume figures for 2012: Gold – 43.8 million contracts, Crude Oil – 134.2 million contracts. Eurodollars – 425.1 million contracts”
Something Broke in the Markets
When you read about the markets you hear about: Valuation metrics, like P/E or P/S.
But this doesn’t help you, the investor, because things can get much more expensive than investors think or they can get go much lower than they expected, which many commodity investors from 2012 to 2016 were caught up in value traps.
This is why we look for the sweet spot to avoid the value strap by not being too early. In order to get the capital flow coming in, we are looking for momentum to come back into the sector and/or stock.
Let’s have a look here. This is the Eurodollar Dollar Index going back to 1999. It really helps give us the temperature of the banking system.
“Somewhere out there in the banking system – There is some bank or multiple banks that cannot get funding.”
Going back to 1999, every time, AFTER the index went from a trend of falling for a number of years, bottomed, and flipped to start accelerating again ABOVE the moving average this was a clear warning SIGN that something is not good in the bank deposit markets.
Pay attention here. In December 2000, when the Eurodollar Index broke above the long-term averages, its momentum only further accelerated from there before the crashed the ensued from there. In August 2007, when the Index broke above the long-term averages, and this was the point the acceleration took resulting in the next recession which brings us to today.
So where are we today? We are back to where we were in 2001 and 2007. The Index has broken above the long-term averages.
Why is this important?
Eurodollar Index – Click to zoom in
Music Has Stopped
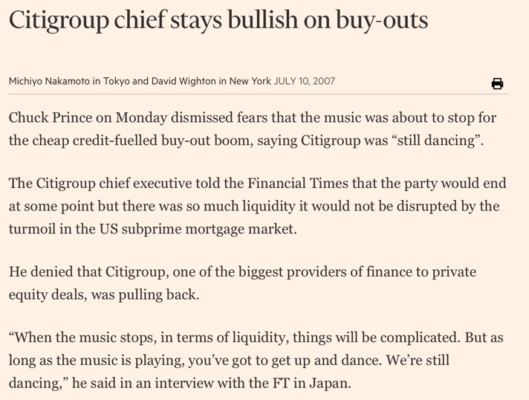
It all comes down to liquidity. Back in July 2007, the CEO at the time of Citigroup, Chuck Prince made this now infamous quote. “When the music stops, in terms of liquidity, things will be complicated. But as long as the music is playing, you’ve got to get and dance. We’re still dancing” (Ft.com)
Just one month later, as we mentioned previously, in August 2007, momentum for the Eurodollar Index accelerated back above the long-term averages, which highlights the music has stopped.
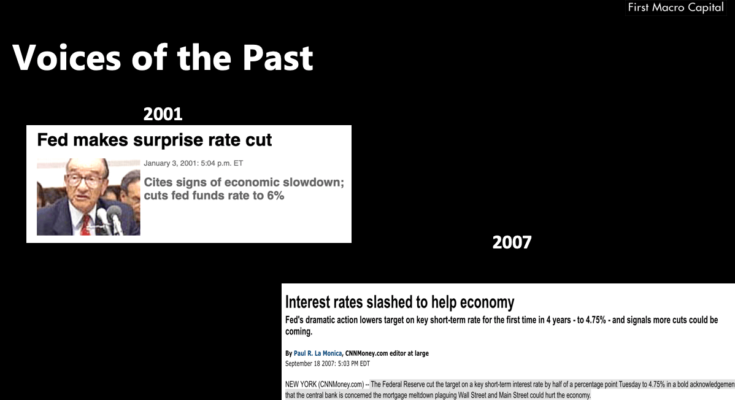
Voices of the Past
In every instance that the Eurodollar Index accelerated, the US Federal Reserve cut interest rates. In January 2001, the US Federal Reserve made a “surprise” rate cut before the recession started. Looking forward to September 2007, one month after the Eurodollar Index Accelerated higher, the US Federal Reserve cut rates for the first time in 4 four years. Now that the momentum accelerated higher, we shouldn’t be surprised that the Federal Reserve will cut interest rates, and it’s not because it’s a good sign.
Today: Fed vs Everyone Else
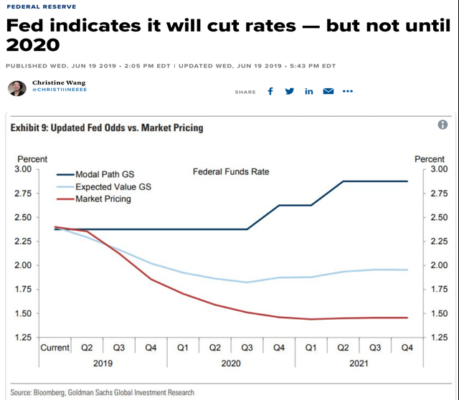
And yet today, the Fed says it won’t cut, until 2020. Yet we know from history that when Eurodollar Index accelerates above its long-term momentum, the Fed Funds rate falls, which it is doing today, and within a month the Federal Reserve cuts interest rates. Why? Because something bad happened. Will it be tariffs? Who knows? But something has broken and the US Federal Reserve will need to act.
Recession Within 6 Months
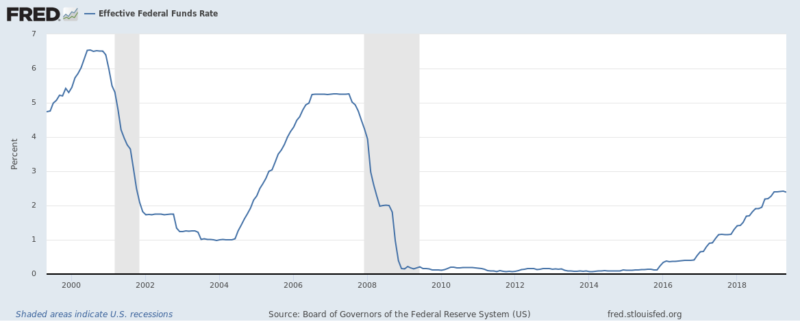
In November 2000, the Fed Funds rate was 6.51%, a month later in December 2000, the Eurodollar Index accelerated above the long-term averages and by May 2001 the US was in a recession. Then in July 2007, the Fed Funds rate was 5.26%, a month later in August 2007, the Eurodollar Index accelerated above the long-term averages, and by December 2007 it was the start of the US recession. Fast forward to today and the Fed Funds started falling in May after peaking, then in June, the Eurodollar Index accelerated higher breaking above the long-term moving averages. That puts a recession starting in the range of October to November of this year.
S&P 500 & Gold in 2000
As the Eurodollar Index accelerated at the end of 2000, the S&P 500 peaked higher initially before stumbling into a 2-year bear market. Gold blasted higher initially, then stumbled lower for the first half of 2000, before more than doubling from the inflection point.
S&P 500 & Gold in 2008
As the Eurodollar Index accelerated in 2008, the S&P 500 peaked higher initially before stumbling into the 2008 bear market. Gold, on the other hand, blasted higher for a number of months just like silver. Both gold and silver fell late 2008, but gold remained above the August 2007 inflection point.
Now You Know
Momentum has now accelerated confirming the value trap is now over for the Eurodollar Index. It is now in motion, and if history repeats, the S&P 500 wins briefly before losing over the next six to twelve months.
Gold won in both 2001 and 2008.
Silver is a mixed bag of beans. Interest rates have a high probability of being cut next month, the music will stop, and the excitement is only getting started. Now you know.
About the Author:
Paul Farrugia, BCom. Paul is the President & CEO of First Macro Capital. He helps his clients take advantage of cycle opportunities across all sectors and asset classes, for the long-term. He provides a checklist to find winning gold and silver mining producer stocks, to take advantage of the commodity cycle.
Disclaimer:
The information contained herein is obtained from sources believed to be reliable, but its accuracy cannot be guaranteed. It is not designed to meet your financial situation – we are not investment advisors, nor do we give personalized investment advice. The opinions expressed herein are those of the publisher and are subject to change without notice. It may become outdated, and there is no obligation to update any such information.
The demand for safe assets is still at a fairly high level due to the US conflict with Iran. Yesterday, US President Donald Trump imposed sanctions against Iran’s Supreme Leader Ayatollah Ali Khamenei. The President noted that the sanctions would also affect the Ayatollah’s entourage. Donald Trump believes that the new sanctions will not allow Khamenei to use the American financial system. Trump also accused Khamenei of Iran’s hostile behavior. The US president said the sanctions were “strong and proportionate response to Iran’s increasingly provocative actions.”
In response, Iranian Foreign Ministry Spokesman Abbas Mousavi said that these sanctions signify the end of diplomatic relations between the US and Iran. He also noted that the Trump government was destroying all established international mechanisms for maintaining world peace and security. The US dollar index #DX closed in the negative zone (-0.24%).
Today, investors will assess a number of economic reports from the United States. So, CB consumer confidence index, as well as new home sales, will be published in the US. Financial market participants expect a meeting of the leaders of the US and China during the G20 summit, which will be held on June 28-29 in Osaka.
The “black gold” prices are consolidating after a sharp rise the day before. At the moment, futures for the WTI crude oil are testing the mark of $58.00 per barrel. At 23:30 (GMT+3:00) the API weekly crude oil stock will be published.
Market Indicators
Yesterday, there was a variety of trends in the US stock market: #SPY (-0.12%), #DIA (+0.03%), #QQQ (-0.22%).
The 10-year US government bonds yield is 2.02-2.03%.
The news feed on 2019.06.25:
– CB consumer confidence index in the US at 17:00 (GMT+3:00); – New home sales in the US at 17:00 (GMT+3:00).
We also recommend paying attention to the speech by Fed Chairman Powell.
The Dollar Index (DXY) is now trading below the psychological 96 mark and erased all of its year-to-date gains, with G10 and Asian currencies taking advantage of the upside made available by the weaker Greenback. The DXY is clearly on the hunt for a stronger floor, having already broken past multiple support levels and embarked on a remarkable downward spiral since the Fed meeting last week. Markets are clearly buying in to the “Fed rate cut” theme, with investors no longer asking “if” US interest rates will be lowered, instead now trying to figure out the “when” and “how much”.
Tuesday’s speeches by Fed chair Jerome Powell as well as James Bullard, the noted dove on the FOMC, could serve as catalysts for more Dollar downside over the near-term. Should either Fed official lend more credence to the FOMC’s easing bias, that could help DXY fall to levels not seen since January, potentially closing in on the 95 psychological mark.
With Gold well above $1400, how much more upside is there?
The Dollar’s decline has certainly been a boon for Gold prices, with Bullion now trading at $1424 at the time of writing. Having already soared to its highest since 2013, investors will certainly be wondering how much upside is left for Gold.
Gold’s lure has only increased amid intensified fears over the global growth outlook that has been severely dampened by US-China trade tensions that have lasted for nearly a year. The now enlarged scope of the US-China conflict, expanding beyond trade to include the tech sector, along with the displays of brinksmanship that have unfolded in recent weeks, creates a narrative that should keep Gold’s allure intact.
Risk sentiment simmers ahead of Trump-Xi meeting
Investors appear to be chipping away at Asian equities, with most regional major indices posting slight declines on Tuesday. Markets can do little but wait for the meeting between US President Donald Trump and Chinese President Xi Jinping on the sidelines of the G20 summit in Japan later this week.
The Trump-Xi meeting holds the potential to rock markets, depending on how much the outcome deviates from market expectations. At best, markets can hope for a marked resumption of US-China trade talks. At worst, both leaders walk away to underscore the tremendous gulf that still remains in the US-China standoff. Any show of willingness to compromise by either Trump or Xi would be welcomed by risk assets, potentially pushing equities higher while taking the shine off safe haven assets such as Gold, the Japanese Yen, and US Treasuries.
Disclaimer: The content in this article comprises personal opinions and should not be construed as containing personal and/or other investment advice and/or an offer of and/or solicitation for any transactions in financial instruments and/or a guarantee and/or prediction of future performance. ForexTime (FXTM), its affiliates, agents, directors, officers or employees do not guarantee the accuracy, validity, timeliness or completeness, of any information or data made available and assume no liability as to any loss arising from any investment based on the same.
The closely-watched Conference Board’s consumer confidence index report will be released today. Unsurprisingly, the median estimates of economists polled forecast that consumer confidence will ease in the month of June.
Still, despite the forecast being pessimistic, it does show that the consumer confidence index still remains higher. The data comes as investors adjust their expectations on the US economy and monetary policy as a result.
Estimates show that the consumer confidence index will slip to 132.0 in June, down from 134.1 in May. The consumer confidence index peaked to 137.9 in October last year. Since then, it has remained close to the October 2018 highs.
CB Consumer Confidence Index – May 2019, 134.1
The CB’s consumer confidence index has increased steadily over the past two months since April 2019. It fell to 124.1 in March 2019.
Last week, the Fed’s dovish outlook suggested that there is a big chance it will cut rates. However, it is unlikely we will see that happen at least until September. Some corners of the markets expect a rate cut as early as July, which is also unlikely at this point.
Amid growth concerns on various themes including global trade and rising tensions between the US and Iran, consumer confidence is likely to take a small hit.
Even if the consumer confidence data does ease to the expected headline number, the markets will be unmoved by the data. This comes as the US consumer confidence is well anchored near the highs.
But questions remain on whether this optimism will remain in the months ahead. There are various headwinds both economically and geo-politically which could make consumers wary.
Consumer Confidence Index Recap – May 2019
In May, consumer confidence rose to 134.1. This was a beat on the estimates, and the index jumped by 4.9 points from 129.2 in April.
The CB’s present situation index which is based on the consumer’s assessment of the current business and labor market conditions jumped to 175.2, up from 169.0 in the previous month.
The expectations index which is a more short term assessment based on income, business and labor market conditions rose to 106.6 from 102.7 previously.
Most of the gains in May were driven by gains in employment. The data underlined consumer optimism as they expect growth to continue to rise in the short term. This was also evident from the CB’s present-day conditions.
Data for May saw the present day conditions rising to 38.3%, up from 37.6% a month ago.
There was also some optimism among consumers on job prospects. Consumers expected to find more jobs in the coming months.
This somewhat sits in contrast to the official unemployment data. Data from the Bureau of Labor Statistics in May saw the economy adding just 75,000 jobs in May. But at the same time, the unemployment rate held steady at 3.6%.
Downward revisions to previous month’s data saw the payrolls rising at an average pace of just 151,000 per month during the past three months. Wage growth also remained soft, rising 0.2% on the month, or about 3.1% on the year.
Will Rising Uncertainty Take Wind Off Consumer Optimism?
June’s CB consumer confidence index report will be interesting to watch. The survey covers a period following rising trade tensions between the US and China. However, the effects of higher tariffs are yet to trickle down to the average consumer.
Inflation remains tame in the US and despite the threat of higher tariffs, this has barely been able to budge consumer prices higher. The weak jobs report for May could, however, reshape the expectations.
Investors will be looking to the consumer confidence index report to assess the economic reports. There is a chance that there could be a lag in the data. With the markets widely expecting to see growth slow, the CB’s consumer confidence index report has been pointing otherwise.
Today’s report is not very likely to impact the markets much. But a dip in the index could potentially start to be a cause for concern.
On Monday the 24th of June, trading on the euro closed up by 0.26%. The pair moved upwards within a 24-pip corridor. There was no significant economic news planned for Monday. The euro was held up above 1.1370 thanks to the euro crosses along with a declining US dollar, which has been under pressure since the FOMC meeting.
16:00 US: S&P/Case-Shiller home price indices (Apr).
17:00 US: Richmond Fed manufacturing index (Jun), new home sales (May).
20:00 US: Fed’s Chair Powell speech.
20:15 Eurozone: ECB’s Cœuré speech.
Current situation:
Yesterday didn’t turn out as expected. I’m not sure why speculators still have an appetite for risk with the meeting between the leaders of China and the US looming (the coming weekend). It’s as if the major players already know what’s going to happen there. And what about the ECB’s loose monetary policy?
US President Donald Trump has ordered new economic sanctions against Iran. The increased tensions have boosted the oil market, which in turn has boosted commodity currencies.
I’m not changing the forecast I made yesterday. The only thing is that after hitting a fresh high, the 45th degree has shifted upwards. The pair has broken the lower boundary of the channel and is now trading at 1.1389. I’m expecting a drop to 1.1365. If a sharp upwards rebound doesn’t follow, we can expect a drop to around 1.1340.