Markets are still searching for that equilibrium between anticipating the next Fed rate cut, while President Donald Trump and President Xi Jinping meet later this week at the G20 summit. The Dollar Index (DXY) has bounced off the 96 support level, which has offset recent gains seen in G10 and Asian currencies.
Fed Chair Jerome Powell on Tuesday repeated the central bank’s dovish bias, highlighting that “the case for somewhat more accommodative policy has strengthened”. Market’s reluctance to allow the DXY to remain below 96 for too long suggests that the Greenback should remain supported in light of the gloomier mood in the atmosphere of financial markets this week. There is also the perspective being offered following the Fed speeches that the Federal Reserve will not be cutting interest rates as soon as what has been priced into the market; therefore, this can also support the near-term outlook for the Dollar after a brutal week for the Greenback following last week’s Fed decision. Even though US economic growth is moderating, the prospects of incoming monetary policy stimulus may help buffer the resilience of the world’s largest economy, which should in turn prop up the Greenback.
Global stocks lose momentum ahead of Trump-Xi meeting
Equity markets are losing momentum with Asian stocks following their US counterparts lower, as investors try and decipher what the crucial Trump-Xi meeting could mean for the global growth outlook for the rest of 2019. The outcome from this meeting could have major implications, not just for financial markets, but also for the global monetary policy bias.
Foreign investors could be prompted to move funds away from the developing world, should EM central banks lower their respective benchmark interest rates in hopes of offsetting headwinds from protracted US-China trade tensions. While the loosening of monetary policy should stimulate the domestic economy, it’s also expected to trigger outflows by foreign funds, depending on the interest rate differential at that point in time. Fund flows away from the EM universe could heap more downward pressure on the respective currencies.
Safe haven assets losing some of its appeal
Gold is shedding some of its gains, having dropped by more than two percent from its near-$1440 high on Tuesday to trade around the $1406 handle at the time of writing. The $1400 line remains a key psychological level for Bullion in assessing whether the risk aversion felt in the markets will be sustained.
US 10-year Treasury yields continue to test the two percent support level, while USDJPY is hovering above the 107 mark, as markets await the next catalyst that could move the risk barometer either way. While geopolitical tensions have intensified of late, it is just one of several global uncertainties that are featuring on investors’ radars. This weekend’s Trump-Xi meeting is poised to be the market’s litmus test for risk appetite going into the rest of the year.
Disclaimer: The content in this article comprises personal opinions and should not be construed as containing personal and/or other investment advice and/or an offer of and/or solicitation for any transactions in financial instruments and/or a guarantee and/or prediction of future performance. ForexTime (FXTM), its affiliates, agents, directors, officers or employees do not guarantee the accuracy, validity, timeliness or completeness, of any information or data made available and assume no liability as to any loss arising from any investment based on the same.
Dollar strengthens after Fed signals rate cut not a certainty
US stock market extended losses on Tuesday after weak data and comment by Fed chair the central bank was still in ‘wait-and-see’ mode on potential rate cuts. The S&P 500 lost 1% to 2917. Dow Jones industrial slid 0.7% to 26548. The Nasdaq dropped 1.5% to 7885. The dollar weakening reversed as St. Louis Fed President James Bullard said he was not in favor of a “huge action” on rates in July despite as 7.8% drop in home sales in May versus April: the live dollar index data show the ICE US Dollar index, a measure of the dollar’s strength against a basket of six rival currencies, rose 0.2% to 96.16 and is higher currently. Futures on US stock indices point to higher openings today.
FTSE 100 gained while other European indexes slid
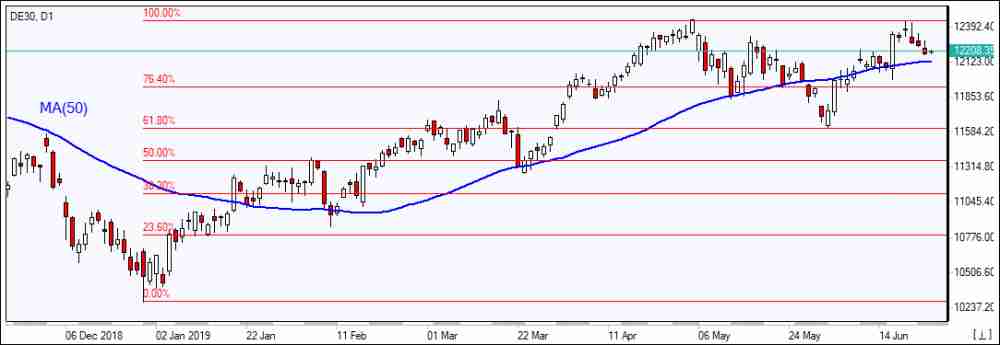
European stocks slid further on Tuesday led by auto maker shares. The EUR/USD joined GBP/USD s continuing slide with both pairs lower currently. The Stoxx Europe 600 ended marginally lower as the EU indicated that the Italian government may have anywhere between three and six months to take steps toward reducing the country’s budget deficit. The German DAX 30 fell 0.4% to 12228.44. France’s CAC 40 slipped 0.1%. UK’s FTSE 100 however added 0.1% to 7422.43 despite Boris Johnson’s reiterating of his threat to take the UK out of the European Union in October with or without agreeing a deal with the bloc.
Hang Seng still gains while other Asian indexes fall
Asian stock indices are mostly lower today as as administration official said Washington will not accept any conditions on tariffs at President Trump’s meeting with Chinese President Xo Jinping at the G20 summit in Japan. Nikkei fell 0.5% to 21086.59 despite yen’s slide against the dollar. Chinese stocks are mixed: the Shanghai Composite Index is down 0.2% while Hong Kong’s Hang Seng index is 0.2% higher. Australia’s All Ordinaries Index extended losses 0.3% with Australian dollar resuming its climb against the greenback.
Brent futures prices are edging higher today. The American Petroleum Institute late Tuesday report indicated US crude inventories fell by 7.5 million barrels last week. Prices rose yesterday: August Brent ended up 0.3% at $65.05 a barrel on Tuesday. Today at 16:30 CET the Energy Information Administration will release US Crude Oil Inventories.
Note: This overview has an informative and tutorial character and is published for free. All the data, included in the overview, are received from public sources, recognized as more or less reliable. Moreover, there is no guarantee that the indicated information is full and precise. Overviews are not updated. The whole information in each overview, including opinion, indicators, charts and anything else, is provided only for familiarization purposes and is not financial advice or а recommendation. The whole text and its any part, as well as the charts cannot be considered as an offer to make a deal with any asset. IFC Markets and its employees under any circumstances are not liable for any action taken by someone else during or after reading the overview.
Good drill results from the Maverick Zone, coupled with strengthening sentiment on uranium, bode well for this company, says Peter Epstein of Epstein Research.
I’ve attended two metals and mining conferences this month and two in May. Last month there was little consensus on what might happen with Section 232 in the U.S. This month, I’ve heard more positive takes. While exciting for the five to six uranium juniors with assets in the U.S., it’s also very good for the sector. The removal of this uncertainty next month could move uranium prices higher after having stalled at ~US$29 per pound (US$29/lb) six months ago.
I’ve spoken with more than 20 companies exploring for gold (Au), silver (Ag), copper (Cu), zinc (Zn), nickel (Ni), lead (Pb), lithium (Li), magnesium (Mg), vanadium (V), cobalt (Co), rare earth elements (REEs) and uranium. Spot price notwithstanding, sentiment on uranium is surprisingly high. Rare earth metals are hot, copper sentiment is solid, vanadium, gold, silver, cobalt, lithiumcold to ice-cold.
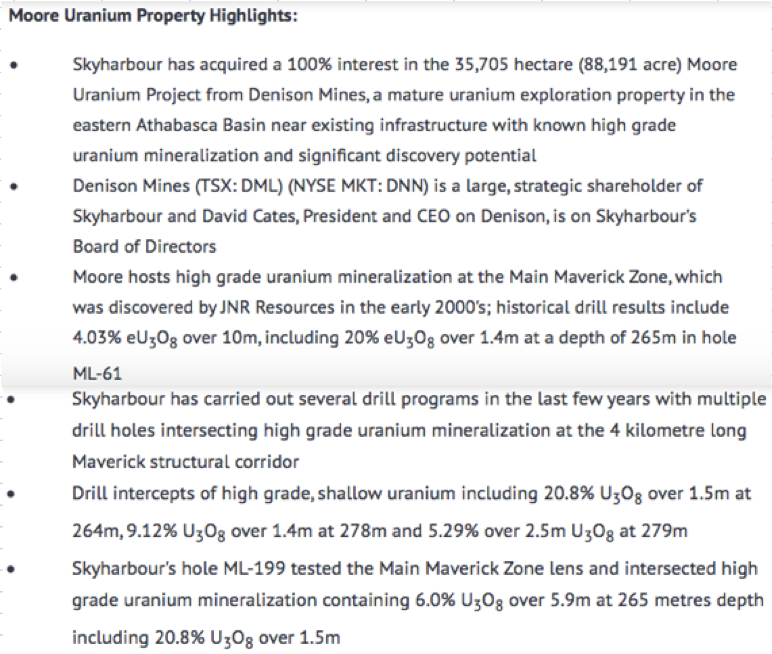
It’s great timing. Skyharbour Resources Ltd. (SYH:TSX.V; SYHBF:OTCQB) announced good results from its winter/spring drill program at its 100% owned Moore Uranium project on the southeastern side of the Athabasca Basin, in northern Saskatchewan. The recently completed winter diamond drilling program totaled 2,783 meters (2,783 m) in seven holes. Readers may recall that the project contains 12 contiguous claims totaling 35,705 hectares (~88,230 acres).
Just three days earlier, on June 17, Azincourt Energy Corp. (AAZ:TSX.V) reported positive results from its phase 1 drill program at the East Preston uranium project. Azincourt is earning into a 70% Interest on that project as part of a joint venture agreement with Skyharbour and Clean Commodities Corp (CLE:TSX.V).
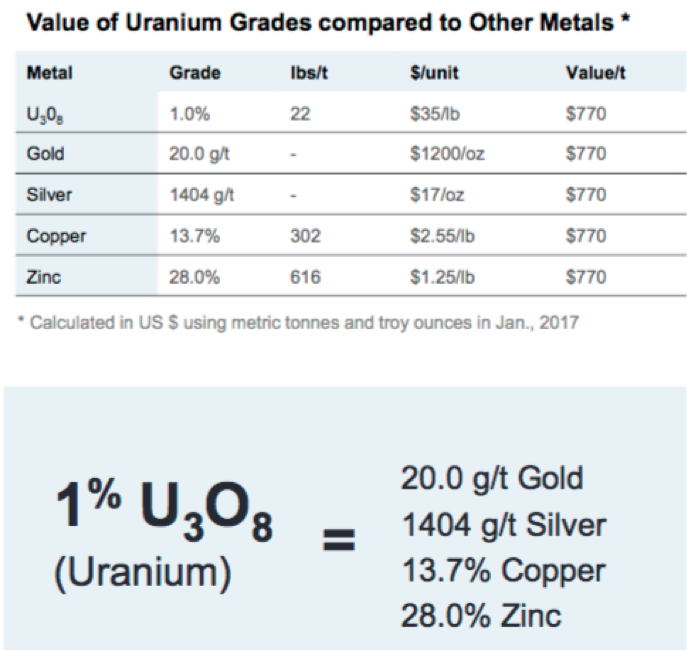
From the June 20th press release: “Unconformity style uranium mineralization was discovered on the Moore Project at the Maverick Zone in April 2001. Historical drill highlights include 4.03% eU3O8 over 10 m, incl. 20% eU3O8 over 1.4 m, and in 2017, Skyharbour announced an interval of 6.0% U3O8 over 5.9 m, incl. 20.8% U3O8 over 1.5 m at a vertical depth of 265 m.”
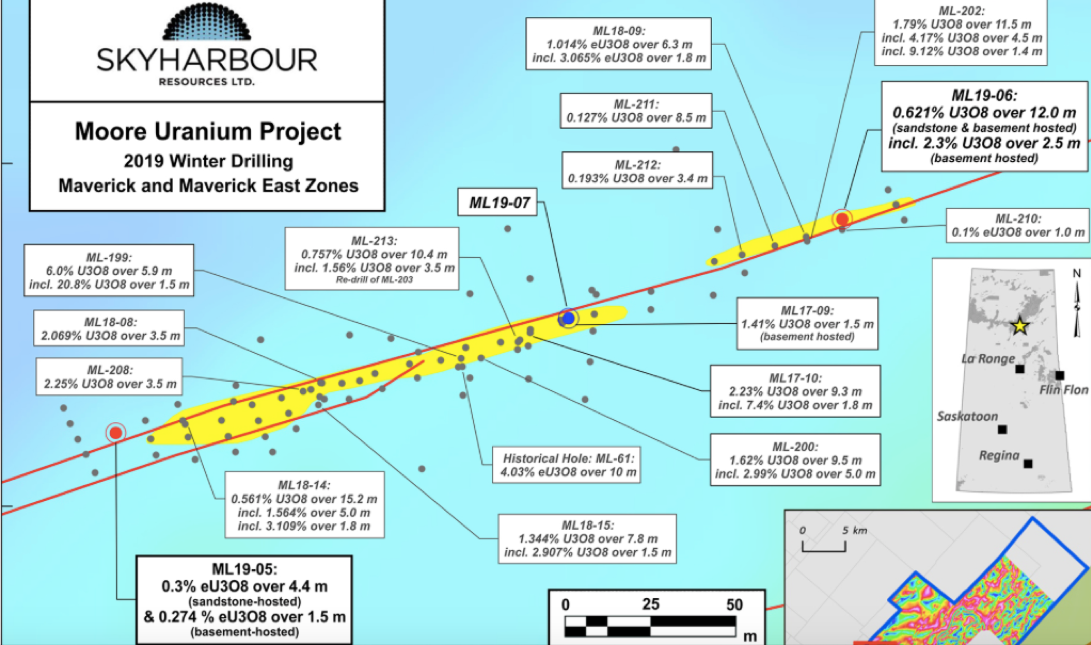
In the latest program, drill hole ML19-06 into the Maverick East zone hit a zone of uranium mineralization from 273 m to 285 m downhole. The interval returned 0.62% U3O8 over 12 m, incl. 2.5 m of 2.31% U3O8. According to management, this is one of the broadest zones of mineralization intersected on the property. This was the first hole ever drilled into the basement rocks at the East Maverick zone and. . .success!
This is not a discovery hole, but could lead to one in a future drill campaign. These were exploration holes, they could have missed. The fact that Skyharbour’s technical team is finding smoke suggests the real possibility of fire nearby.
Importantly, a significant portion of the 12 m intercept was in the basement rocks. Finding areas of high-grade U3O8 in the basement rocks of Athabasca properties has been a recipe for success for companies such as NexGen Energy Ltd. (NXE:TSX; NXE:NYSE.MKT), Fission Uranium Corp. (FCU:TSX; FCUUF:OTCQX; 2FU:FSE) and Denison Mines Corp. (DML:TSX; DNN:NYSE.MKT). These results are very encouraging. They don’t guarantee a big discovery, but the odds have gone up.
Hole ML19-05 was drilled at the western end of the Main Maverick zone and found two areas of mineralization above and below the unconformity, including 0.30% U3O8 over 4.4 m and 0.27% U3O8 over 1.5 m at 264.7 m to 269.1 m downhole and 274.7 m to 276.2 m downhole, respectively.
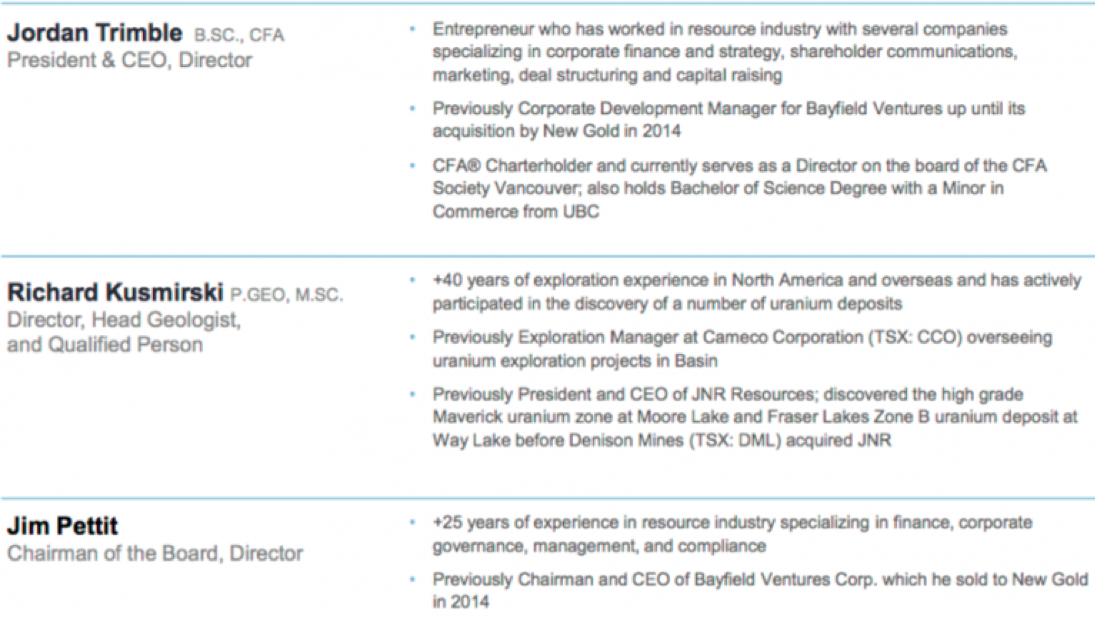
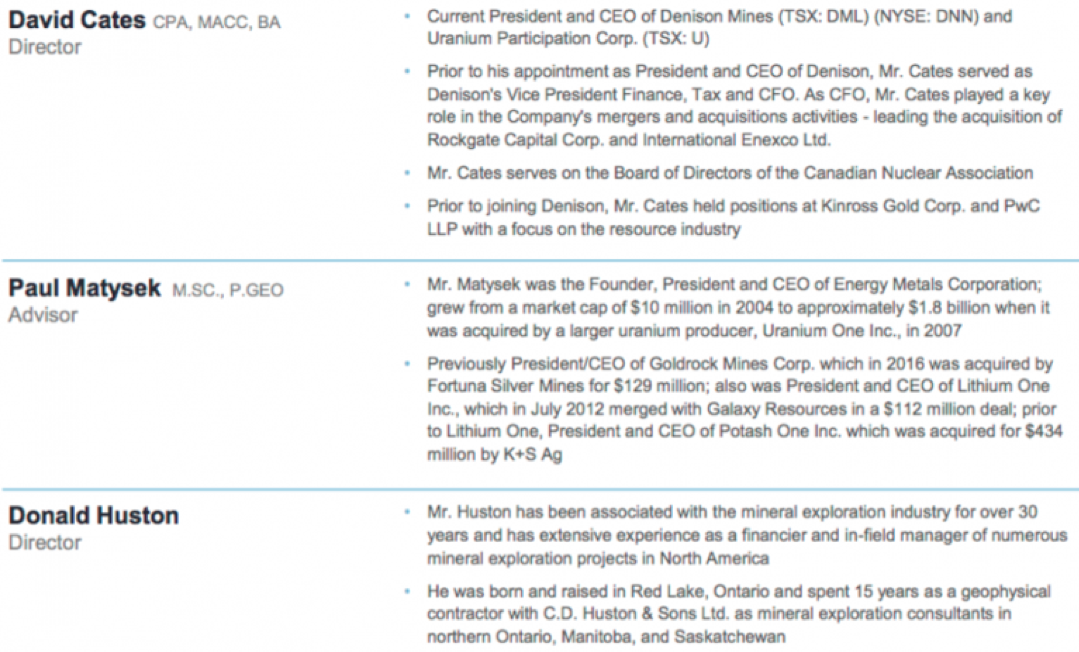
Jordan Trimble, president and CEO of Skyharbour, commented: “We are very pleased with the results from this drill program at our flagship Moore Project as we continue to discover new high-grade uranium mineralization in the underlying basement rocks at the Maverick corridor, as well as making new regional discoveries. We will be commencing a summer drill program to test more extensively the highly prospective potential feeder zones in the basement rocks, and follow up on the early success at the newly discovered Otter Zone.”
Management also reported that “strong potential for high-grade uranium mineralization was identified at a newly discovered regional target called the Otter zone, which is 7 km [kilometers] northeast of the Maverick zone.”
Analysis of the regional geophysical and geological data from the Otter zone area indicate that it’s in a setting that is highly prospective for uranium mineralized deposits in the Athabasca Basin. Only 2 km of the total 4 km-long Maverick corridor have been systematically drill tested, leaving robust discovery potential along strike as well as at depth. Planning is well underway for a summer/fall drill program.
Richard Kusmirski, head geologist of Skyharbour, commented: “The fact that significant uranium mineralization has once again been intersected in untested target areas bodes well for the discovery of additional uranium deposits. Furthermore, much of this uranium mineralization is associated with basement lithologies, a characteristic common to recent discoveries like NexGen’s Arrow Deposit, Fission’s Triple R Deposit and Denison’s Gryphon Deposit.”
Skyharbour will conduct a drone-assisted airborne magnetic survey to better identify high-priority structures along the Maverick corridor. Following that, a 2019 summer/fall diamond drill program will commence in August or September. This program will test both unconformity and basement targets and regional targets identified by Skyharbour’s technical team.
Of particular interest are potential underlying basement feeder zones to the unconformity-hosted high-grade uranium present at the Maverick corridor. These targets have seen only limited historical drilling. Additional drilling will also be done on portions of the recently discovered Otter zone.
This is important news for the company. Shareholders should be pleased that the management team, board and technical advisors are moving its wholly owned Moore Uranium and joint venture projects forward when most uranium (and other natural resource) juniors are dead in the water. The longer the uranium spot price remains below US$30/lb, the more explosive the move higher in price could be. Pre-Fukushima in March 2011, the price was in the low US$70s/lb. That was eight years ago!
Mining cost inflation since then suggests that a long-term contract price of US$6080/lb is not an unreasonable expectation. The question is, how long before we see evidence that those prices are indeed coming?
Skyharbour Resources is in no hurry: It doesn’t need higher prices this year or next. But, when the price moves definitively through US$30/lb, high-quality uranium juniors like Skyharbour could see substantial share price gains [see corporate presentation and latest press releases].
Peter Epstein is the founder of Epstein Research. His background is in company and financial analysis. He holds an MBA degree in financial analysis from New York University’s Stern School of Business.
Disclosures: The content of this interview is for information only. Readers fully understand and agree that nothing contained herein, written by Peter Epstein of Epstein Research [ER], (together, [ER]) about Skyharbour Resources, including but not limited to, commentary, opinions, views, assumptions, reported facts, calculations, etc. is not to be considered implicit or explicit investment advice. Nothing contained herein is a recommendation or solicitation to buy or sell any security. [ER] is not responsible under any circumstances for investment actions taken by the reader. [ER] has never been, and is not currently, a registered or licensed financial advisor or broker/dealer, investment advisor, stockbroker, trader, money manager, compliance or legal officer, and does not perform market making activities. [ER] is not directly employed by any company, group, organization, party or person. The shares of Skyharbour Resources are highly speculative, not suitable for all investors. Readers understand and agree that investments in small cap stocks can result in a 100% loss of invested funds. It is assumed and agreed upon by readers that they will consult with their own licensed or registered financial advisors before making any investment decisions.
At the time this interview was posted, Peter Epstein owned no shares in Skyharbour Resources, and it was an advertiser on [ER].
Readers understand and agree that they must conduct their own due diligence above and beyond reading this article. While the author believes hes diligent in screening out companies that, for any reasons whatsoever, are unattractive investment opportunities, he cannot guarantee that his efforts will (or have been) successful. [ER] is not responsible for any perceived, or actual, errors including, but not limited to, commentary, opinions, views, assumptions, reported facts & financial calculations, or for the completeness of this article or future content. [ER] is not expected or required to subsequently follow or cover events & news, or write about any particular company or topic. [ER] is not an expert in any company, industry sector or investment topic.
Streetwise Reports Disclosure: 1) Peter Epstein’s disclosures are listed above. 2) The following companies mentioned in the article are billboard sponsors of Streetwise Reports: Skyharbour Resources. Click here for important disclosures about sponsor fees. The information provided above is for informational purposes only and is not a recommendation to buy or sell any security. 3) Statements and opinions expressed are the opinions of the author and not of Streetwise Reports or its officers. The author is wholly responsible for the validity of the statements. The author was not paid by Streetwise Reports for this article. Streetwise Reports was not paid by the author to publish or syndicate this article. Streetwise Reports requires contributing authors to disclose any shareholdings in, or economic relationships with, companies that they write about. Streetwise Reports relies upon the authors to accurately provide this information and Streetwise Reports has no means of verifying its accuracy.
4) The article does not constitute investment advice. Each reader is encouraged to consult with his or her individual financial professional and any action a reader takes as a result of information presented here is his or her own responsibility. By opening this page, each reader accepts and agrees to Streetwise Reports’ terms of use and full legal disclaimer. This article is not a solicitation for investment. Streetwise Reports does not render general or specific investment advice and the information on Streetwise Reports should not be considered a recommendation to buy or sell any security. Streetwise Reports does not endorse or recommend the business, products, services or securities of any company mentioned on Streetwise Reports. 5) From time to time, Streetwise Reports LLC and its directors, officers, employees or members of their families, as well as persons interviewed for articles and interviews on the site, may have a long or short position in securities mentioned. Directors, officers, employees or members of their immediate families are prohibited from making purchases and/or sales of those securities in the open market or otherwise from the time of the interview or the decision to write an article until three business days after the publication of the interview or article. The foregoing prohibition does not apply to articles that in substance only restate previously published company releases.
Graphics provided by the author. As of the date of this interview, officers and/or employees of Streetwise Reports LLC (including members of their household) own securities of Skyharbour Resources, a company mentioned in this article.
Bob Moriarty of 321 Gold looks at the latest moves of this company with projects in Nevada, Utah and Idaho.
The nice thing about having been visiting hundreds of projects in almost two decades is that I find myself talking about properties I know quite well but are now under new management.
Liberty Gold Corp. (LGD:TSX) used to be named Pilot Gold. As a pilot, I thought that was a wonderful name. Their primary projects were in Turkey. No one wants to invest in Turkey until the nut cases there settle down so Pilot/Liberty Gold shifted direction to Nevada, Utah and Idaho.
I first visited the Kinsley Mountain gold mine with Nevada Sunrise back in 2003. Liberty Gold did a deal with Nevada Sunrise in 2011 and drilled off a small but high-grade gold resource. Liberty Gold owns 79% of the project, Nevada Sunrise the remaining 21%. Kinsley has a gold resource of about 525,000 ounces. Drilling will begin again in Q4 of 2019.
The primary focus for Liberty Gold right now is to recycle the Black Pine Gold Mine previously operated by Pegasus until 1998 when they went bankrupt. Pegasus mined 435,000 ounces of gold at a 2 g/t grade in an open pit using heap leaching. Later a new company called Western Pacific Resources staked the ground and began exploration. I told that story nine years ago.
Alas their timing was terrible. Gold peaked in early September of 2011 and the funds necessary to keep young juniors in business dried up. Western Pacific turned the project over to Liberty Gold in 2016 for a cash payment of $800,000 and a 0.5% NSR.
Liberty has the data from 1,874 short drill holes with a total of 191,500 meters. The “Rock Whisperer” Moira Smith is supervising the exploration and drill program. Results to date have been excellent showing 1.78 g/t Au over 47.2 meters including 3.24 g/t gold over 22.9 meters.
The Black Pine deposit is on the same trend as the Long Canyon mine being put into production by Newmont. The newly discovered zone of mineralization is in between the open pit and a known area of high-grade mineralization.
Mark O’Dea was the 2nd place winner in the 2000 Goldcorp Challenge. He was a bright young geo with some grandiose ideas. Now he’s an older and wiser geo running a stable of interesting companies, of which Liberty Gold is just one. He founded and later sold Fronteer Gold, owner of the Long Canyon project, to Newmont in 2009 for $2.3 billion.
Liberty Gold’s next most important project is the Goldstrike deposit with about 1.2 million ounces of gold at a .2 g/t cutoff. This project is located in Western Utah, just east of the Nevada border. It is a Carlin style deposit and past producer of 209,000 ounces of gold in a heap leach operated from 1988 until 1994.
Again Liberty has a load of data from prior operators including that from over 1,500 drill holes and 100,000 blast hole samples. Liberty has been more or less drilling continuously since 2016 and completed a maiden resource in early 2018.
Mark O’Dea has made a lot of money for a lot of people. Institutions own almost 40% of the company. They had over $8 million in the bank as of the end of March. With any increase in the price of gold, expect Liberty Gold to lead the way. Management is excellent, communications good and for more information spend some time going through a great presentation.
Liberty Gold is an advertiser and as such I am biased. Please do your own due diligence.
Liberty Gold LGD-T $0.53 (Jun 24, 2019) LGDTF-OTCQB 207.1 million shares Liberty Gold website.
Bob and Barb Moriarty brought 321gold.com to the Internet almost 16 years ago. They later added 321energy.com to cover oil, natural gas, gasoline, coal, solar, wind and nuclear energy. Both sites feature articles, editorial opinions, pricing figures and updates on current events affecting both sectors. Previously, Moriarty was a Marine F-4B and O-1 pilot with more than 832 missions in Vietnam. He holds 14 international aviation records.
Disclosure: 1) Bob Moriarty: I, or members of my immediate household or family, own shares of the following companies mentioned in this article: None. My company has a financial relationship with the following companies mentioned in this article: Liberty Gold is an advertiser on 321 Gold. I determined which companies would be included in this article based on my research and understanding of the sector. 2) The following companies mentioned are billboard sponsors of Streetwise Reports: Liberty Gold. Click here for important disclosures about sponsor fees. 3) Statements and opinions expressed are the opinions of the author and not of Streetwise Reports or its officers. The author is wholly responsible for the validity of the statements. The author was not paid by Streetwise Reports for this article. Streetwise Reports was not paid by the author to publish or syndicate this article. The information provided above is for informational purposes only and is not a recommendation to buy or sell any security. Streetwise Reports requires contributing authors to disclose any shareholdings in, or economic relationships with, companies that they write about. Streetwise Reports relies upon the authors to accurately provide this information and Streetwise Reports has no means of verifying its accuracy. 4) The article does not constitute investment advice. Each reader is encouraged to consult with his or her individual financial professional and any action a reader takes as a result of information presented here is his or her own responsibility. By opening this page, each reader accepts and agrees to Streetwise Reports’ terms of use and full legal disclaimer. This article is not a solicitation for investment. Streetwise Reports does not render general or specific investment advice and the information on Streetwise Reports should not be considered a recommendation to buy or sell any security. Streetwise Reports does not endorse or recommend the business, products, services or securities of any company mentioned on Streetwise Reports. 5) From time to time, Streetwise Reports LLC and its directors, officers, employees or members of their families, as well as persons interviewed for articles and interviews on the site, may have a long or short position in securities mentioned. Directors, officers, employees or members of their immediate families are prohibited from making purchases and/or sales of those securities in the open market or otherwise from the time of the interview or the decision to write an article until three business days after the publication of the interview or article. The foregoing prohibition does not apply to articles that in substance only restate previously published company releases. As of the date of this article, officers and/or employees of Streetwise Reports LLC (including members of their household) own securities of Liberty Gold, a company mentioned in this article.
The implications of the results and the next catalyst are addressed in a ROTH Capital Partners report.
In a June 19 research note, ROTH Capital Partners analyst Joe Reagor reported that mineralogical testing of Piedmont Lithium Ltd.’s (PLL:NASDAQ; PLL:ASX) three North Carolina deposits showed a “relatively pure spodumene,” which could benefit metallurgy and future recoveries.
Along with high-purity spodumene, testing also revealed a lack of petalite and lepidolite. This is a significant positive for Piedmont, Reagor pointed out, because the presence of these minerals typically requires extra operating and capital costs to recover the lithium.
Reagor noted the next major catalyst for the stock is an update indicating a significant resource increase, expected in the near future. This should address investors’ concerns about the length of the mine life. “If the company is able to demonstrate an initial mine life of 20 or more years, we would anticipate a significant positive reaction by the market,” he added.
ROTH has a Buy rating and a US$36 per share price target on Piedmont Lithium, whose stock is currently trading at around US$11.74 per share.
Disclosure: 1) Doresa Banning compiled this article for Streetwise Reports LLC and provides services to Streetwise Reports as an independent contractor. She or members of her household own securities of the following companies mentioned in the article: None. She or members of her household are paid by the following companies mentioned in this article: None. 2) The following companies mentioned in this article are billboard sponsors of Streetwise Reports: None. Click here for important disclosures about sponsor fees. 3) Comments and opinions expressed are those of the specific experts and not of Streetwise Reports or its officers. The information provided above is for informational purposes only and is not a recommendation to buy or sell any security. 4) The article does not constitute investment advice. Each reader is encouraged to consult with his or her individual financial professional and any action a reader takes as a result of information presented here is his or her own responsibility. By opening this page, each reader accepts and agrees to Streetwise Reports’ terms of use and full legal disclaimer. This article is not a solicitation for investment. Streetwise Reports does not render general or specific investment advice and the information on Streetwise Reports should not be considered a recommendation to buy or sell any security. Streetwise Reports does not endorse or recommend the business, products, services or securities of any company mentioned on Streetwise Reports. 5) From time to time, Streetwise Reports LLC and its directors, officers, employees or members of their families, as well as persons interviewed for articles and interviews on the site, may have a long or short position in securities mentioned. Directors, officers, employees or members of their immediate families are prohibited from making purchases and/or sales of those securities in the open market or otherwise from the time of the interview or the decision to write an article until three business days after the publication of the interview or article. The foregoing prohibition does not apply to articles that in substance only restate previously published company releases.
Disclosures from ROTH Capital Partners, Piedmont Lithium Ltd., Flash Note, June 19, 2019
Regulation Analyst Certification (“Reg AC”): The research analyst primarily responsible for the content of this report certifies the following under Reg AC: I hereby certify that all views expressed in this report accurately reflect my personal views about the subject company or companies and its or their securities. I also certify that no part of my compensation was, is or will be, directly or indirectly, related to the specific recommendations or views expressed in this report.
ROTH makes a market in shares of Piedmont Lithium Limited and as such, buys and sells from customers on a principal basis.
ROTH Capital Partners, LLC expects to receive or intends to seek compensation for investment banking or other business relationships with the covered companies mentioned in this report in the next three months.
Bob Moriarty of 321gold urges caution as the gold bulls revive.
Gold bulls are coming out of hibernation, with even billionaires talking about how much they like gold. That tends to happen just before a correction. The gold bulls get frothy around the mouth; speculators pour money into gold contracts just in time to get whacked once more so they can whine about how gold and silver are manipulated and no one saw it coming.
I’ve written a number of times about the importance of understanding bullish sentiment. I find the DSI of Jake Bernstein the single most valuable indicator I use. On both Thursday and Friday last, the DSI for gold hit 94. That doesn’t suggest a major high marking a top for the next 200 years but it does say caution would be merited. Too many people turned bullish all of a sudden.
Bob and Barb Moriarty brought 321gold.com to the Internet almost 16 years ago. They later added 321energy.com to cover oil, natural gas, gasoline, coal, solar, wind and nuclear energy. Both sites feature articles, editorial opinions, pricing figures and updates on current events affecting both sectors. Previously, Moriarty was a Marine F-4B and O-1 pilot with more than 832 missions in Vietnam. He holds 14 international aviation records.
Disclosure: 1) Statements and opinions expressed are the opinions of Bob Moriarty and not of Streetwise Reports or its officers. The auther is wholly responsible for the validity of the statements. Streetwise Reports was not involved in any aspect of the article preparation. The author was not paid by Streetwise Reports LLC for this article. Streetwise Reports was not paid by the author to publish or syndicate this article. 2) This article does not constitute investment advice. Each reader is encouraged to consult with his or her individual financial professional and any action a reader takes as a result of information presented here is his or her own responsibility. By opening this page, each reader accepts and agrees to Streetwise Reports’ terms of use and full legal disclaimer. This article is not a solicitation for investment. Streetwise Reports does not render general or specific investment advice and the information on Streetwise Reports should not be considered a recommendation to buy or sell any security. Streetwise Reports does not endorse or recommend the business, products, services or securities of any company mentioned on Streetwise Reports. 3) From time to time, Streetwise Reports LLC and its directors, officers, employees or members of their families, as well as persons interviewed for articles and interviews on the site, may have a long or short position in securities mentioned. Directors, officers, employees or members of their immediate families are prohibited from making purchases and/or sales of those securities in the open market or otherwise from the time of the interview or the decision to write an article until three business days after the publication of the interview or article. The foregoing prohibition does not apply to articles that in substance only restate previously published company releases.
In less than two weeks, our expectation that Natural Gas would move lower into our “basing zone”, between $2.00 and $2.20, has come true. Natural Gas has fallen into our expected basing/bottoming zone and traders should be looking to target low price entries as the extended setup of this base takes place.
It is our belief that anytime Natural Gas falls below $2.20, or lower, traders should consider jumping into NG related ETFs or NG future as this bottoming zone will likely push NG back above $2.35~$2.40 fairly quickly. Historically, any price move to levels closer to $2.00 have been very strong support for Natural Gas and this early basing pattern is setting up for an incredible opportunity for traders.
Ideally, we are expecting an upside the month of July to represent continue basing/bottoming in NG where we expect NG prices to rotate between $2.00 and $2.75. There is a moderate change that NG prices may attempt a move above $2.75 after July 20.
We believe August will result in a sideways downward sloping price pattern that may last only through the first 10 to 15+ days of August. The month of August is typically relatively muted in terms of price trend but includes greater price volatility – bigger price bar ranges.
The big breakout move will likely begin to happen in late August or early September. September, October, and November are all historically strong months for NG. September is the strongest month historically, October represents about half the upside strength of September and November represents, again, about half the upside strength of October.
Overall, this basing/bottoming pattern in NG is something skilled traders do not want to lose focus of. The opportunity at these sub $2.25 levels is incredible if traders are able to time their entries and plan for the August/September upside price launch. Looking back at historical price patterns, we could begin an upside price bias (a slower moving upside price trend) in early July. After NG hammers our a bottom near this $2.00 level and settles near support, the new trend should become evident as an upside price bias before the August/September liftoff.
This Daily NG chart shows the RED and CYAN Fibonacci projection levels (near $2.18 and $2.28). These levels will act as both a floor and ceiling for the future price as the basing pattern continues. Any breakdown in price below $2.18 would be a great entry level for skilled traders. There is a potential that price could drift a bit lower, possibly down to near $2.00 over the next few weeks, but we believe the basing/bottoming setup is beginning and support will be found above $2.00.
This Weekly NG chart shows a BLUE rectangle that highlights the support level identified by our proprietary Fibonacci price modeling system. Right now, this support level is between $2.10 and $2.30. These Fibonacci downward price projection points on the Weekly chart represent expected levels/targets for downward price SUPPORT to form. In other words, from the last price peak, price should move lower and target these Fibonacci projected targets where they will likely stall, bottom or attempt to find support – potentially setting up a new price “trough”.
We believe the next upside price move will happen between now and July 25th where NG will move from the $2.15 level to somewhere near $2.55 to $2.65. After that move, we expect the price of NG to stall briefly before beginning another leg higher towards $3.00 or higher. Our expectations of that last leg are that it may begin near mid-August and really begin to accelerate as we get closer/into September.
Remember, this is a very early set up – we still have 40+ days of expected basing/bottoming before any real upside potential is likely. Now is the time to trade this as short term 4~8% price objectives taking very skilled trades near the low price levels and targeting quick profits. As we enter July and move into August, we suggest traders switch from the short-term scalping mode and begin to consider the September, October & November historical price patterns to truly understand the upside potential.
Take a look at that huge move in 2018 over those same three months (September, October, November) in the chart above. That move started from the $2.65 level and ran all the way up to near $5.00. The same thing could happen again this year with price originating from a $2.00 basing level.
I can tell you that huge moves are about to start unfolding not only in the energy sector but in metals, and stock indexes and some of these super cycles are going to last years. A gentleman by the name of Brad Matheny goes into great detail with his simple to understand guide and charts. His financial market research is one of a kind and a real eye-opener. PDF guide: 2020 Cycles – The Greatest Opportunity Of Your Lifetime
CONCLUDING THOUGHTS:
In short, Nat Gas is oversold and showing signs of a bounce.
As a technical analysis and trader since 1997 I have been through a few bull/bear market cycles, I have a good pulse on the market and timing key turning points for both short-term swing trading and long-term investment capital. The opportunities are massive/life-changing if handled properly.
Take a look at my Wealth Building Newsletter and if you like what I offer, join me with the 1 or 2-year subscription to lock in the lowest rate possible and ride my coattails as I navigate these financial market and build wealth while others lose nearly everything they own.
Given the rate cut during the last meeting, there is a pretty broad consensus that we won’t be getting any action out of the RBNZ this time around.
That doesn’t mean we won’t get a reaction from the markets, however. This is especially true since there are strong expectations of a rate cut at the next meeting in August.
Our attention will be on the vote count now that the RBNZ has debuted its committee model. Then we’ll be scrutinizing the accompanying Rate Statement to see what has changed in the bank’s view compared to the last meeting. The key here is whether the market has gotten a little ahead of itself in projecting another cut so soon.
The Decision
As far as the breakdown of the votes, we’ll be looking to see if there is a split. This is only the second time for a committee decision, so analysts are still studying to see what patterns can be gleaned from the votes.
Last time the decision to cut was unanimous from the seven-member group. Now we want to see if there is a split in views. This time around there is no press conference in the schedule.
When a bank takes action, there almost always is a press conference. So this further cements the view that no action will be taken. This removes one risk event from the calendar, but ups the emphasis on the Rate Statement. This means all the volatility from the event will be concentrated at the same time.
The Changes and Outlook
There were three key takeaways from the last meeting: ]
1) The bank adjusted the OCR (the reference rate) to account for a further cut this year.
2) Saw ongoing headwinds for employment and growth.
3) Global slowdown expected to impact domestic employment and inflation, but that policy was currently “balanced” to “adequately” deal with it.
Changes in these views are what would be expected to move the market. Since the last meeting, we haven’t gotten any official data on CPI or employment, since those are quarterly reports. It wouldn’t be surprising that the bank would affirm this outlook pending the release of the data after the end of this month.
The Rate Path
Last time, the central bank cut their expectation of the OCR for September to 1.59% from 1.75%. This would bring it in line with the cut they applied during the meeting. This is an indication that they don’t expect to cut the rate at the next meeting.
However, that view might change depending on the data we get during July. If the bank cuts their September projection again, this would all but guarantee a rate cut in August.
The key is going to be where they expect the rate to be in June 2020. They projected it at 1.36%, taking into account another rate cut before then. If they maintain that expectation, it would continue to leave open the possibility of a rate cut in the near future. The bank also expected to keep rates that low until at least the end of next year.
It’s Not Just Domestic
The RBNZ is evidently paying attention to the global situation. And with geopolitical risks rising due to the tension in the Straits of Hormuz, there has been a bump up in the price of crude. That could translate into higher inflation in the near term, and alleviate some of the pressure on the bank to cut rates.
The bank is meeting before the G20, so its projections won’t be able to take into account if there is any good news on the trade front. It’s noteworthy that they continually emphasized their view that risks were primarily external, and we could expect that to be repeated this time around as well.
The US dollar has seen some net buying over the European morning on Tuesday following another weaker session yesterday. Despite some mild upside today, the main focus continues to be on expectations that the Fed will look to introduce fresh easing at some point over the coming months.
Indeed, the CME’s Fed-watch tool is now pricing a near 60% chance of a .25% cut in July and a roughly 40% chance of a .50% cut. USD index trades 95.54 last, with price still hovering below the broken 95.72 level.
Looking ahead today on the data front US Consumer Confidence is the main focus while comments from Fed Chair Powell will also be watched by traders.
Euro Weakens on USD Strength
EURUSD has softened today also, as a recovery in the US dollar takes the shine out of the recent rally.Outside of the support provided from recent dollar weakness, EUR has been under pressure given the expectations that the ECB will ease too. This is in line with Draghi’s projections over the last few weeks. EURUSD trades 1.1383 last, with price having reversed from just shy of testing the 1.1424 level.
Pound Pushes Higher
GBPUSD has continued higher today as the recent rally back above the 1.2658 level support continues.The rally in GBP is likely being driven by speculation that Brexit could be pushed further back, or ultimately avoided altogether, given the current uncertainty within British politics. GBPUSD trades 1.2763 last, heading back up near the 1.28 level resistance.
Equities Traders Keep Focus On Fresh Easing
Risk assets have remained broadly neutral today following some softening yesterday as the market reacted to fresh US sanctions on Iran. While there is relief that military conflict has been avoided, for now, there is still concern over how Iran will deal with these sanctions. And the prospect of war remains very real. For now, SPX500 trades just atop the 2939.87 level, sitting just under the recent all-time highs seen in response to last week’s dovish FOMC.
Gold Surges Higher Again
Safe havens have had a mixed day today with gold trading higher against the US dollar while JPY has softened a little. XAUUSD tested the 1432.21 level overnight and is hovering just below the level now with gold demand remaining strong. The prospect of fresh easing from the Fed as well as the ongoing US/China trade war and the threat of a military conflict with Iran, are keeping gold well bid. USDJPY is sitting back above the 107.08 level this morning following a sharp break below the level yesterday. Despite minor USD strength today, focus remains on further downside.
Oil Boosted By Middle East Tensions
Oil prices have remained in the green today. Rising tensions in the Middle East are keeping speculative buyers interested in the risk of supply disruptions from Iran. Looking ahead, traders are waiting on the API report today (before tomorrow’s main EIA release) to see whether the prior week’s drawdown continued last week. Crude trades 57.91 last, sitting just below the 58.13 level.
Commodity Currencies Well Supported
USDCAD has been lower today, despite some USD strength. Higher oil prices have boosted CAD, which has also drawn support from a more resilient tone from the BOC recently compared with the Fed and ECB for example. USDCAD trades 1.3173 last.
AUDUSD continues its recovery rally today as the move off the .6865 base takes price up to .6971 last. Surging gold prices, along with higher equities and oil, have kept AUD underpinned despite expectations of further RBA rate cuts to come.
Getting ready for the next meeting of the Reserve Bank of Australia
The head of the Reserve Bank of Australia (RBA) Philip Lowe expressed doubts about the effectiveness of the monetary policy of world central banks to reduce interest rates. Will the Australian dollar quotations increase?
Such a movement means its strengthening against the US dollar. Currently, the RBA rate is at historic lows at 1.25%. Investors are waiting for the inevitable rate cut to 1% already at the next meeting of the Australian Central Bank on July 2, 2019 and the subsequent reduction to 0.75% by the end of this year. After the statement of the RBA head , the probability of falling rates to 0.75% decreased. Market participants believe that a level of 1% may be sufficient for the Australian dollar. This provided support for AUDUSD. An additional positive factor for it is investors’ expectations that the US Federal Reserve will lower its rate at the next meeting on July 31, 2019. Currently the probability of such event is estimated at 62%. Fed rate cut forecasts have a negative effect on the US dollar.
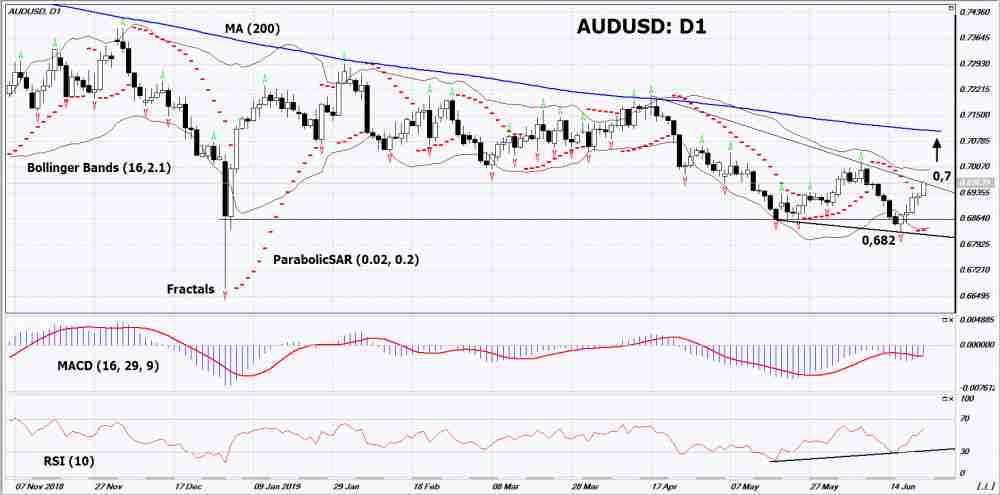
On the daily timeframe AUDUSD: D1 demonstrated a false breakdown of the support level and began a correction to the top. Various technical analysis indicators have generated uptrend signals. Further growth of quotations is possible in case of statements by Reserve Bank of Australia at a meeting on July 2 that it will refrain from excessive easing of monetary policy.
The Parabolic indicator demonstrated uptrend signal.
The Bolinger Bands narrowed, indicating low volatility. Both lines of Bollinger have a slope up.
The RSI indicator is above the 50 mark. It has formed a divergence to increase.
The bullish momentum may develop in case if AUDUSD exceeds the upper Bollinger line and the downtrend resistance line: 0.7. This level may serve as an entry point. The initial stop loss may be placed below the last lower fractal, the bottom Bollinger line at 0,682. After opening the pending order, we shall move the stop to the next fractal low following the Bollinger and Parabolic signals. Thus, we are changing the potential profit/loss to the breakeven point. More risk-averse traders may switch to the 4-hour chart after the trade and place a stop loss moving it in the direction of the trade. If the price meets the stop level (0,682) without reaching the order (0,7), we recommend to cancel the order: the market sustains internal changes that were not taken into account.
 Article by ForexTime