Carney Says UK Resilient In No-Deal Scenario

By Orbex

Dollar Down on Data Miss

The US dollar traded slightly lower over the European morning today. We have seen a shallow recovery over recent sessions. However, upside has been limited following a weak US consumer confidence number yesterday for June.

Looking ahead today, traders have the advance goods trade balance for May, which will be especially important given the recent re-escalation in the trade war between the US and China. USD index trades 95,74 last, sitting just atop the 95.72 level for now.

EUR Recovers on USD Weakness

EURUSD has been a little higher against the US dollar today following recent days of declines. Despite expectations of ECB easing to come, USD weakness has kept EUR bid. Price has remained above the 1.1343 level, trading 1.1359 last.

GBP Higher on Carney Comments

GBPUSD has ripped higher this morning in response to comments from Bank of England governor Mark Carney. The governor stated that the bank still feels that the core of the UK financial system will be resilient to a “no deal” Brexit scenario, should that outcome materialize. GBPUSD trades 1.2699, firmly up off the 1.2658 level support.

Risk Recovers Despite Middle East Tensions

Risk assets are recovering well today also following an earlier route in response to rising tensions in the Middle East. Fresh US sanctions on Iran wobbled the markets earlier in the week. However, risk appetite has stabilized again for now with the SPX500 trading 2933.48 last, making its way back up to the 2940.37 level.

Gold and JPY Down

The recovery in risk appetite has seen weakness among the safe havens today. Both gold and JPY are trading lower. USDJPY has rocketed back up above the 107.65 level today, following a break below the 107.08 level earlier in the week. XAUUSD has continued the reversal lower from the 1432.21 level today, trading 1406.59 last. As for now, the market moves away from focusing on potential Fed easing.

Traders Waiting on EIA Report

Oil prices remain supported today as the continuing escalation in tensions between the US and Iran drives anticipation of oil supply disruption in the region. Crude prices have reacted higher to recent headlines which continue to point to the risk of military conflict. Crude trades 58.77, having broken back above the 58.04 level. Oil has also been boosted by yesterday’s API report which indicated a further drawdown in US crude stores. Traders are now waiting on the release of the main EIA report today to confirm that of API, which should further support prices.

Commodity Currencies Carry on Higher

USDCAD has continued to move lower today. Price is briefly running down to levels not traded since February. Higher oil prices have been supporting the Canadian dollar which has been a key beneficiary of recent USD weakness. Should today’s EIA report confirm the crude drawdown, we could see USDCAD continue its slide into the US session, especially if US data comes in weak again.

AUDUSD has continued its rally for a seventh straight day today. The recovery in risk appetite, the weaker US dollar and the recent strength in gold, have all combined to support the currency. Price is now just shy of testing the .70 level which capped the recovery last month. A break back above this level could pave the way for a bigger recovery in the coming months.

By Orbex


Forex Technical Analysis & Forecast 26.06.2019 (EURUSD, GBPUSD, USDCHF, USDJPY, AUDUSD, USDRUB, GOLD, BRENT)

Article By RoboForex.com

EURUSD, “Euro vs US Dollar”

EURUSD has completed the first descending impulse along with the correction. Possibly, the pair may form the second impulse with the target at 1.1330 and then start consolidating around it. If later the price breaks the range to the downside, the instrument may form a new descending structure with the short-term target at 1.1272.

EURUSD_Технический анализ
Risk Warning: the result of previous trading operations do not guarantee the same results in the future

GBPUSD, “Great Britain Pound vs US Dollar”

GBPUSD is forming the first descending wave with the target at 1.2660. Later, the market may start a new correction towards 1.2722 and then resume trading downwards to reach 1.2635.

GBPUSD_Технический анализ
Risk Warning: the result of previous trading operations do not guarantee the same results in the future

USDCHF, “US Dollar vs Swiss Franc”

USDCHF has finished the first ascending impulse along with the correction. Possibly, today the pair may break the top of the first impulse and then continue moving upwards with the short-term target at 0.9837.

USDCHF_Технический анализ
Risk Warning: the result of previous trading operations do not guarantee the same results in the future

USDJPY, “US Dollar vs Japanese Yen”

USDJPY is forming the second ascending impulse with the target at 107.73. After that, the instrument may be corrected to reach 107.27 and then form one more ascending structure with the first target at 107.80.

USDJPY_Технический анализ
Risk Warning: the result of previous trading operations do not guarantee the same results in the future

AUDUSD, “Australian Dollar vs US Dollar”

AUDUSD has completed the first descending impulse along with the correction, thus forming a new consolidation range. Toda, the pair may break 0.6940 downwards and continue trading inside the downtrend with the first target at 0.6907.

AUDUSD_Технический анализ
Risk Warning: the result of previous trading operations do not guarantee the same results in the future

USDRUB, “US Dollar vs Russian Ruble”

After a gap down during the market opening, USDRUB expanded its consolidation range downwards, but later returned to 62.84. Possibly, today the pair may form a new descending structure towards 62.30 and then start another growth to reach 63.23. If later the price breaks the range to the upside, the instrument may start a new correction with the target at 65.00.

USDRUB_Технический анализ
Risk Warning: the result of previous trading operations do not guarantee the same results in the future

XAUUSD, “Gold vs US Dollar”

Gold has finished the second descending impulse. Today, the pair may be corrected to reach 1419.95 and then resume trading downwards with the first target at 1400.00. Later, the market may form one more ascending structure towards 1420.00.

GOLD_Технический анализ
Risk Warning: the result of previous trading operations do not guarantee the same results in the future

BRENT

Brent is consolidating around 65.75. If later the price breaks the range to the upside, the instrument may grow to reach 66.80, return to 66.10, and then form one more ascending structure with the short-term target at 67.70; if to the downside – continue the correction to reach 64.00 and then resume trading upwards with the above0-mentioned short-term target.

BRENT_Технический анализ

Article By RoboForex.com

Attention!
Forecasts presented in this section only reflect the author’s private opinion and should not be considered as guidance for trading. RoboForex LP bears no responsibility for trading results based on trading recommendations described in these analytical reviews.

The Golden Asteroid That Could Make Everyone On Earth A Billionaire

By OilPrice.com

Whether it was the Big Bang, Midas or God himself, we don’t really need to unlock the mystery of the origins of gold when we’ve already identified an asteroid worth $700 quintillion in precious heavy metals.

If anything launches this metals mining space race, it will be this asteroid–Psyche 16, taking up residence between Mars and Jupiter and carrying around enough heavy metals to net every single person on the planet close to a trillion dollars.

The massive quantities of gold, iron and nickel contained in this asteroid are mind-blowing. The discovery has been made. Now, it’s a question of proving it up.

NASA plans to do just that, beginning in 2022.

Of course, says veteran miner Scott Moore, CEO of EuroSun Mining “The ‘Titans of Gold’ now control hundreds of the best-producing properties around the world, but the 4-5 million ounces of gold they bring to the market every year pales in comparison to the conquests available in space.”

In the decades to come, if you want to be a gold titan, you’ll have to get your feet off the ground. The real titans will far from Earth.

Moore should know: He heads up a junior mining company that is seeking a seat at the titan table with the biggest in-development gold mine in Europe.

The 21st-Century Gold Rush

Can we actually extract this space gold? That is the quintillion-dollar question, certainly.

Speaking to Outerplaces, Professor John Zarnecki, president of the Royal Astronomical Society, estimates that it would take around 25 years to get ‘proof of concept’, and 50 years to start commercial production.

Of course, it all depends on two key things: Economic feasibility and our advancement of space technology.

And then, we’re not alone, either. There are other world powers who would like to get their hands on that asteroid, as well. China definitively plans to dominate this race.

Mitch Hunter-Scullion, founder of the UK-based Asteroid Mining Company, tells the BBC that this is definitively the next industry “boom”.

“Once you set up the infrastructure then the possibilities are almost infinite,” he said. “There’s an astronomical amount of money to be made by those bold enough to rise to the challenge of the asteroid rush.”

EuroSun’s Moore agrees: “What we’re doing on the ground now may be impressive, but like everything else, even gold exploration in space is only a matter of infrastructure. We’ll get to it, eventually.”

But it’s not just about the quintillion-dollar prospects of the Asteroid Belt, which is 750 million kilometers from Earth.

“This may be the Holy Grail of space exploration for gold, but it won’t be the first stop on this adventure,” Moore says.

There are also Near-Earth asteroids, which pass close to Earth and could be pushed into an orbit from which water and other elements could be extracted.

Then there’s the moon, which holds resources from gold and platinum group metals to Helium-3, water and rare earth metals. Even though mining operations require gravity and the Moon’s is only one-sixth of Earth’s, scientists say there is enough gravity to make it work.

The Global Asteroid Mining Market

Yes, there is already a global market for asteroid mining, and Allied Market Research estimates that it will top $3.8 billion by 2025.

They’re counting ongoing and future space missions, the rise in inflow of investments in space mining technologies, and the growing use of print materials obtained from asteroids in 3D printing technology.

According to Allied, while the spacecraft design segment of this market accounted for four-fifths of the total revenue in 2017 and is expected to continue to dominate through 2025, the big change here will be in the space mining segment, or the “operation segment”. That segment is expected to grow at a CAGR of over 29% by 2025 “due to a surge in investment by public and private stakeholders in space mining technologies for resource exploitation”.

“You can’t just think of space mining as something that will suddenly happen in 25 or 50 years,” says EuroSun’s Moore. “It’s already happening from an investment perspective. And the Asteroid Belt is just one aspect of this market. The entire global space market is worth hundreds of billions already.”

Indeed, Morgan Stanley estimates the global space economy to be worth $350 billion today. By 2040, it will be worth a cosmic $2.7 trillion.

Nor is the Psyche-16 Asteroid the only thing of interest in the Belt. Another small asteroid measuring 200 meters in length could be worth $30 billion in platinum.

Who Will Get There First?

China has vowed to dominate this race, and that’s an easier game for a country that controls all the major natural resource companies and maintains a tight leash on tech developers.

That’s not to say that the U.S. doesn’t have ambitions here. The difference, though, is stark. While NASA is focused on space exploration and scientific missions, China is focused on a space-based economy that is zeroing in on long-term wealth generation.

Even Europe, where EuroSun is developing a major goldmine in Romania, has its hand in the game. In January, the European Space Agency (ESA) announced a deal with ArianeGroup, the parent company of Arianespace, to study a prep mission to the moon in 2025. It’s got natural resources on its mind.

Even tiny Luxembourg has 10 space-mining companies registered since 2016, with some targeting space ventures to the Moon, and others eyeing near-Earth asteroids for mining.

Tokyo-based iSpace, for instance, is a private space exploration company that plans to complete a lunar orbit in 2020, and a soft landing in 2021.

For Moore, the prospect is daunting, even if it is the clear future reality, because mining in EuroSun’s Rovina Valley project in west-central Romania has been a cakewalk, both in terms of geology and infrastructure. Everything lines up for a large, low-cost project (the biggest in-development gold mine in Europe.) That won’t be the case in space, but it’s a big bill that governments will want to help foot or risk losing their place in space.

Whoever gets there first will become the new god of gold, and the competition is heating up.

A few companies that could vie for a spot in the space-race are majors like…

Seabridge Gold Inc. (NYSE:SA) (TSX:SEA)

Seabridge is an ambitious young company taking the industry by storm. It has a unique strategy of acquiring promising properties while precious metals prices are low, expanding through exploration, and then putting them up for grabs as prices head upward again.

The company owns four core assets in Canada; the KSM project, which is one of the world’s largest underdeveloped projects measured by reserves, Courageous Lake, a historically renowned property, and Iskut, a product of a recent acquisition by Seabridge.

Recently, Seabridge closed a major extension deal to continue expansion at its KSM project. CEO Rudi Fronk stated: “We are pleased that our EA Certificate has been renewed until 2024 under the same terms and conditions, reaffirming the Government of British Columbia’s support for KSM and the robustness of the original 2014 EA.”

Teck Resources (NYSE:TECK) (TSX:TECK)

Teck could be one of the best-diversified miners out there, with a broad portfolio of Copper, Zinc, Energy, Gold, Silver and Molybdenum assets. Its free cash flow and a lower volatility outlook for base metals in combination with a potential trade war breakthrough could send the stock higher in H2 of this year.

Teck’s share price stabilized last year and many investment banks now see the stock as undervalued. Low prices for Canadian crude and disappointing base metals prices weighed on Q4 earnings.

Despite its struggles, however, Teck Resources recently received a favorable investment rating from Fitch and Moody’s, and will likely benefit from its upgraded score. “Having investment grade ratings is very important to us and confirms the strong financial position of the company,” said Don Lindsay, President and CEO. “We are very pleased to receive this second credit rating upgrade.”

Kinross Gold Corporation (NYSE:KGC) (TSX:K)

Kinross Gold Corporation is relatively new on the scene, founded in the early 90s, but it certainly isn’t lacking drive or experience. In 2015, the company received the highest ranking for of any Canadian miner in Maclean’s magazine’s annual assessment of socially responsible companies.

While Kinross posted a significant loss in the fourth quarter of 2018, the company is making strong moves to turn around its earnings, including the hiring of a new CFO, Andrea S. Freeborough.

“Andrea’s successful track record at Kinross and throughout her career, including accounting, international finance, M&A, and deep management experience, will be an excellent addition to our leadership team,” said Mr. Rollinson. “We have great talent at Kinross and succession planning is a key aspect of retaining that talent for the future success of our Company.”

Wheaton Precious Metals Corp. (NYSE:WPM) (TSX:WPM)

Wheaton is a company with its hands in operations all around the world. As one of the largest ‘streaming’ companies on the planet, Wheaton has agreements with 19 operating mines and 9 projects still in development. Its unique business model allows it to leverage price increases in the precious metals sector, as well as provide a quality dividend yield for its investors.

Recently, Wheaton sealed a deal with Hudbay Minerals Inc. relating to its Rosemont project. For an initial payment of $230 million, Wheaton is entitled to 100 percent of payable gold and silver at a price of $450 per ounce and $3.90 per ounce respectively.

Randy Smallwood, Wheaton’s President and Chief Executive Officer explained, “With their most recent successful construction of the Constancia mine in Peru, the Hudbay team has proven themselves to be strong and responsible mine developers, and we are excited about the same team moving this project into production. Rosemont is an ideal fit for Wheaton’s portfolio of high-quality assets, and when it is in production, should add well over fifty thousand gold equivalent ounces to our already growing production profile.”

Eldorado Gold Corp. (NYSE:EGO) (ELD.TO)

This Canadian mid-cap miner has assets in Europe and Brazil and has managed to cut cost per ounce significantly in recent years. Though its share price isn’t as high as it once was, Eldorado is well positioned to make significant advancements in the near-term.

In 2018, Eldorado produced over 349,000 ounces of gold, well above its previous expectations, and is set to boost production even further in 2019. Additionally, Eldorado is planning increased cash flow and revenue growth this year.

Eldorado’s President and CEO, George Burns, stated: “As a result of the team’s hard work in 2018, we are well positioned to grow annual gold production to over 500,000 ounces in 2020. We expect this will allow us to generate significant free cash flow and provide us with the opportunity to consider debt retirement later this year. ”

By. Joao Piexe for Oilprice.com

IMPORTANT NOTICE AND DISCLAIMER

Oilprice.com, Advanced Media Solutions Ltd, and their owners, managers, employees, and assigns (collectively “the Publisher”) has not been paid to publish this communication. This communication is not, and should not be construed to be, an offer to sell or a solicitation of an offer to buy any security. The Publisher is not, and does not purport to be, a broker-dealer or registered investment adviser. This communication is not, and should not be construed to be, personalized investment advice directed to or appropriate for any particular investor. Any investment should be made only after consulting a professional investment advisor and only after reviewing the financial statements and other pertinent corporate information about the company.

SHARE OWNERSHIP. The owner of Oilprice.com owns shares of the featured company and is therefore extremely biased and has an incentive to see its stock perform well. The owner of Oilprice.com has no present intention of selling any shares in the near future but also does not assume any obligation to notify the market when it decides to buy or sell shares.

Link to article: https://oilprice.com/Energy/Energy-General/The-Golden-Asteroid-Worth-700-Quintillion.html

By Joao Peixe of Oilprice.com


Fibonacci Retracements Analysis 26.06.2019 (GBPUSD, EURJPY)

Article By RoboForex.com

GBPUSD, “Great Britain Pound vs US Dollar”

As we can see in the H4 chart, the current correctional impulse has reached 38.2% fibo. The next upside correctional targets may be 50.0% and 61.8% fibo at 1.2840 and 1.2920 respectively. After finishing the correction, GBPUSD may start a new descending wave to break the local low at 1.2506 and reach the long-term low at 1.2395.

GBPUSD_H4_Анализ по Фибоначчи
Risk Warning: the result of previous trading operations do not guarantee the same results in the future

In the H1 chart, the pair is trading downwards after completing another ascending wave and has already reached 38.1% fibo. Possibly, the correction may yet continue towards 50.0%, 61.8%, and 76.0% fibo at 1.2645, 1.2612, and 1.2573 respectively. The resistance is the local high at 1.2784.

GBPUSD_H1_Анализ по Фибоначчи
Risk Warning: the result of previous trading operations do not guarantee the same results in the future

EURJPY, “Euro vs. Japanese Yen”

As we can see in the H4 chart, the correction continues. The first rising wave after the convergence has reached 38.2% and may continue towards 50.0% and 61.8% fibo at 123.80 and 124.50 respectively. If the pair breaks the current low at 120.78, the price may continue the mid-term tendency towards 76.0% fibo at 120.25.

EURJPY_H4_Анализ по Фибоначчи
Risk Warning: the result of previous trading operations do not guarantee the same results in the future

In the H1 chart, the pair is being corrected before a new rising wave towards 76.0% fibo at 122.64 and the high at 123.18. The support is the low at 120.95 respectively.

EURJPY_H1_Анализ по Фибоначчи
Risk Warning: the result of previous trading operations do not guarantee the same results in the future

Article By RoboForex.com

Attention!
Forecasts presented in this section only reflect the author’s private opinion and should not be considered as guidance for trading. RoboForex LP bears no responsibility for trading results based on trading recommendations described in these analytical reviews.

The Analytical Overview of the Main Currency Pairs on 2019.06.26

by JustForex

The EUR/USD currency pair

Technical indicators of the currency pair:
  • Prev Open: 1.13982
  • Open: 1.13665
  • % chg. over the last day: -0.26
  • Day’s range: 1.13526 – 1.13723
  • 52 wk range: 1.1111 – 1.2009

Yesterday, the USD recovered some of its losses against the other world currencies. This movement was largely caused by technical factors. Investors began to partially fix positions. The EUR/USD currency pair has updated local minima. At the moment, the trading instrument is consolidating in the range of 1.13400-1.13750. We do not exclude further correction of EUR/USD quotes. Fed Chairman Jerome Powell stressed the independence of the Central Bank from US President Donald Trump, who insists on lowering the rates. Currently, more than 75% of financial market participants expect the Fed to reduce the range of key interest rates by 25 basis points to 2.00% -2.25% at a meeting in July. Positions must be opened from key levels.

The Economic News Feed for 26.06.2019:

  • – Durable Goods Reports (EU) – 00:00 (GMT+3:00);
EUR/USD

The indicators do not provide precise signals, the price fixed between 50 MA and 100 MA.

The MACD histogram is in the negative zone and keeps lowering which points towards a further correction.

The Stochastic Oscillator is in the oversold zone, the %K line is crossing the %D line. There are no signals at the moment.

Trading recommendations
  • Support levels: 1.13400, 1.13100, 1.12700
  • Resistance levels: 1.13750, 1.14100, 1.14500

If the price fixes below 1.13400, expect further correction towards 1.13100-1.12800.

Alternatively, the quotes can grow towards 1.14100-1.14400.

The GBP/USD currency pair

Technical indicators of the currency pair:
  • Prev Open: 1.27142
  • Open: 1.26861
  • % chg. over the last day: -0.39
  • Day’s range: 1.26655 – 1.26938
  • 52 wk range: 1.2438 – 1.3631

The GBP/USD currency pair has moved to decline after a long rally. GBP set new local minimums. At the moment, the GBP/USD quotes are consolidating near the demand zone of 1.26400-1.26650. 1.27150 acts as a “mirror” resistance. The trading instrument has the potential for further correction. Today we recommend to pay attention to economic releases from the USA. Positions must be opened from key levels.

The Economic News Feed for 26.06.2019 is calm.

GBP/USD

The price fixed below 100 MA which points towards the power of the sellers.

The MACD histogram is in the negative zone and keeps lowering which points towards a further correction of GBP/USD.

The Stochastic Oscillator is in the neutral zone, the %K line is crossing the %D line. There are no signals at the moment.

Trading recommendations
  • Support levels: 1.26650, 1.26400, 1.26000
  • Resistance levels: 1.27150, 1.27600, 1.27850

If the price fixes below 1.26650, expect further correction towards 1.26300-1.26000.

Alternatively, the quotes can grow towards 1.27400-1.27600.

Registration

The USD/CAD currency pair

Technical indicators of the currency pair:
  • Prev Open: 1.31794
  • Open: 1.31687
  • % chg. over the last day: -0.05
  • Day’s range: 1.31647 – 1.31952
  • 52 wk range: 1.2727 – 1.3664

The USD/CAD remains in a long flat. There is no defined trend. At the moment, the following local levels of support and resistance can be distinguished at 1.31600 and 1.32000, respectively. Technical correction is possible soon. You should pay attention to economic releases from the US, as well as the dynamics of oil prices. Positions must be opened from key levels.

The Economic News Feed for 26.06.2019 is calm.

USD/CAD

The indicators do not provide precise signals, the price has crossed 50 MA and 100 MA.

The MACD histogram is close to 0. There are no signals.

The Stochastic Oscillator is in the neutral zone, the %K line is below the %D line. There are no signals.

Trading recommendations
  • Support levels: 1.31600, 1.31300, 1.31000
  • Resistance levels: 1.32000, 1.32250, 1.32500

If the price fixes below 1.31600, expect further descend towards 1.31300-1.31000.

Alternatively, the quotes can correct towards 1.32400-1.32600.

The USD/JPY currency pair

Technical indicators of the currency pair:
  • Prev Open: 107.289
  • Open: 107.170
  • % chg. over the last day: -0.07
  • Day’s range: 107.098 – 107.502
  • 52 wk range: 104.97 – 114.56

USD/JPY currency pair retreated from monthly lows. At the moment, the technical picture is ambiguous. The quotes are consolidating near the local resistance of 107.500. Mark 107.100 is a key support. The trading tool has the potential for further recovery. We recommend to pay attention to the dynamics of US government bonds. Positions must be opened from key levels.

The Economic News Feed for 26.06.2019 is calm.

USD/JPY

The indicators do not provide precise signals, the price has crossed 100 MA.

The MACD histogram is in the positive zone and above the signal line which gives a strong signal to buy USD/JPY.

The Stochastic Oscillator is in the overbought zone, the %K line is crossing the %D line. There are no signals at the moment.

Trading recommendations
  • Support levels: 107.100, 106.800, 106.500
  • Resistance levels: 107.500, 107.700, 107.850

If the price fixes above 107.500, expect further growth towards 107.800-108.000.

Alternatively, the quotes can descend towards 106.800-106.600.

by JustForex

The US Dollar Has Moved Away from Local Lows

by JustForex

The US dollar has moved away from local lows after the speech by Fed Chairman Powell. Yesterday, Fed members lowered investors’ expectations for a sharp reduction in rates by half a percentage point at the July meeting. Fed Chairman, Jerome Powell, said that officials were currently wondering whether the decrease in rates was necessary due to the uncertainty concerning US tariffs, Washington’s conflicts with other world countries, and low inflation. St. Louis Fed President, James Bullard, does not consider, in turn, the state of the US economy to be heavy enough to cut the interest rate by 50 basis points at the next meeting in July. According to CME FedWatch Tool, more than 75% of financial market participants believe that the regulator will reduce the range of key interest rates by 25 basis points to 2.00% -2.25% at a meeting in July. The US dollar index (#DX) closed in the positive zone (+0.17%).

Today, during the Asian trading session, the Reserve Bank of New Zealand has left the interest rate unchanged at 1.50%. Investors expect important economic releases from the US. We also recommend following the election of a new leader of the Conservative Party, who will become the head of the UK government as well.

The “black gold” prices show a strong uptrend. At the moment, futures for the WTI crude oil are testing the mark of $58.80 per barrel. At 17:30 (GMT+3:00) crude oil inventories will be published in the US.

Market Indicators

Yesterday, aggressive sales were observed in the US stock market: #SPY (-0.98%), #DIA (-0.71%), #QQQ (-1.72%).

The 10-year US government bonds yield is at 2.02-2.03%.

The news feed on 2019.06.26:

– Core durable goods orders in the US at 15:30 (GMT+3:00).

We also recommend paying attention to the speech by the Bank of England Governor Carney.

by JustForex

Dollar Rebounds On G20 Summit And Falling Yields

By Orbex

The US dollar was seen posting some moderate gains on Tuesday. This marks the first bullish close since the previous four consecutive bearish declines. The G20 summit is due to start over the week where President Trump and China’s Xi are due to meet.

Global yields continued to fall. St. Louis Fed Chair, Bullard hinted at a 25bps rate cut at the July meeting. The RBNZ held its monetary policy meeting in the overnight session and left the official cash rate unchanged at 1.50%. However, the RBNZ hinted at more rate cuts over the course of the next few months.

Euro Losses at 1.1400 Handle

The common currency was bearish on Tuesday just after the rally pushed the currency to the 1.1400 handle. The declines come amid any major economic news out of the Eurozone. Italy’s deficit continues to remain one of the prevailing narratives. However, the declines in the euro came due to a stronger greenback which is on track to post the second day of consecutive gains. On the economic front, Germany’s GfK consumer confidence report is due to come out later today.

Will the EURUSD Retrace Lower?

The reversal off the 1.1400 handle comes on a potential profit taking. The currency pair has extended strong declines since hitting this level. The short term support is found at 1.1339. If EURUSD fails to rebound at this support, we expect to see a sharper correction. This will pull the euro lower to the 1.1250 level. To the upside, the currency pair could remain range bound within 1.1400 and 1.1339.

EURUSD

Crude Oil Rises on Inventory Drawdown

WTI crude oil prices broke past the sideways range established over the past two days. WTI crude oil closed at $58.72 on Tuesday. The gains came after the weekly inventory report from the American Petroleum Institute (API) showed a larger than anticipated drawdown in stockpiles. API’s weekly inventory saw crude oil stockpiles reporting a drawdown of 7.55 million barrels for the week ending June 20th. This was well above the median estimates of 2.89 million barrels in drawdown.

Will Crude Oil Prices Rise Further?

The current bullish breakout after the Doji candlesticks since the past two days indicate further gains. With price clearing the resistance area of 57.50, further gains are expected. The next main upside resistance is seen at the 61.00 level. We, therefore, expect oil prices to continue to rise to this level in the near term. To the downside, the bias shifts if oil prices fall back below 57.50. This will open the way for a retest to the 54.00 level of support.

WTI

Gold Slips as Fed Stresses on Central Bank Independence

Gold prices were seen trending lower this morning after price rallied to a fresh six-year intraday high of 1439. Fed Chair Jerome Powell stressed the independence of the central bank in a speech on Tuesday. Powell also warned about the risks of monetary policy caving into political interests. Powell, however, did not tip his hand into what the Fed would do at the next meeting. The odds for a July rate cut have been increasing since the last Fed meeting.

How Far Will Gold Prices Correct?

The strong gains in gold prices over the past few weeks has led to the precious metal appreciating over 10% in just four weeks. However, the early correction seen this morning has pushed price to the short term support of 1404.33. A rebound off this level could keep prices supported to the upside. However, gold will need to break past the previous highs above 1439 to confirm the bullish trend continuation.

GOLD

By Orbex


Gold: short-term a little extended, but gains to come in the mid-term

By Admiral Markets

Source: Economic Events June 25, 2019 – Admiral Markets’ Forex Calendar

In our technical piece from last Friday, we called Gold as a ‘strong buy’ after it broke its multi-year-resistance zone around 1,360/365 USD after a very dovish interpreted Fed last week on Wednesday.

‘Unfortunately,’ the mentioned dip back towards the breakout region around 1,360/365 USD did not occur, but instead, the precious metal continued to storm higher already hitting the first potential target on the upside around 1,440 USD, a high being marked in September 2013 and currently acting as a potential stop-over up to 1,700 USD.

In general, the mode looks very extended with the RSI(14) on a daily-time-frame hitting the highest level since February 2016. From that perspective, the risk-reward for long engagements seems to become a little unattractive and any solid, probably better than expected data set like today’s US Durable Goods at 1330 BST could trigger a corrective move, even though a dip down to 1,360/365 seems very optimistic, we expect first buyers around 1,410 USD already.

On the other hand and based on our experience, we know Gold being quite trend-stable and even if the mode looks quite extended, Gold could continue to trade even higher without looking back.

This seems especially true if the incoming US data continues to disappoint. That said, further gains up to 1,480/490 USD, a high from May 2013, is a serious option, too:

Source: Admiral Markets MT5 with MT5-SE Add-on Gold Daily chart (between March 19, 2018, to June 25, 2019). Accessed: June 25, 2019, at 10:00pm GMT – Please note: Past performance is not a reliable indicator of future results, or future performance.

In 2014, the value of Gold fell by 1.7%, in 2015, it fell by 10.4%, in 2016, it increased by 8.1%, in 2017, it increased by 13.1%, in 2018, it fell by 1.6%, meaning that after five years, it was up by 6.4%.

Investing in Forex with Admiral Markets

Admiral Markets offers professional traders the ability to trade with a custom, upgraded version of MetaTrader 5, allowing you to experience trading at a significantly higher, more rewarding level. Experience benefits such as the addition of the Market Heat Map, so you can compare various currency pairs to see which ones might be lucrative investments, access real-time trading data, and so much more. Click the banner below to start your FREE download of MT5 Supreme Edition!

Download MetaTrader 5 and begin trading today!

Disclaimer: The given data provides additional information regarding all analysis, estimates, prognosis, forecasts or other similar assessments or information (hereinafter “Analysis”) published on the website of Admiral Markets. Before making any investment decisions please pay close attention to the following:

  1. This is a marketing communication. The analysis is published for informative purposes only and are in no way to be construed as investment advice or recommendation. It has not been prepared in accordance with legal requirements designed to promote the independence of investment research, and that it is not subject to any prohibition on dealing ahead of the dissemination of investment research.
  2. Any investment decision is made by each client alone whereas Admiral Markets shall not be responsible for any loss or damage arising from any such decision, whether or not based on the Analysis.
  3. Each of the Analysis is prepared by an independent analyst (Jens Klatt, Professional Trader and Analyst, hereinafter “Author”) based on the Author’s personal estimations.
  4. To ensure that the interests of the clients would be protected and objectivity of the Analysis would not be damaged Admiral Markets has established relevant internal procedures for prevention and management of conflicts of interest.
  5. Whilst every reasonable effort is taken to ensure that all sources of the Analysis are reliable and that all information is presented, as much as possible, in an understandable, timely, precise and complete manner, Admiral Markets does not guarantee the accuracy or completeness of any information contained within the Analysis. The presented figures refer that refer to any past performance is not a reliable indicator of future results.
  6. The contents of the Analysis should not be construed as an express or implied promise, guarantee or implication by Admiral Markets that the client shall profit from the strategies therein or that losses in connection therewith may or shall be limited.
  7. Any kind of previous or modeled performance of financial instruments indicated within the Publication should not be construed as an express or implied promise, guarantee or implication by Admiral Markets for any future performance. The value of the financial instrument may both increase and decrease and the preservation of the asset value is not guaranteed.
  8. The projections included in the Analysis may be subject to additional fees, taxes or other charges, depending on the subject of the Publication. The price list applicable to the services provided by Admiral Markets is publicly available from the website of Admiral Markets.

Leveraged products (including contracts for difference) are speculative in nature and may result in losses or profit. Before you start trading, you should make sure that you understand all the risks.

By Admiral Markets

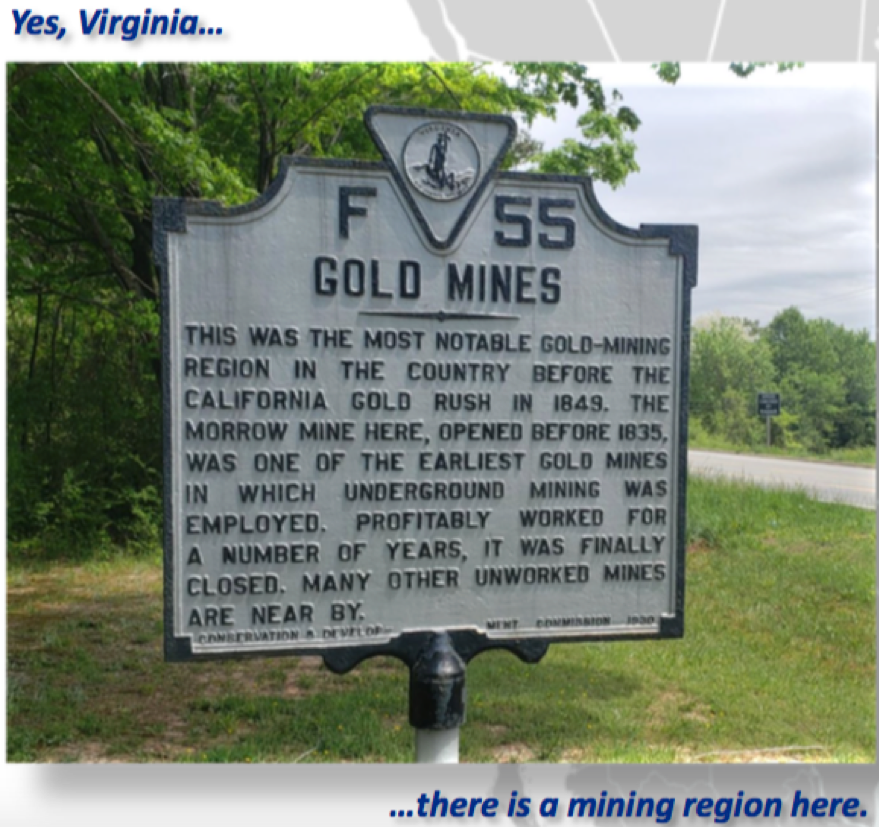
Yes, Virginia, There Is Mining Here

By The Gold Report

Source: Peter Epstein for Streetwise Reports   06/21/2019

Peter Epstein of Epstein Research explores prospects in Virginia and Canada in this interview with the company’s CEO.

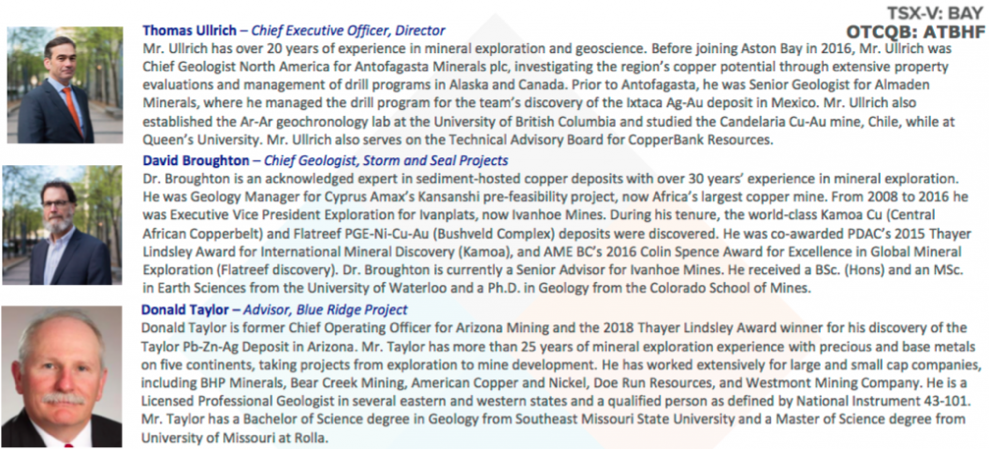
I’ve been watching this company for nearly two years. There have been ups and downs, a lot of excitement and some disappointments, but the management team at Aston Bay Holdings Ltd. (BAY:TSX.V; ATBHF:OTCQB) is superb—no one can argue that fact.

And, the market for natural resource stocks has been awful. Anyone disagree? In looking across several sectors—battery, precious and base metals—I would say that Aston Bay’s shares are in the bottom quartile of performance over the past year. Nothing to brag about, but it could certainly be worse.

As a single-asset play in a high-cost exploration jurisdiction (Nunavut, Canada), this was (and still is) a highly speculative investment opportunity. However, Aston Bay is now a two project company, and its second project is in the much cheaper to operate and faster-moving location of Virginia in the U.S.). In Virginia, one of the company’s primary targets is gold, which just so happens to be performing extremely well. As I write this, gold is up over US$100 per ounce (US$100/oz) in June alone, and touched US$1,395/oz (a 15-month high) earlier this morning (June 20). Yet, Aston’s market cap is just CA$6.5 million (CA$6.5M = US$5M). Now could be a good time to take a closer look at the company.

This interview is more focused on the newer asset in the U.S., a property that’s in the process of being greatly expanded and had very recent high-grade drill results. The team wants to educate the market about this exciting project. However, CEO Thomas Ullrich remains quite bullish on Nunavut, he just needs to stretch his exploration dollars and spend wisely. Deep drilling is simply not an option (too expensive) unless Aston finds a partner. But if other metals follow the gold price higher, finding a partner could become a lot easier.

Without further preamble, here is my exclusive interview with Thomas Ullrich, a man with over 20 years’ experience in mineral exploration and geoscience, CEO and a director of Aston Bay.

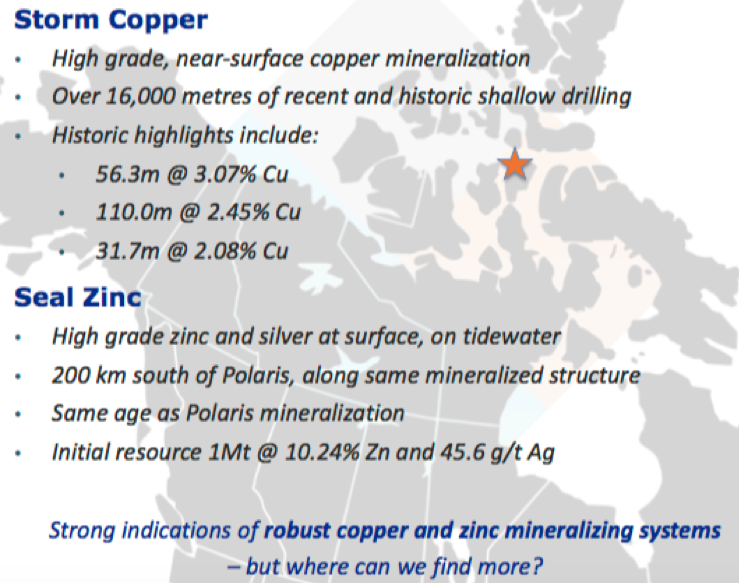
Peter Epstein: In looking at your new June corporate presentation, I see near-surface hits of 56m @3.06% copper (Cu), 110m @2.45% Cu in Nunavut. . .What could possibly be wrong?

Thomas Ullrich: There’s nothing wrong with that! These hits are a clear indication of a very robust copper mineralizing system at our Storm Copper project in Nunavut. The system is equally robust for zinc, as can be seen in the 1 million tonne Inferred resource of over 10% zinc at our Seal Zinc project to the west. We have two locations where mineralization pokes through to surface, over top of over 2,000 meters of flat-lying sedimentary rock beds.

The thesis here is that metal-bearing fluids moving through faults can potentially deposit very significant amounts of copper and zinc in permeable sedimentary layers. The combination of a robust mineralizing system and a thick package of rock with permeable layers increases our confidence that a significant deposit might have been formed. However, since the rocks are flat-lying, most of the potentially mineralized layers are hidden. The only way to find them is to drill.

But drilling is expensive, so smart targeting is critical. Geophysics can help “see” into the subsurface to improve the odds, but it’s not simple. We have some large gravity anomalies that may correspond to metal deposition in areas predicted by our geological model. That combination of a robust ore-forming system, predictive geological model and supporting geophysical anomalies is very compelling.

The gravity geophysical method, however, does not give a good read on the depth of the anomalies. The targets might be too deep to reach by drill. Since the window for economic drilling here is 500 meters (550 m), we need to do additional geophysical work to confirm that the attractive gravity anomalies are within 500 m of surface.

Peter Epstein: What would you say to a shareholder who’s underwater and upset about how the Aston Bay project in Nunavut is playing out?

Thomas Ullrich: I own 2.5 million shares of BAY, all bought in the open market or in private placements, and I’m underwater myself. Each year, we have advanced our Nunavut project to offer the potential for very significant rewards. Last season we swung for the fences with our drill program, as we told investors we would, and that potential for a home run drove the share price up. We hit copper and zinc, but not the “home run” the market wanted.

Discoveries are rarely made on the first drill program—ask Dave Broughton how many tries it took to find Kamoa. We still strongly believe that the Nunavut project has the potential for significant discovery, and we’re demonstrating this with successful exploration. Over the past few months, I’ve added 1 million shares to my personal holdings.

Peter Epstein: With so many cheap mining projects around the world, why did your team choose the Blue Ridge project in Virginia as your company’s second major asset?

Thomas Ullrich: Cheap mining properties are usually cheap for obvious reasons. The Virginia projects are very different; they were unrecognized and overlooked, so they’re undervalued. The Blue Ridge Mining project has an excellent pedigree, created from Arizona Mining founder Don Taylor’s private company. Don brings decades of experience working in Virginia, and the critical relationships required to get things done.

The area is highly prospective for both base and precious metals, home to mineralized belts that contain the base metal deposits of the Copper Basin, and the Haile Gold Mine, but little explored due to the deep weathering and lack of outcrop. Not only are the Blue Ridge projects undervalued, they are a great match for Aston Bay; they fit right into our base metals exploration wheelhouse. The Blue Ridge projects significantly expand upon our core competency with a tremendous gold story.

Dave Broughton, the team and I have all had success with precious metals. Just as important, all the heavy lifting has been done on these projects, with early-stage exploration completed. We’re at the drill-ready stage. Virginia, as a “fee simple” jurisdiction, allows us to drill without any permitting required. This allows us to act quickly, getting us to a discovery faster.

Great projects, ready to drill, in a place where you can drill right away (and in a jurisdiction where you can have faith that you can mine and subsequently repatriate your profit). It’s an exciting project and a substantial value-add to Aston Bay.

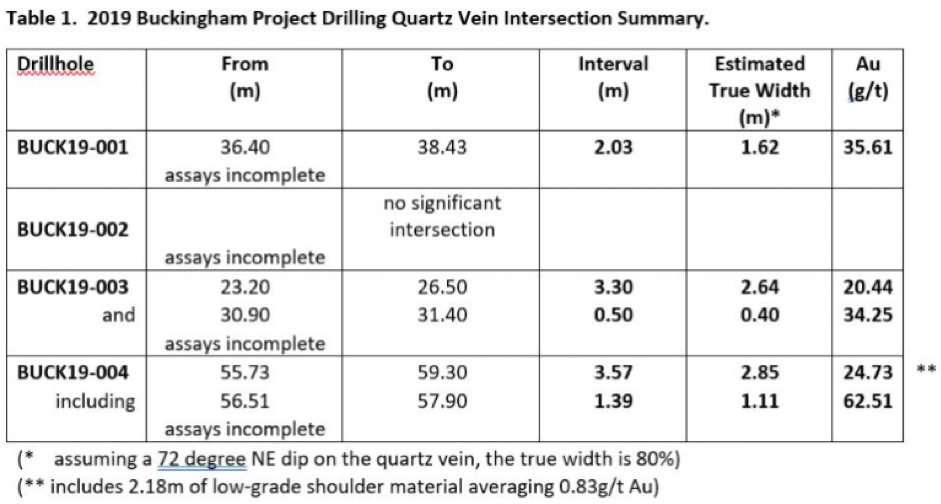
Peter Epstein: Please explain your view on the results of four drill holes reported in early June. [Note: BAY shares were down nearly 40% on the day of the announcement].

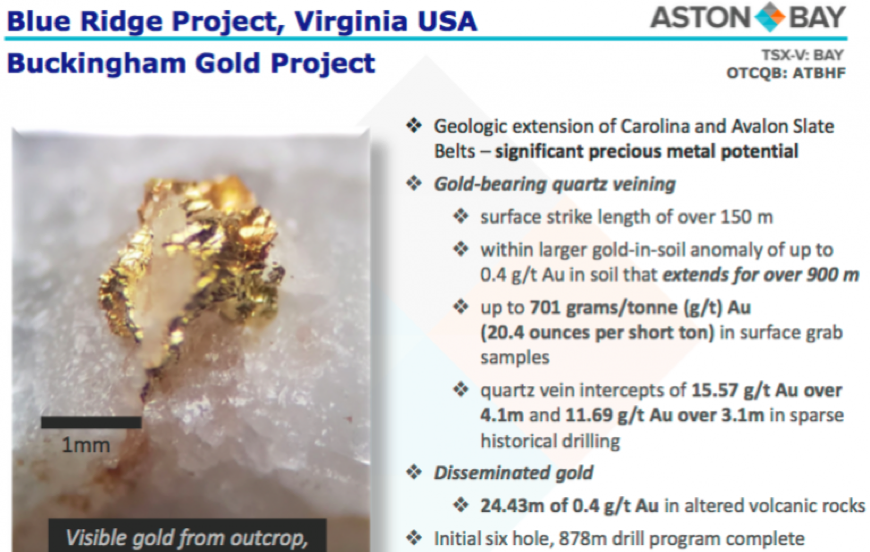
Thomas Ullrich: The results were very encouraging. High-grade gold in quartz veining at surface on private land in a great jurisdiction. This is just the start, we are still waiting on assays from the surrounding rock that may contain significant disseminated gold, like they are now mining at the Haile Gold Mine just 200 miles to the south, a roughly 5M-ounce resource.

Even more encouraging, we have only drilled a very small portion of the land, (where the quartz vein sticks out of the ground). However, this sits within a much larger gold-in-soil anomaly with values of up to 0.4 g/t gold. These are strong results so far, and we believe more positive results are coming out of this program, and future programs, as we step out along strike. We will work to better educate the market on this topic in upcoming news releases.

Peter Epstein: You said in a recent interview that Aston Bay can move quickly, and at low cost, in central Virginia. Cheap and easy compared to what?

Thomas Ullrich: Base and precious metals exploration activities are unregulated in Virginia under what is termed a fee simple jurisdiction for property rights, the maximum aggregate of rights available. Operationally, this means that we can explore, drill and even conduct small scale mining without any permitting required when we have agreements with the timber companies that own prospective grounds.

So, it’s easy and quick to get started without waiting for permits or consultations—quick because the preliminary geological work has already been completed (and Don Taylor has been chewing on the targets for years), and easy and low cost because the timber farms have an extensive road network for truck and track-mounted drill access.

It doesn’t get cheaper and easier, particularly when compared to most areas that have at least one of the “frictions” of exploration, such as drill permitting, land use permits, water use permits, local consultation requirements, access agreements, road building permits, camp building helicopter support, fuel supply lines, etc. . . .the list goes on. We have none of those here in Virginia.

At our Buckingham Gold project, the drill drove right up to the pad just three weeks after signing the land agreement. That was our first drill program in the U.S., so we expect to be even quicker for subsequent programs. The all-in costs for that small program will be less than CA$200/m. We expect we can reduce that figure for future programs.

Peter Epstein: Can you talk about your team’s thoughts on what an enlarged Blue Ridge or Buckingham Gold deposit could potentially contain?

Thomas Ullrich: We will be signing agreements to explore over 11,000 acres of private land in Virginia, looking for base metals (copper, zinc, cobalt) and gold. We feel the property has the potential to host undiscovered belts of base metal deposits, similar to Ducktown and other 10 million-ton-plus deposits of the Copper Basin mined in the early 1900s.

For precious metals, we already have high-grade gold in quartz veins at surface and shallow subsurface at our Buckingham Gold project, and we’re awaiting results for potential disseminated gold mineralization in the surrounding rock. At the Haile Gold Mine 200 miles to the south, OceanaGold Corp. (OGC:TSX; OGC:ASX) is mining similar styles of mineralization from a 5 M-ounce resource. It’s early days, but these are the targets we’re aiming for.

Peter Epstein: Although we touched on a lot of things, to sum up, what are the near-term catalysts for Aston Bay?

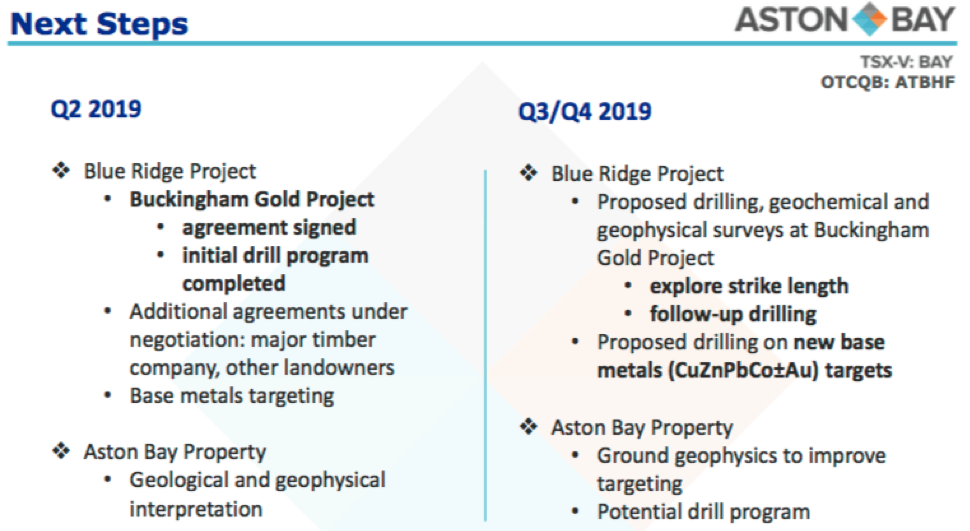
Thomas Ullrich: The remaining results for our Buckingham Gold project should be out in the next few weeks. Soon we will sign a definitive agreement for the much larger parcel of ground covered by our letter of intent with a major forestry company. We will be able to place what is currently a high-grade, albeit currently small gold project, within the context of a much larger gold-in-soil anomaly. Then, we will develop targets and start step-out drilling to see how big the Buckingham Gold project could be.

There’s potential for additional gold deposits and near drill-ready copper-zinc deposits on forestry company ground and in other areas in Virginia, where we are currently in advanced land agreement negotiations. In Nunavut, we hope to complete a modest (low-cost) ground geophysics program that could yield compelling targets for large, high-grade copper and zinc deposits. With the ‘new’ Aston Bay we have a steady flow of exploration and drilling on projects that we believe have the potential for significant discovery in two of the best jurisdictions in the world.

Peter Epstein is the founder of Epstein Research. His background is in company and financial analysis. He holds an MBA degree in financial analysis from New York University’s Stern School of Business.

Sign up for our FREE newsletter at: www.streetwisereports.com/get-news

Peter Epstein’s Disclosures: The content of this interview is for information only. Readers fully understand and agree that nothing contained herein, written by Peter Epstein of Epstein Research [ER], (together, [ER]) about Aston Bay, including but not limited to, commentary, opinions, views, assumptions, reported facts, calculations, etc. is not to be considered implicit or explicit investment advice. Nothing contained herein is a recommendation or solicitation to buy or sell any security. [ER] is not responsible under any circumstances for investment actions taken by the reader. [ER] has never been, and is not currently, a registered or licensed financial advisor or broker/dealer, investment advisor, stockbroker, trader, money manager, compliance or legal officer, and does not perform market making activities. [ER] is not directly employed by any company, group, organization, party or person. The shares of Aston Bay are highly speculative, not suitable for all investors. Readers understand and agree that investments in small cap stocks can result in a 100% loss of invested funds. It is assumed and agreed upon by readers that they will consult with their own licensed or registered financial advisors before making any investment decisions.

At the time this interview was posted, Peter Epstein owned shares in Aston Bay, and it was an advertiser on [ER].

Readers understand and agree that they must conduct their own due diligence above and beyond reading this article. While the author believes he’s diligent in screening out companies that, for any reasons whatsoever, are unattractive investment opportunities, he cannot guarantee that his efforts will (or have been) successful. [ER] is not responsible for any perceived, or actual, errors including, but not limited to, commentary, opinions, views, assumptions, reported facts & financial calculations, or for the completeness of this article or future content. [ER] is not expected or required to subsequently follow or cover events & news, or write about any particular company or topic. [ER] is not an expert in any company, industry sector or investment topic.

Streetwise Reports Disclosure:
1) Peter Epstein’s disclosures are listed above.
2) The following companies mentioned in the article are billboard sponsors of Streetwise Reports: None. Click here for important disclosures about sponsor fees. The information provided above is for informational purposes only and is not a recommendation to buy or sell any security.
3) Statements and opinions expressed are the opinions of the author and not of Streetwise Reports or its officers. The author is wholly responsible for the validity of the statements. The author was not paid by Streetwise Reports for this article. Streetwise Reports was not paid by the author to publish or syndicate this article. Streetwise Reports requires contributing authors to disclose any shareholdings in, or economic relationships with, companies that they write about. Streetwise Reports relies upon the authors to accurately provide this information and Streetwise Reports has no means of verifying its accuracy.

4) The article does not constitute investment advice. Each reader is encouraged to consult with his or her individual financial professional and any action a reader takes as a result of information presented here is his or her own responsibility. By opening this page, each reader accepts and agrees to Streetwise Reports’ terms of use and full legal disclaimer. This article is not a solicitation for investment. Streetwise Reports does not render general or specific investment advice and the information on Streetwise Reports should not be considered a recommendation to buy or sell any security. Streetwise Reports does not endorse or recommend the business, products, services or securities of any company mentioned on Streetwise Reports.
5) From time to time, Streetwise Reports LLC and its directors, officers, employees or members of their families, as well as persons interviewed for articles and interviews on the site, may have a long or short position in securities mentioned. Directors, officers, employees or members of their immediate families are prohibited from making purchases and/or sales of those securities in the open market or otherwise from the time of the interview or the decision to write an article until three business days after the publication of the interview or article. The foregoing prohibition does not apply to articles that in substance only restate previously published company releases.

Graphics provided by the author.

( Companies Mentioned: BAY:TSX.V; ATBHF:OTCQB,
)

EURUSD: pair stabilised around the 45th degree

By Alpari.com

Previous:

On Tuesday the 25th of June, trading on the euro closed down. Initial growth with a lack of volume led to a 68-pip drop. The euro was also pushed in this direction by a resurgent dollar during the US session, which was boosted by comments made by FOMC member James Bullard. He said that now was a good time to lower rates as a precautionary measure, but spoke out against a 50-base-point decrease, signalling that one rate reduction would be enough.

Fed Chair Jerome Powell maintained that the FOMC’s outlook remained positive despite increased uncertainty. Many in the FOMC see good reason for stronger stimulus, but also don’t want to overreact to individual data releases. Powell noted that unemployment is low, the economy is growing, and inflation is approaching its target level.

Day’s news (GMT+3):

  • 11:00 Switzerland: ZEW survey – expectations (Jun).
  • 11:30 UK: BBA mortgage approvals (May).
  • 15:30 US: durable goods orders (May), goods trade balance (May).
  • 17:30 US: EIA crude oil stocks change (21 Jun).

EURUSD H1Current situation:

The euro dropped to the 45th degree just as expected. After the correction to 1.1344, the pair stabilised at around the 1.1353 mark. Taking into account the pricing model and the status of the hourly indicators, I’ve concluded that we should expect the pair to consolidate within a range of 1.1344 to 1.1380 today. If the rate closes the day below the balance line, we can expect the rate to drop to 1.1331. I can’t see it dropping any lower than 1.1300.

Still, we can’t be sure, because a few negative words about China from Donald Trump could be enough to sink some of the risker assets. A recovery to 1.14 will be positive for the bulls. There’s no important news for the euro coming out today.

By Alpari.com