Gold bulls were in full control this week as prices jumped past $1450 for the first time since 2013.
Market expectations over the Federal Reserve cutting interest rates for the first time in over 10 years, Dollar weakness and tensions boosted appetite for Gold this week. With central banks across the globe already cutting interest rates to boost their respective economies, Gold is set to glitter in this low-interest-rate environment.
Focusing on the technical picture, a solid weekly close above $1430 should inspire a move back towards $1450 and $1470, respectively.
Dollar humbled by IMF and Fed doves
It has been another rough and rocky trading week for the Dollar thanks to the International Monetary Fund (IMF) and dovish commentary by Fed officials.
Earlier in the week, the IMF said the US Dollar was overvalued by 6%-12% – ultimately forcing investors to re-evaluate the Dollar’s current valuation. On Thursday, Federal Reserve Bank of New York, President, John Williams, said that central banks must “take swift action when faced with adverse economic conditions” while Federal Reserve Vice Chairman, Richard Clarida, stated that policymakers “don’t need to wait until things get so bad” to have a dramatic series of rate cuts
Such dovish commentary from Fed official’s is reinforcing expectations of a US interest rate cut at the end of this month. The Dollar Index (DXY) remains under pressure on the daily charts with prices trading marginally below 97.00 as of writing. Repeated weakness below 97.00 could open a path lower towards 96.60.
Rocky path ahead for British Pound
The path ahead for the British Pound is filled with obstacles and more pain as concerns mount over the United Kingdom crashing out of the European Union without a Brexit deal.
In latest developments to the Brexit saga, Boris Johnson and Jeremy Hunt have both vowed to reject the Irish border backstop, even if a time limit is set. With the European Union already making it clear that the withdrawal agreement is not open for renegotiations, this latest twist certainly increases the risk of a no-deal Brexit on October 31st.
Sterling remains one of the sick men of the G10 space thanks to Brexit fears, and this continues to be reflected the currency’s overall performance since the start of July. As the clock ticks closer to the EU exit date, the Pound may no longer respond to economic data but only political developments and Brexit newslows.
Given the chronic levels of uncertainty revolving around UK politics and Brexit, this does not bode well for the British Pound which has already weakened to a 27-month low against the Dollar, below 1.24 this week.
Looking at the technical picture, the GBPUSD remains in a downtrend on the daily charts. A move back below 1.2500 should re-open a path towards 1.2420 and 1.2350.
Disclaimer: The content in this article comprises personal opinions and should not be construed as containing personal and/or other investment advice and/or an offer of and/or solicitation for any transactions in financial instruments and/or a guarantee and/or prediction of future performance. ForexTime (FXTM), its affiliates, agents, directors, officers or employees do not guarantee the accuracy, validity, timeliness or completeness, of any information or data made available and assume no liability as to any loss arising from any investment based on the same.
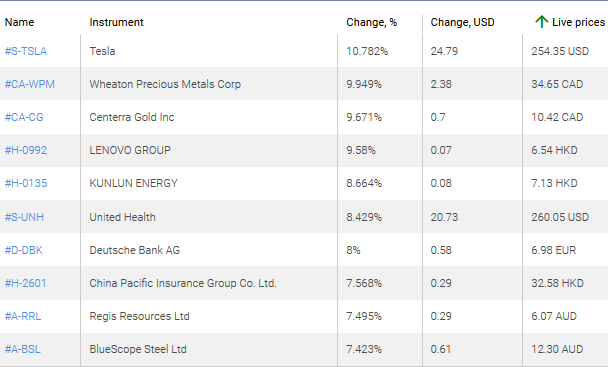
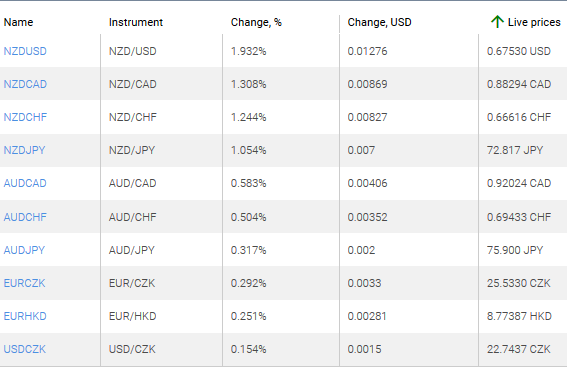
1. NZDUSD, NZDCAD – an increase in this chart indicates the strengthening of the New Zealand dollar against the US and Canadian dollars.
2. NZDCHF, NZDJPY – an increase in this chart shows the strengthening of the New Zealand dollar against the Swiss franc and the Japanese yen.
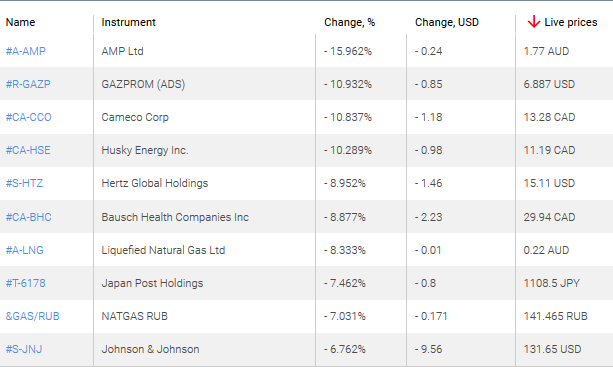
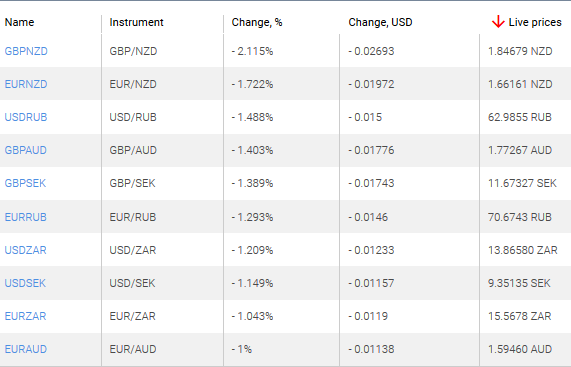
Top Losers – Foreign Exchange Market (Forex)
1. GBPNZD, EURNZD – the decrease in this charts shows the strengthening of the New Zealand dollar against the British pound and the euro.
2. USDRUB, GBPAUD – the decrease in this charts means the strengthening of the Australian dollar against the British pound and the Russian ruble against the US dollar.
Note: This overview has an informative and tutorial character and is published for free. All the data, included in the overview, are received from public sources, recognized as more or less reliable. Moreover, there is no guarantee that the indicated information is full and precise. Overviews are not updated. The whole information in each overview, including opinion, indicators, charts and anything else, is provided only for familiarization purposes and is not financial advice or а recommendation. The whole text and its any part, as well as the charts cannot be considered as an offer to make a deal with any asset. IFC Markets and its employees under any circumstances are not liable for any action taken by someone else during or after reading the overview.
Bob Moriarty of 321 Gold describes the latest developments for this miner.
One of the great pleasures of my job is to revisit companies making solid progress after having done everything they said they would do. I got back a week or so ago from a quick dash to Japan where I got to visit the wonderful team of Irving Resources Inc. (IRV:CSE; IRVRF:OTCBB).
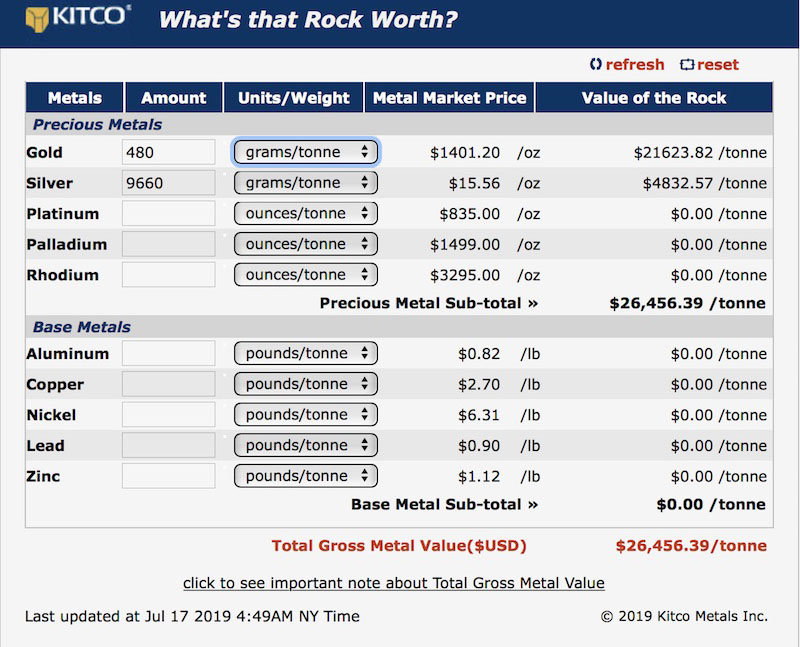
Irving is seven holes into a scout-drilling program. Their brilliant technical team has already hit a discovery hole similar in grade and thickness to the discovery hole of Hishikari, which was on only the second hole. I was talking about Irving over two years ago; after all, they had been reporting $26,456.39 a ton gold over 2.5 years back.
Their shares were $0.85 back then, even after reporting the highest grade samples I have ever seen. That gave them about a $26 million market cap. Guys: This isn’t rocket science. If you can find one $26,456.39-a-ton rock sitting on the ground there are certainly going to be more.
Slow forward to 2019. Irving has done something that no Japanese company could have done. While the Japanese are brilliant, there are no junior gold exploration companies in the country. And Irving has done something that no other Canadian could have done. They have brought in the world’s largest gold mining company as a partner, they have appointed the former Canadian ambassador to Japan as an advisor and made the Omu Sinter project the go-to gold project in Japan. While I was visiting early in July, the wonderful Akiko Levinson, president and CEO, was hosting a group of about 25 members of JOGMEC, the Japan Oil, Gas and Metals National Corporation.
JOGMEC is a government organization responsible for ensuring a stable supply of various resources to Japan through the discovery of economic deposits of base metals as well as precious metals and other rare metals.
I would love to say that the last three years have been a cakewalk for Irving, where Akiko just sauntered in and sunk a few holes and discovered one of the highest-grade gold mines in the world. She and Quinton Hennigh may have done that, but it’s been a long hard slog. They have literally had to reinvent the wheel and fire at the same time. There was no junior exploration going on, no experienced government agencies. Even finding drillers and assistants and core saws has been an adventure in frustration.
I love companies with problems. The bigger the problems, the more I love them. I used to go to all the gold shows to catch up with the new and upcoming metals stories, but it was always the same story.
“We have the most brilliant management team in history. Our technical team has 500 years’ experience and have discovered and put into production 150% of all the mines in the last 50 years. Our worst project is the best discovery in the universe. And, oh, by the way, we don’t have any problems at all. Everything is running as smoothly as a Singer sewing machine.”
Well, I know that’s bull. I have owned and run half a dozen projects and life is pure hell, with everyone involved doing their level best to crater the operation. You have nothing but problems. That’s what people get the big money for.
Everyone except Akiko Levinson, by the way. For the year ended Feb. 28, 2019, management fees totaled CA$171,390. While I was in Hokkaido on the site visit we were in and out of the office with mud on our boots. I looked around and caught Akiko sweeping the floor. If I was ever to recommend a company it would be one in which the CEO is paid peanuts, and has to rely on share appreciation to make money, and picks up a broom and sweeps when the floor is dirty. I love this company.
One of the fun parts of the exploration program is getting the core sawed. You can be in the most remote region of Northern Canada during the dog days of dead winter and get a core saw delivered via FedEx or UPS in two days. Faster if you are willing to pay the overnight premium.
Remember when I said the company had to invent both fire and the wheel at the same time? In Japan people who cut core have to be certified, and there are only a handful. And the sinter rock is, well, it’s rock, really hard rock. It chews through saw blades faster than drunks spend money on Saturday night. They had to order a special high-performance saw from Aussieland. And that takes time.
Quinton keeps getting short hits of high grade; expect some results out in a couple of weeks. But he hasn’t yet hit the mother lode. I thought I would contribute what I could so I brought in the fellow I used to work with to spot holes for me.
As a backup, Newmont Goldcorp Corp. (NEM:NYSE) sent in their crack CSAMT team from Perth to run a survey for Irving. While I am not a giant fan of giant mining companies, they do have access to the best and brightest people in mining. Such was the team from Aussieland.
With CSAMT you lay out a line of electrical wire over the ground and whisper some secret incantation and your computer will tell you where the rocks are. I don’t know why that would be valuable; my monkey can find rocks if that is all you are looking for. In any case Quinton and the CSAMT team agree it’s a highly valuable resource for locating the vein structure.
As far as the practical side of drilling and exploration Quinton, his technical people and the Newmont folks have things under control. One day soon they will tap into the main feeder at the Omu Sinter and the fireworks will begin.
Meanwhile, back at the Omui Mine, there is real news. Back in October of 2018 Irving quietly released a press release that is only taking effect now. They said they had received approval to take bulk samples and ship the material offsite to a smelter. Irving is about to become a producer.
The plan all along has been to skip the milling and processing part and ship the silica-rich rock to some of the numerous smelters in Japan. They would be paid $100 a ton for the rock and 95% of the value of the contained metals. The payment for the flux would offset the price of shipping and 95% recovery is always wonderful.
Irving is in the process of stripping the overburden from the already identified silica veins near the Omui Mine and picking 1,500 tons of rock for the initial test shipment. The ore should be on the ship in August and payment received shortly thereafter. Depending on how easy it will be to identify ore chutes near surface the test bulk mining could soon become a source of funds to continue mining drilling and exploration.
I have always been a fan of both Quinton Hennigh and Akiko Levinson. They make a great team. I am convinced that Irving will remain the leader in exploration and production of gold and silver in Japan. At least until someone takes them out.
The company is well financed and has a major partner. Over 90% of the shares are in strong hands. A big hit would send the shares skyrocketing.
I was an early adopter of Irving and have participated in all of the placements and bought shares in the open market. Due to the current market price, it is my largest holding. Irving is an advertiser and naturally I am biased. Do your own due diligence.
Bob and Barb Moriarty brought 321gold.com to the Internet almost 16 years ago. They later added 321energy.com to cover oil, natural gas, gasoline, coal, solar, wind and nuclear energy. Both sites feature articles, editorial opinions, pricing figures and updates on current events affecting both sectors. Previously, Moriarty was a Marine F-4B and O-1 pilot with more than 832 missions in Vietnam. He holds 14 international aviation records.
Disclosure: 1) Bob Moriarty: I, or members of my immediate household or family, own shares of the following companies mentioned in this article: Irving Resources. My company has a financial relationship with the following companies mentioned in this article: Irving Resources is an advertiser on 321 Gold. I determined which companies would be included in this article based on my research and understanding of the sector. 2) The following companies mentioned are billboard sponsors of Streetwise Reports: None. Click here for important disclosures about sponsor fees. 3) Statements and opinions expressed are the opinions of the author and not of Streetwise Reports or its officers. The author is wholly responsible for the validity of the statements. The author was not paid by Streetwise Reports for this article. Streetwise Reports was not paid by the author to publish or syndicate this article. The information provided above is for informational purposes only and is not a recommendation to buy or sell any security. Streetwise Reports requires contributing authors to disclose any shareholdings in, or economic relationships with, companies that they write about. Streetwise Reports relies upon the authors to accurately provide this information and Streetwise Reports has no means of verifying its accuracy. 4) The article does not constitute investment advice. Each reader is encouraged to consult with his or her individual financial professional and any action a reader takes as a result of information presented here is his or her own responsibility. By opening this page, each reader accepts and agrees to Streetwise Reports’ terms of use and full legal disclaimer. This article is not a solicitation for investment. Streetwise Reports does not render general or specific investment advice and the information on Streetwise Reports should not be considered a recommendation to buy or sell any security. Streetwise Reports does not endorse or recommend the business, products, services or securities of any company mentioned on Streetwise Reports. 5) From time to time, Streetwise Reports LLC and its directors, officers, employees or members of their families, as well as persons interviewed for articles and interviews on the site, may have a long or short position in securities mentioned. Directors, officers, employees or members of their immediate families are prohibited from making purchases and/or sales of those securities in the open market or otherwise from the time of the interview or the decision to write an article until three business days after the publication of the interview or article. The foregoing prohibition does not apply to articles that in substance only restate previously published company releases. As of the date of this article, officers and/or employees of Streetwise Reports LLC (including members of their household) own securities of Irving Resources, a company mentioned in this article.
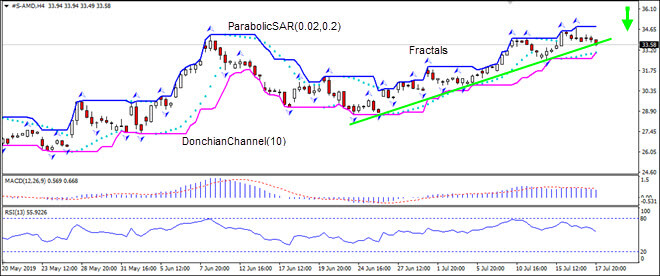
AMD stock has breached below support. Will the AMD price continue declining?
The Advanced Micro Devices is to report Q2 earnings on July 24. In May the U.S. Department of Energy announced that AMD and Cray (NASDAQ:CRAY) had been awarded a $600 million contract to develop the ‘Frontier’ supercomputer to be used for calculations in areas like nuclear and climate research. In Q3 AMD plans to start selling its 7-nanometer (nm) chips. With these smaller and more power-efficient chips, AMD is aiming to take market share from Intel, especially in data center business. Intel’s 10nm chips will not be sold until the end of the year. AMD expects its Q2 gross margin to be 41%, the highest in eight years on revenue about $1.52 billion, a decrease of approximately 13% YoY. Positive news have been priced in however: AMD price has risen over 90% year to date, and high volatility is likely before the earnings report, and any underperformance may result in steep declines.
On the 4-hour timeframe the S-AMD: H4 has breached below the support line, this is bearish.
The Parabolic indicator gives a buy signal.
The Donchian channel indicates uptrend: it is narrowing up.
The MACD indicator gives a bearish signal: it is above the signal line and the gap is narrowing.
The RSI oscillator is falling but has not reached the oversold zone.
We believe the bearish momentum will continue after the price breaches below the fractal low at 32.59. This level can be used as an entry point for placing a pending order to sell. The stop loss can be placed above the fractal high at 34.85. After placing the order, the stop loss is to be moved every day to the next fractal high, following Parabolic signals. Thus, we are changing the expected profit/loss ratio to the breakeven point. If the price meets the stop loss level (34.85) without reaching the order (32.59), we recommend cancelling the order: the market has undergone internal changes which were not taken into account.
The primary reason for the ratingupcoming trial resultsis discussed in an Echelon Wealth Partners report.
In a July 10 research note, analyst Douglas Loe reported that Echelon Wealth Partners bestowed Top Pick status on Antibe Therapeutics Inc. (ATE:TSX.V; ATBPF:OTCQX) ahead of a seminal Phase 2 data readout expected before the end of Q3/19.
Loe specified that the impending results will come from the company’s 360-patient trial evaluating ATB-346 in multiple doses for osteoarthritis pain. ATB-346 is Antibe’s lead drug candidate, a hydrogen sulfide-releasing naproxen derivative. “We are optimistic that the drug can generate measurable and perhaps clinically meaningful efficacy signals at one or more test doses (150, 200 or 250 milligrams, once daily),” in this study, he added.
One aspect of the data Echelon will be looking at when they’re released is whether or not ATB-346 delivers both meaningful pain relief and gastroenterological protection, and does more so than naproxen treatment alone.
“We believe that pending ATB-346 efficacy data could be platform validating for Antibe’s hydrogen sulfide-based drug modification platform and thus could be relevant to future clinical activities for these two secondary assets, and importantly to our investment thesis and valuation down the road,” Loe highlighted.
Those two secondary assets in the company’s pipeline, Loe noted, are ketoprofen analog ATB-352, possibly targeting chronic severe postsurgical pain, and acetylsalicylic acid analog ATB-340, probably targeting stroke prevention and anticoagulation.
Echelon has a Speculative Buy rating and a CA$1.40 per share target price on Antibe. The stock is currently trading at around CA$0.30 per share.
Disclosure: 1) Doresa Banning compiled this article for Streetwise Reports LLC and provides services to Streetwise Reports as an independent contractor. She or members of her household own securities of the following companies mentioned in the article: None. She or members of her household are paid by the following companies mentioned in this article: None. 2) The following companies mentioned in this article are billboard sponsors of Streetwise Reports: None. Click here for important disclosures about sponsor fees. 3) Comments and opinions expressed are those of the specific experts and not of Streetwise Reports or its officers. The information provided above is for informational purposes only and is not a recommendation to buy or sell any security. 4) The article does not constitute investment advice. Each reader is encouraged to consult with his or her individual financial professional and any action a reader takes as a result of information presented here is his or her own responsibility. By opening this page, each reader accepts and agrees to Streetwise Reports’ terms of use and full legal disclaimer. This article is not a solicitation for investment. Streetwise Reports does not render general or specific investment advice and the information on Streetwise Reports should not be considered a recommendation to buy or sell any security. Streetwise Reports does not endorse or recommend the business, products, services or securities of any company mentioned on Streetwise Reports. 5) From time to time, Streetwise Reports LLC and its directors, officers, employees or members of their families, as well as persons interviewed for articles and interviews on the site, may have a long or short position in securities mentioned. Directors, officers, employees or members of their immediate families are prohibited from making purchases and/or sales of those securities in the open market or otherwise from the time of the interview or the decision to write an article until three business days after the publication of the interview or article. The foregoing prohibition does not apply to articles that in substance only restate previously published company releases.
Disclosures from Echelon Wealth Partners, Antibe Therapeutics Inc., July 10, 2019
Echelon Wealth Partners compensates its Research Analysts from a variety of sources. The Research Department is a cost centre and is funded by the business activities of Echelon Wealth Partners including, Institutional Equity Sales and Trading, Retail Sales and Corporate and Investment Banking.
I, Doug Loe, hereby certify that the views expressed in this report accurately reflect my personal views about the subject securities or issuers. I also certify that I have not, am not, and will not receive, directly or indirectly, compensation in exchange for expressing the specific recommendations or views in this report.
Important Disclosures: Is this an issuer related or industry related publication? Issuer.
Does the Analyst or any member of the Analysts household have a financial interest in the securities of the subject issuer? Yes. If Yes: 1) Is it a long or short position? Long Position; and, 2) What type of security is it? Common Shares & Share Purchase Warrants.
Does the Analyst or household member serve as a Director or Officer or Advisory Board Member of the issuer? No
Does Echelon Wealth Partners Inc. or the Analyst have any actual material conflicts of interest with the issuer? No
Does Echelon Wealth Partners Inc. and/or one or more entities affiliated with Echelon Wealth Partners Inc. beneficially own common shares (or any other class of common equity securities) of this issuer which constitutes more than 1% of the presently issued and outstanding shares of the issuer? Yes
During the last 12 months, has Echelon Wealth Partners Inc. provided financial advice to and/or, either on its own or as a syndicate member, participated in a public offering, or private placement of securities of this issuer? Yes
During the last 12 months, has Echelon Wealth Partners Inc. received compensation for having provided investment banking or related services to this Issuer? Yes
Has the Analyst had an onsite visit with the Issuer within the last 12 months? No
Has the Analyst or any Partner, Director or Officer been compensated for travel expenses incurred as a result of an onsite visit with the Issuer within the last 12 months? No
Has the Analyst received any compensation from the subject company in the past 12 months? No
Is Echelon Wealth Partners Inc. a market maker in the issuers securities at the date of this report? No
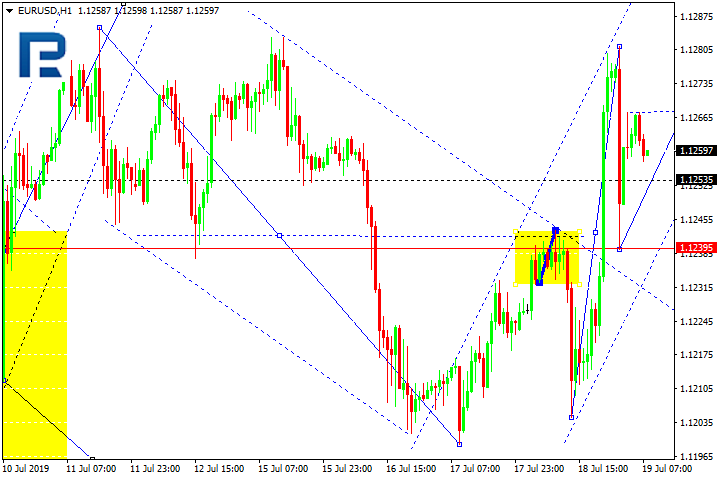
The pair suggests an alternative to hitting 1.1290. Even if this level is overcome, the whole wave may be regarded only as a correction. The main scenario still implies declining to 1.1180.
GBPUSD
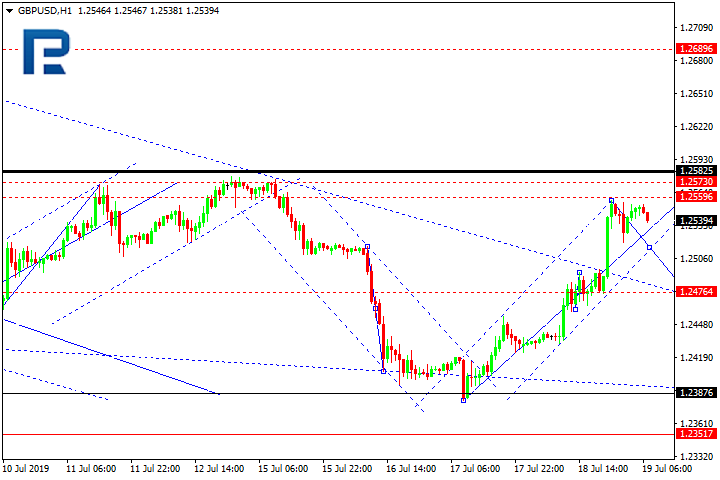
The instrument have amplified the consolidation area upwards and suggests amplification of the correction to 1.2570. Today we are expecting a decline to 1.2470, followed by growth to 1.2570 ad further decline along the trend towards 1.2400.
USDCHF
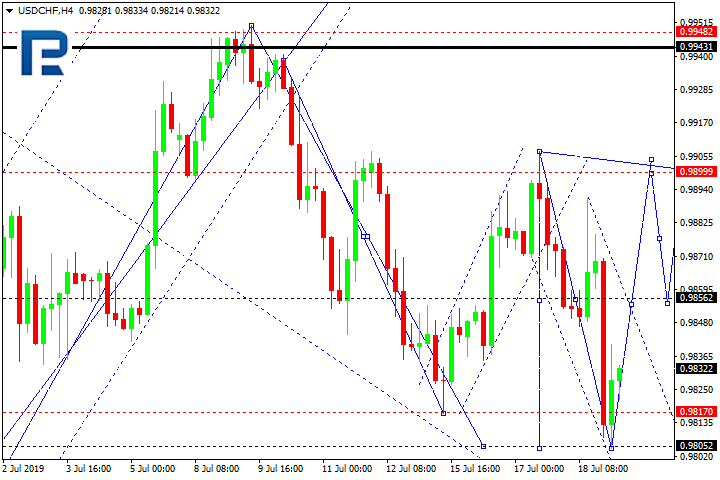
The instrument has formed yet another matrix of decline towards 0.9830. The market is trading in the growth impulse today. The goal is at 0.9860. Upon breaking this level potential for hitting 0.9898 may appear. The aim is first.
USDJPY
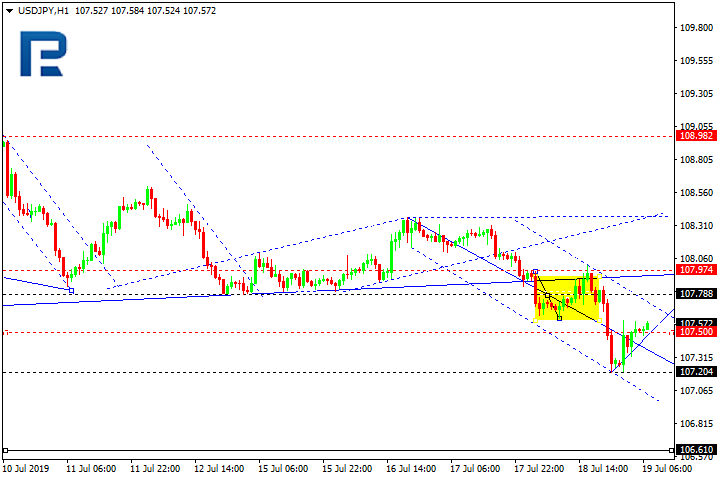
The pair is trading in the impulse for growth. This is regarded as the beginning of a correction. Today the instrument may reach 107.80, at least; then it may decline to 106.62. The goal is first.
AUDUSD
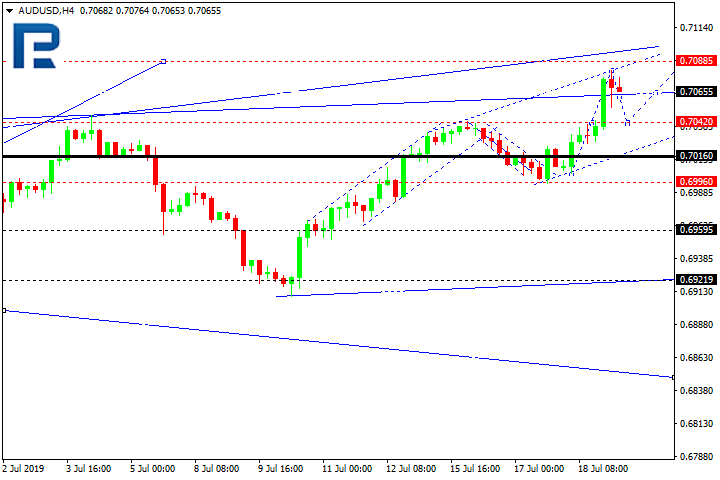
The pair is declining towards 07040 today. Growth to 0.7080 may follow, then another decline to 0.7000. The goal is first.
USDRUB
The instrument keeps trading inside the consolidation area under 63.20. Today a decline to 62.30 looks possible, followed by growth to 64.00.
GOLD
Gold has jumped up and hit 1444.44. Today the market is trading in an impulse for decline. A breakthrough of 1430.00 is possible, which may open the way to 1408.15. The goal is first.
BRENT
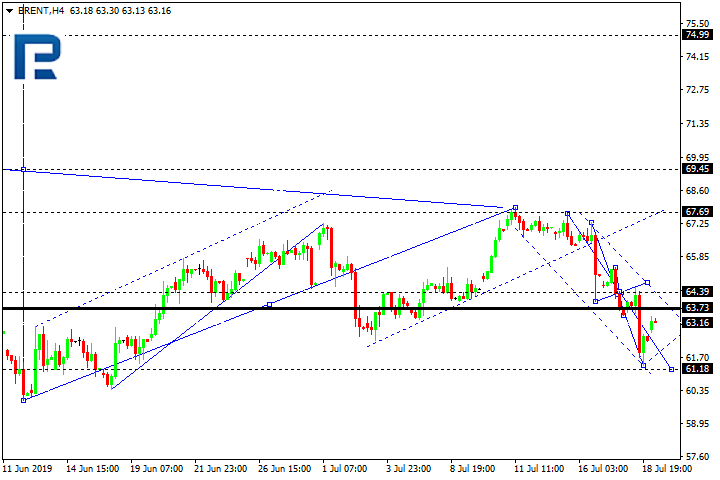
Oil has reached the local goal of the correction at 62.40. Today growth towards 64.40 seems possible, followed by a decline to 61.20 and growth to 65.00. The goal is first.
Attention! Forecasts presented in this section only reflect the author’s private opinion and should not be considered as guidance for trading. RoboForex LP bears no responsibility for trading results based on trading recommendations described in these analytical reviews.
U.S. lawmakers’ stance on cryptocurrencies is out-dated and bordering on negligent, affirms the boss of one of the world’s largest independent financial advisory organizations.
The comments from Nigel Green, founder and CEO of deVere Group, which launched its pioneering cryptocurrency trading app deVere Crypto last year, come after two days of congressional hearings this week to discuss Facebook’s planned digital currency, Libra.
It also follows Bitcoin’s impressive 9 per cent jump on Thursday.
Mr Green affirms: “Many of the lawmakers’ stance on cryptocurrencies – which are almost universally regarded as the future of money – is out-dated and blinkered.
“Some of their comments in the congressional hearings suggest that they think cryptocurrencies are a passing fad. That is delusional.
“The demand for digital, global, borderless currencies is only going to increase. This is inevitable as the digitalisation of our economies and our daily lives grows further and picks up pace further still.”
He continues: “And because demand is set to soar over the next few years as retail and institutional investors pile into crypto, lawmakers now need to embrace them and bring them fully into the mainstream financial system with proper and robust regulation.
“It is bordering on negligent not to do so for three key reasons.
“First, it would provide further protection for the growing number of people using and investing in cryptocurrencies.
“Second, unless the U.S. leads the way in the digital currency revolution, other countries – with perhaps counter values to those of America – will control it and it would be hard to ever take back that control.
“And third, there are enormous potential opportunities for higher economic growth by embracing cryptocurrencies. Why are lawmakers not seizing these with both hands?”
In a similar vein, the deVere CEO slammed President Trump last week when he criticised Bitcoin, the world’s largest cryptocurrency by market capitalisation. At the time he said: “Standing on the sidelines, or worse looking backwards, on the issue of cryptocurrencies – which are redefining and reshaping the financial system – is a baffling approach for the leader of the world’s largest economy to take.”
Mr Green concludes: “Digital currencies are the biggest innovation in payment systems in many decades. Facebook’s jump into the sector is a clear indication of the direction of travel in this regard and lawmakers must not put their heads in the sand and/or attack – that is futile and counterproductive.
“Instead they must work alongside stakeholders to make the market stronger still as investors continue to dive into the likes of Bitcoin, Ethereum, Ripple’s XRP and Litecoin.”
About:
deVere Group is one of the world’s largest independent advisors of specialist global financial solutions to international, local mass affluent, and high-net-worth clients. It has a network of more than 70 offices across the world, over 80,000 clients and $12bn under advisement.
Recently I have been trying to show all the different angles to look at and analyze the US stock market and the precious metals sector. At the end of this report, I will share with you several crucial angles and charts you must see for our self. There are several very intriguing things unfolding right now which are interconnected in ways you may not have known.
Gold Midterm Years and Seasonality
Let’s start off with the price of gold and what it typically does each month during the presidential midterm year, which is this year 2019. The graph below shows the average price movement during the midterm election since 1971 and I think the chart speaks for its self.
What I get from this, is that investors become uncertain with the future and accumulate gold.
This next chart is the seasonality of gold. Meaning which direction gold trades during each month on average every year. This second chart along with the midterm chart above both show gold tends to pull back the second half of July, so don’t be alarmed if it happens.
Dow Jones Midterm Years
The US stock market in general, but in this case, I’m using the Dow Jones industrial average you can see where stock prices should move during the rest of this year as we go into the November election.
Dow Jones Decade Cycle
As you may or may not know, I have a thing with cycles when it comes to trading. Yes, it seems a little far fetched and can be perceived as Voodoo to some people but statistics don’t lie and I have made an incredible living from the financial markets incorporating cycles in all my trades from long term investing right down to my 30-minute trading charts.
The website SeasonalCharts.com shares this really interesting information and chart about the decade cycle and I want to share it with you here:
“The stock market appears to follow a 10-year cycle. During the first half of the decade, equity prices on average do not increase, however in the second half they clearly do. In addition, U.S. equities have demonstrated very good performance in years ending with the number 5 (e.g. 1995 or 2005). Their average profit amounted to 30 %. That equals 40% of the average profit for the entire decade!
The decade-cycle chart of the Dow Jones shows the average 10-year trend of the index over the last more than 100 years.”
As you can see from those four graphs the odds are pointing towards a market top in the US stock market based on statistics and long-term cycles. And for gold to become the investment of choice and rally the second half of this year.
Below are several other eye-opening charts about gold and US equities. You should take a quick look at each because what I’m sharing in this post and links below is more than enough to know where the markets are headed next. No need to look anywhere else and I think you will agree after you review each section. My analysis is logical, proven, and easy to understand the big picture trends no matter if you are a total newbie to the trading and the financial markets.
Top 5 Important Gold And Stock Market Analysis Posts
In early June I posted a detailed video explaining in showing the bottoming formation and gold and where to spot the breakout level, I also talked about crude oil reaching it upside target after a double bottom, and I called short term top in the SP 500 index. This was one of my premarket videos for members it gives you a good taste of what you can expect each and every morning before the Opening Bell. Watch Video Here.
I then posted a detailed report talking about where the next bull and bear markets are and how to identify them. This report focused mainly on the SP 500 index and the gold miners index. My charts compared the 2008 market top and bear market along with the 2019 market prices today. See Comparison Charts Here.
On June 26th I posted that silver was likely to pause for a week or two before it took another run up on June 26. This played out perfectly as well and silver is now head up to our first key price target of $17. See Silver Price Cycle and Analysis.
More recently on July 16th, I warned that the next financial crisis (bear market) was scary close, possibly just a couple weeks away. The charts I posted will make you really start to worry. See Scary Bear Market Setup Charts.
On June 17th I showed my chart of the transportation index forming a double top formation. It’s known that the transportation index leads the broad stock market and if the transports are breaking down then we must expect the bear market is close. I then went on to talk about the precious metals breakout with silver and silver miners leading the way. Gold miners broke out as well while gold continued to hold its bullish formation. See Transportation index double top.
Concluding Thoughts:
In short, you should now have a firm grasp of where stocks are headed along with precious metals for the next few months and beyond. The next step is knowing when and what to buy and sell as these turning points take place, and this is the hard part. If you want someone to guide you through the next 12-24 months complete with detailed market analysis and trade alerts (entry, targets and exit price levels) join my ETF Trading Newsletter.
In short, the bear market has been a long time coming, but finally, almost all the signs are showing that it’s about to start. As a technical analyst since 1997 having lost a fortune and made fortunes from bull and bear markets I have a good understanding of how to best attack the market during its various stages.
Be prepared for these incredible price swings before they happen and learn how you can identify and trade these fantastic trading opportunities in 2019, 2020, and beyond with our Wealth Building & Global Financial Reset Newsletter. You won’t want to miss this big move, folks. As you can see from our research, everything has been setting up for this move for many months – most traders/investors have simply not been looking for it.
Join me with a 1 or 2-year subscription to lock in the lowest rate possible and ride my coattails as I navigate these financial market and build wealth while others lose nearly everything they own during the next financial crisis.
As a technical analysis and trader since 1997, I have been through a few bull/bear market cycles. I believe I have a good pulse on the market and timing key turning points for both short-term swing trading and long-term investment capital. The opportunities starting to present themselves will be life-changing if handled properly.
FREE GOLD or SILVER WITH MEMBERSHIP!
So kill two birds with one stone and subscribe for two years to get yourFREE PRECIOUS METAL and get enough trades to profit through the next metalsbull market and financial crisis!
On H4 the price demonstrates a rather stable descending channel. Upon trying to reach the support line and 50.0% (8600.0) Fibo the quotations developed a local impulse of correction upwards. However, it is too early to speak about the end of the mid-term descending correction. In other words, upon completion of the pullback we may expect another impulse fr declining to the target levels: 50.0% (8600.0) and 61.8% (7370.00).
On H4 the price demonstrates a rather stable descending channel. Upon trying to reach the support line and 50.0% (8600.0) Fibo the quotations developed a local impulse of correction upwards. However, it is too early to speak about the end of the mid-term descending correction. In other words, upon completion of the pullback we may expect another impulse fr declining to the target levels: 50.0% (8600.0) and 61.8% (7370.00).
Ethereum
On H4 the Ethereum demonstrates a bounce off the correction level at 61.8% Fibo, which may b the beginning of a short-term pullback to the resistance level at 38.2% (262.80). After the pullback another descending wave to 76.0% (163.45) may follow.
On H1 the Ethereum shows an ascending trend as a correction. The quotations are heading for 38.2% (236.80) and 61.8% (265.40) Fibo. The support is at the minimum of 190.41.
Attention! Forecasts presented in this section only reflect the author’s private opinion and should not be considered as guidance for trading. RoboForex LP bears no responsibility for trading results based on trading recommendations described in these analytical reviews.
The US dollar fell yesterday against a basket of major currencies after a speech by the head of the Federal Reserve Bank of New York, John Williams. The official said yesterday during the banking conference that in case low rates and inflation, the regulator would have to take the necessary measures to stimulate the economy. Investors took his words as a signal to lower interest rates at the next Fed’s meeting. The US dollar index (#DX) closed yesterday in the red zone (-0.42%).
Despite this, today the US dollar is recovering losses. Positive economic statistics, which was published yesterday, supported the American currency. Thus, the Philadelphia Fed Manufacturing Index counted to 21.8, while experts expected 5.0. The number of initial jobless claims was 216K, which coincided with forecasts. Also, US Treasury Secretary Steven Mnuchin said yesterday that negotiations with China were continuing, and one shouldn’t believe everything the media says. Earlier, some publications have reported that negotiations are actually suspended due to the fact that the US government has not weakened sanctions against Huawei Technologies.
The British pound strengthened against the US dollar. Optimistic economic data in the UK was published yesterday. Thus, the volume of retail sales rose in June by 1.0%, while experts expected a decline by 0.3%. The core retail sales index (yoy) rose by 3.6% in June instead of 2.7%.
The “black gold” prices are rising after lowering the day before. At the moment, futures for WTI crude oil are testing the mark of $55.90 per barrel.
Market Indicators
Yesterday, in the US stock markets, a variety of trends was observed: #SPY (+ 0.37%), #DIA (-0.00%), #QQQ (+ 0.11%).
The yield on 10-year US government bonds is at 2.04-2.05%.
The news feed 2019.07.19:
– The core index of retail sales in Canada is at 15:30 (GMT+3:00); – Michigan consumer sentiment and expactations at 17:00 (GMT+3:00).