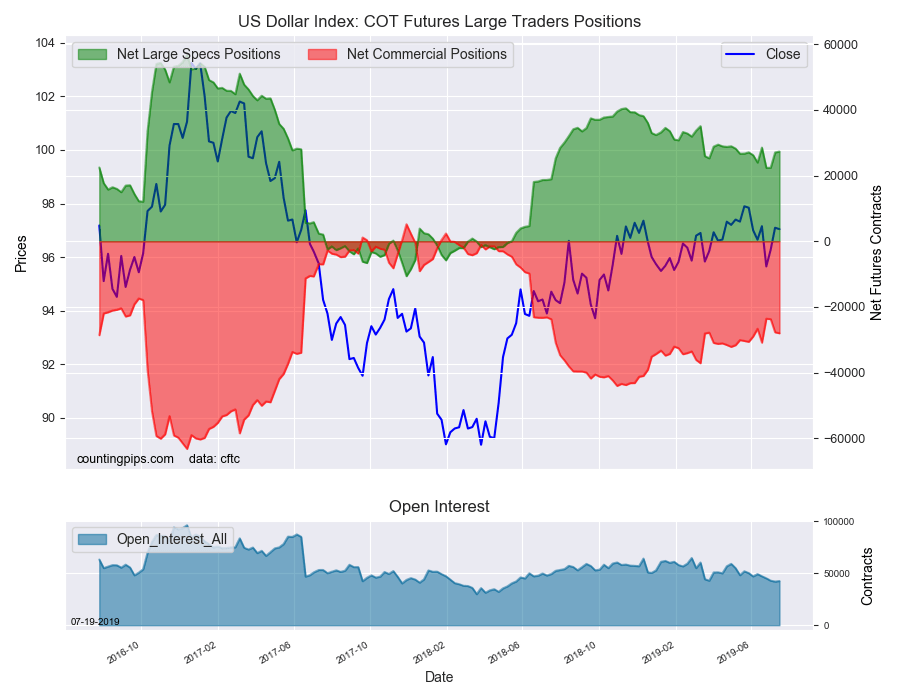
Large currency speculators once again lifted their bullish net positions in the US Dollar Index futures markets this week, according to the latest Commitment of Traders (COT) data released by the Commodity Futures Trading Commission (CFTC) on Friday.
The non-commercial futures contracts of US Dollar Index futures, traded by large speculators and hedge funds, totaled a net position of 27,332 contracts in the data reported through Tuesday July 16th. This was a weekly increase of 276 contracts from the previous week which had a total of 27,056 net contracts.
This week’s net position was the result of the gross bullish position falling by -27 contracts (to a weekly total of 36,452 contracts) while the gross bearish position dropped a little further by -303 contracts for the week (to a total of 9,120 contracts) .
Large currency speculators pushed their bullish bets for the US Dollar index higher for a third consecutive week and for the fourth time in the past five weeks. The US dollar index positions have remained in bullish territory now for sixty-two straight weeks and have continued to stay above the +20,000 net contract level for the past fifty-two weeks.
Individual Currencies Data this week:
In the other major currency contracts data, we saw just one substantial change (+ or – 10,000 contracts) in the speculators category this week.
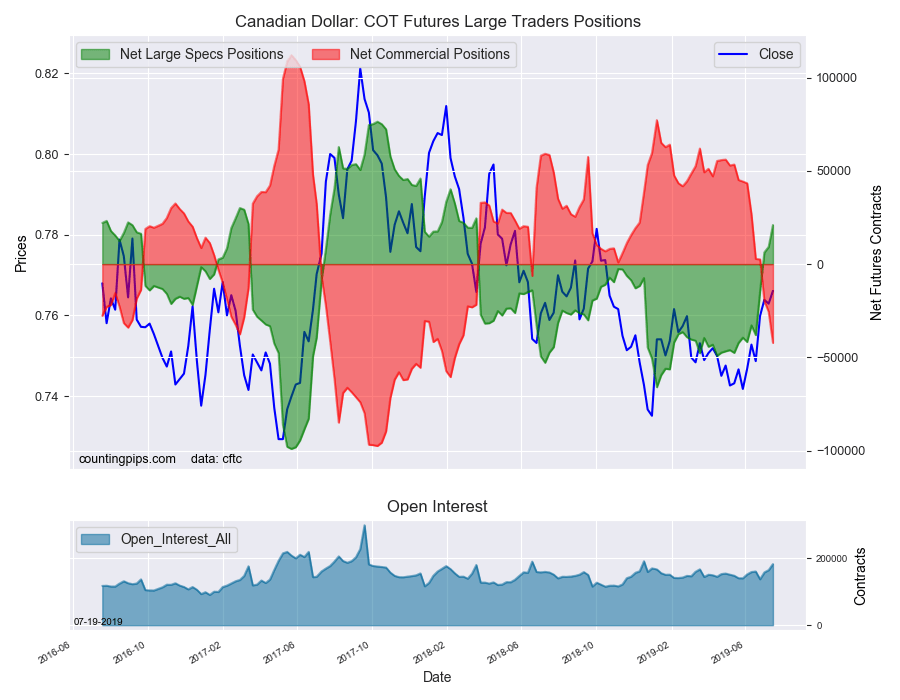
Canadian dollar speculator positions jumped again this week as CAD bets have now gained for four straight weeks and by a total of +59,035 contracts in that period. The spec bets have risen by at least +11,000 contracts in three out of the past four weeks. The current bullish standing is at the highest level since February 13th of 2018 (a span of 74 weeks). Prior to turning bullish a couple of weeks ago, the CAD speculator position had been in bearish territory for sixty-six consecutive weeks dating back to March of 2018.
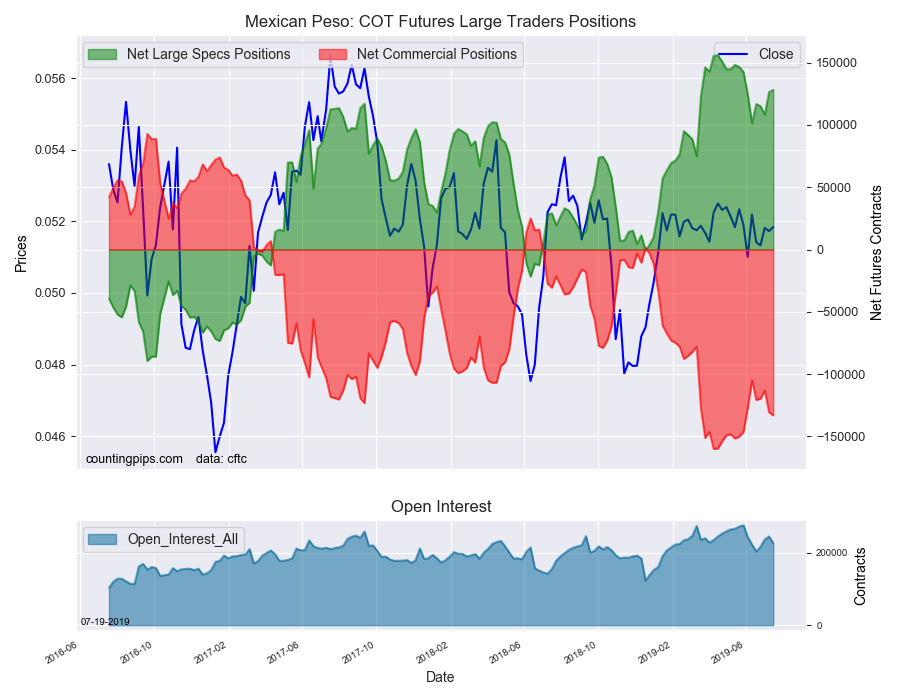
Overall, the major currencies that saw improving speculator positions this week were the US dollar index (276 weekly change in contracts), euro (4,514 contracts), Canadian dollar (11,738 contracts), Australian dollar (1,431 contracts), New Zealand dollar (4,886 contracts) and the Mexican peso (1,739 contracts)..
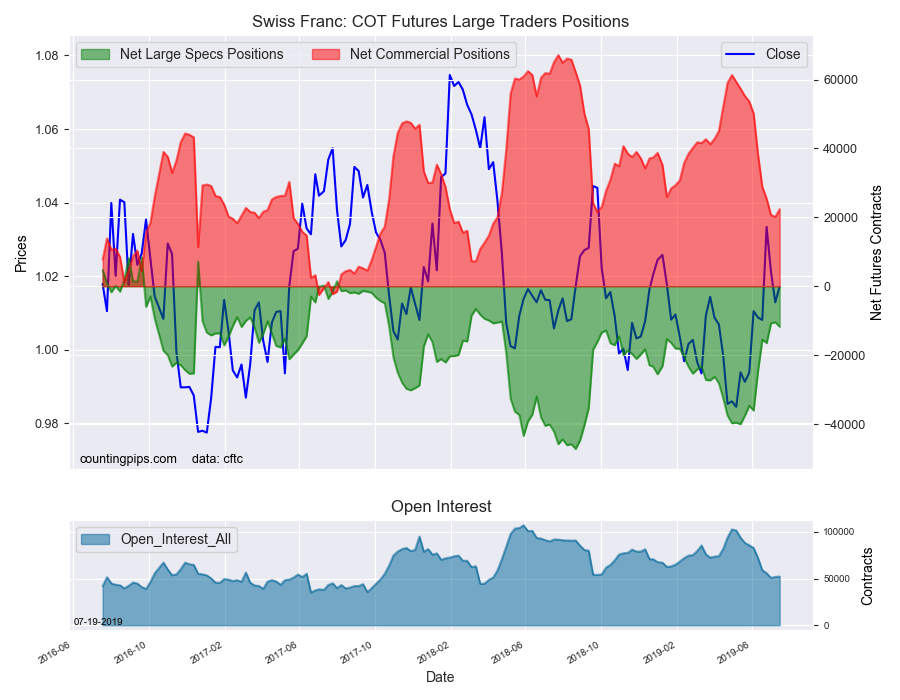
The currencies whose speculative bets declined this week were the British pound sterling (-3,375 weekly change in contracts), Japanese yen (-7,729 contracts) and the Swiss franc (-1,304 contracts).
Other Notables for the week:
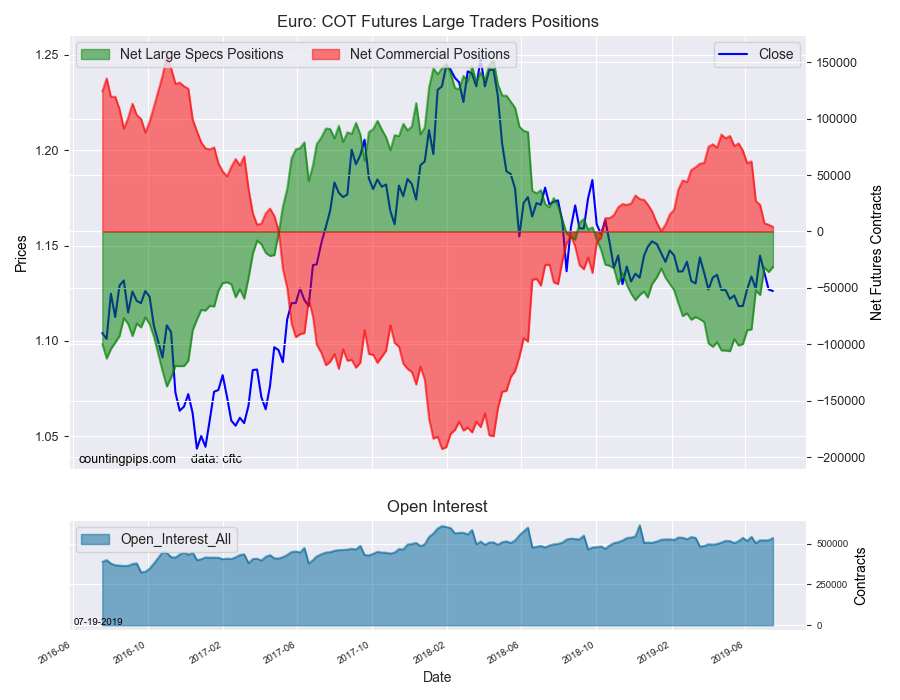
Euro speculators continued to trim their bearish bets this week for the sixth time in the past eight weeks. Speculator positions have now gone from over -100,000 contracts on May 21st to -31,351 contracts this week. This current standing for speculative positions is the lowest bearish level since October 30th of 2018.
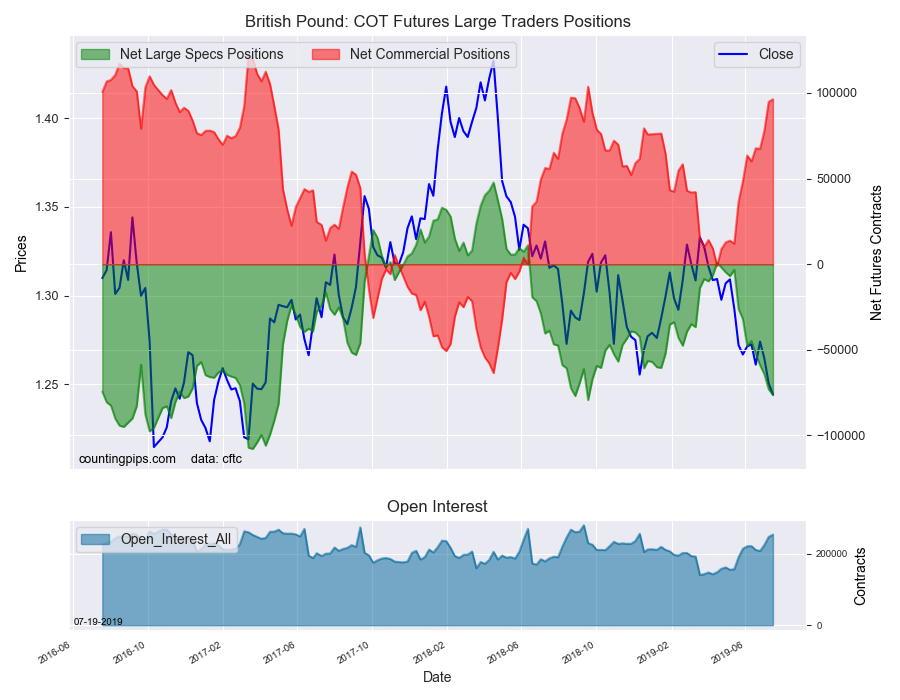
Speculators once again added to their bearish bets for the British pound sterling for a fifth straight week. The GBP speculator positions had been in bearish territory from June of 2018 until April 16th 2019 when bets landed in a small bullish position of just 922 contracts. Since then, however, speculator sentiment soured again and has not looked back with positions going from 922 contracts on April 16th to a total of -76,357 contracts this week in just a span of fourteen weeks.
See the table and individual currency charts below.
Table of Large Speculator Levels & Weekly Changes:
Currency
Net Speculator Position
Specs Weekly Change
USD Index
27,332
276
EuroFx
-31,351
4,514
GBP
-76,357
-3,375
JPY
-11,380
-7,729
CHF
-11,732
-1,304
CAD
20,964
11,738
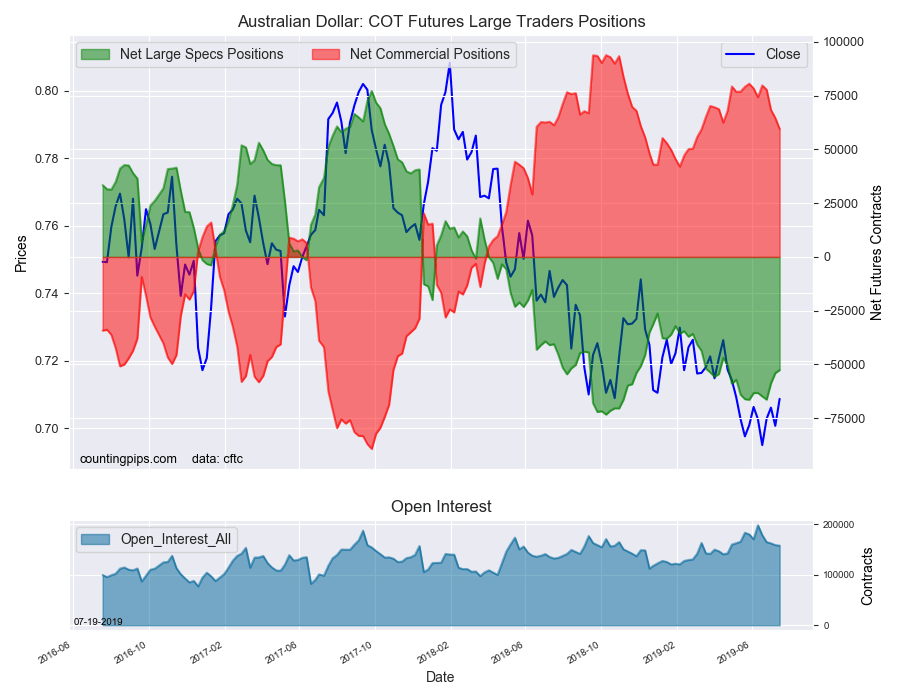
AUD
-52,576
1,431
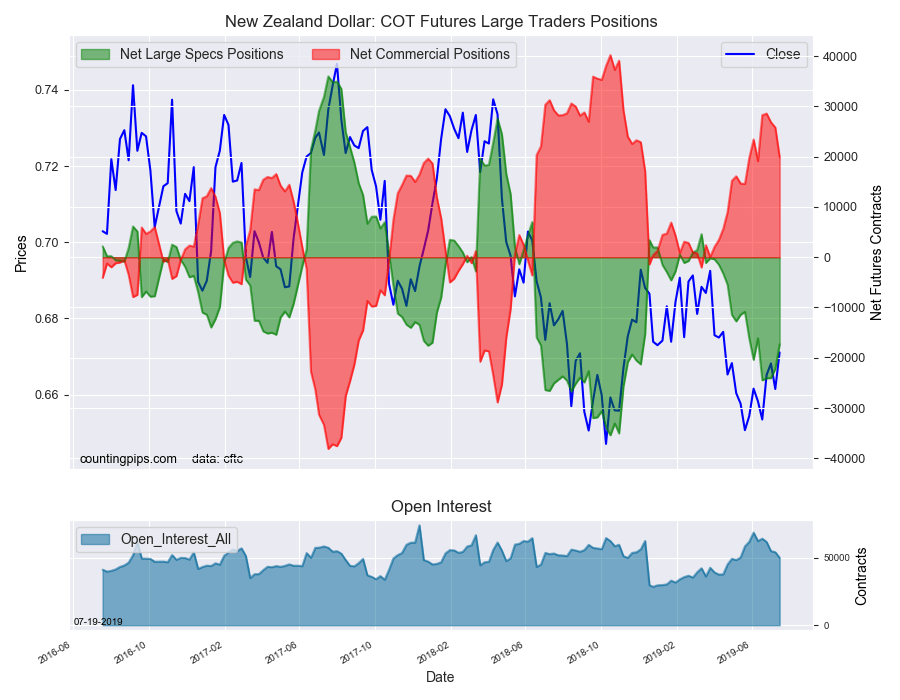
NZD
-17,319
4,886
MXN
128,121
1,739
This latest COT data is through Tuesday and shows a quick view of how large speculators or non-commercials (for-profit traders) were positioned in the futures markets. All currency positions are in direct relation to the US dollar where, for example, a bet for the euro is a bet that the euro will rise versus the dollar while a bet against the euro will be a bet that the dollar will gain versus the euro.
Weekly Charts: Large Trader Weekly Positions vs Price
EuroFX:
The Euro large speculator standing this week totaled a net position of -31,351 contracts in the data reported through Tuesday. This was a weekly advance of 4,514 contracts from the previous week which had a total of -35,865 net contracts.
British Pound Sterling:
The large British pound sterling speculator level came in at a net position of -76,357 contracts in the data reported this week. This was a weekly fall of -3,375 contracts from the previous week which had a total of -72,982 net contracts.
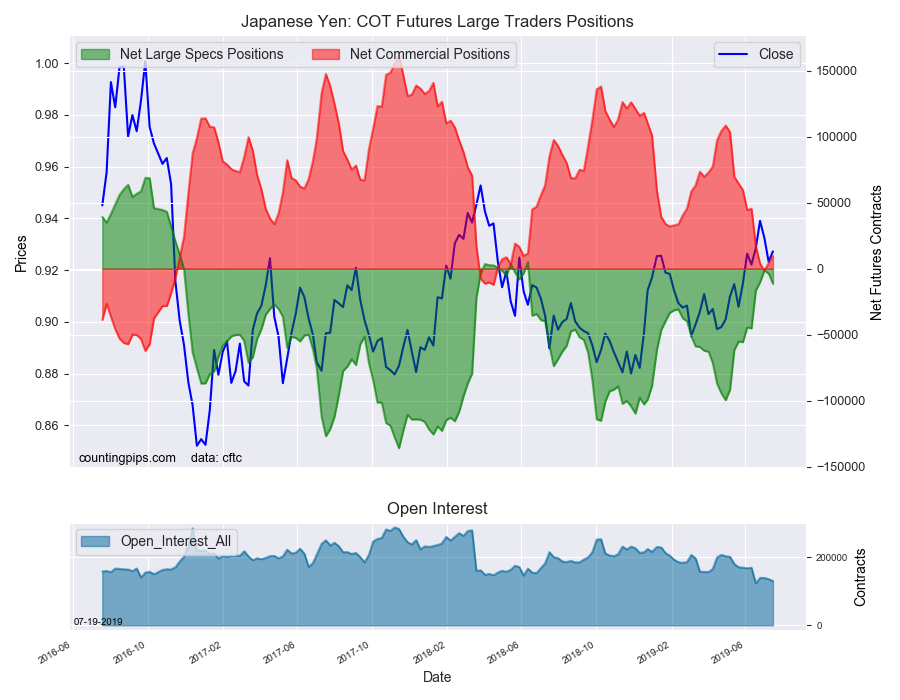
Japanese Yen:
Large Japanese yen speculators equaled a net position of -11,380 contracts in this week’s data. This was a weekly decline of -7,729 contracts from the previous week which had a total of -3,651 net contracts.
Swiss Franc:
The Swiss franc speculator standing this week came in at a net position of -11,732 contracts in the data through Tuesday. This was a weekly reduction of -1,304 contracts from the previous week which had a total of -10,428 net contracts.
Canadian Dollar:
Canadian dollar speculators came in at a net position of 20,964 contracts this week. This was a boost of 11,738 contracts from the previous week which had a total of 9,226 net contracts.
Australian Dollar:
The large speculator positions in Australian dollar futures recorded a net position of -52,576 contracts this week in the data ending Tuesday. This was a weekly boost of 1,431 contracts from the previous week which had a total of -54,007 net contracts.
New Zealand Dollar:
The New Zealand dollar speculative standing totaled a net position of -17,319 contracts this week in the latest COT data. This was a weekly lift of 4,886 contracts from the previous week which had a total of -22,205 net contracts.
Mexican Peso:
Mexican peso speculators totaled a net position of 128,121 contracts this week. This was a weekly rise of 1,739 contracts from the previous week which had a total of 126,382 net contracts.
*COT Report: The COT data, released weekly to the public each Friday, is updated through the most recent Tuesday (data is 3 days old) and shows a quick view of how large speculators or non-commercials (for-profit traders) were positioned in the futures markets.
The CFTC categorizes trader positions according to commercial hedgers (traders who use futures contracts for hedging as part of the business), non-commercials (large traders who speculate to realize trading profits) and nonreportable traders (usually small traders/speculators).
Large energy speculators boosted their bullish net positions in the WTI Crude Oil futures markets this week, according to the latest Commitment of Traders (COT) data released by the Commodity Futures Trading Commission (CFTC) on Friday.
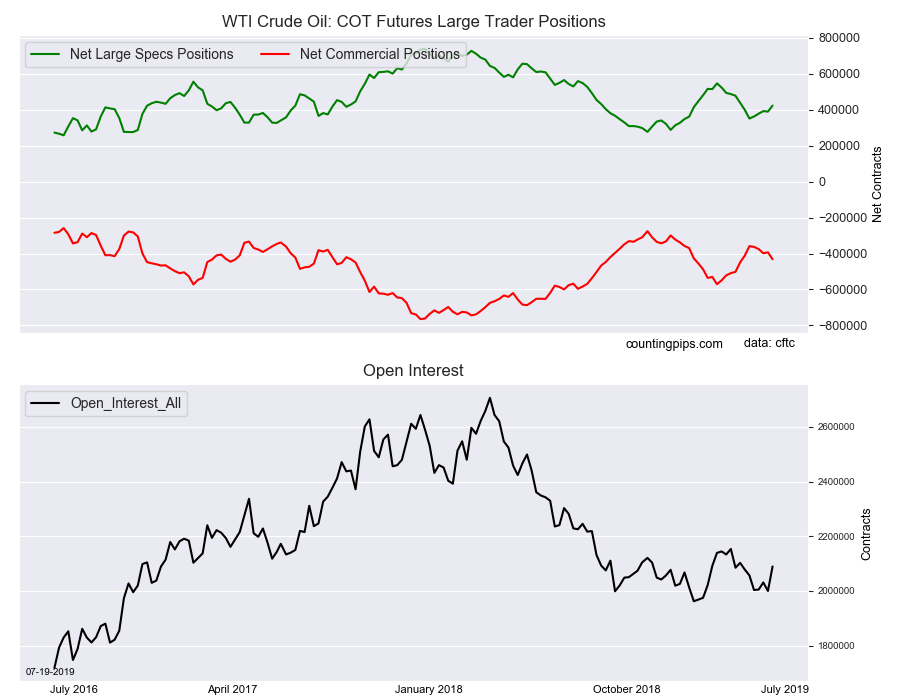
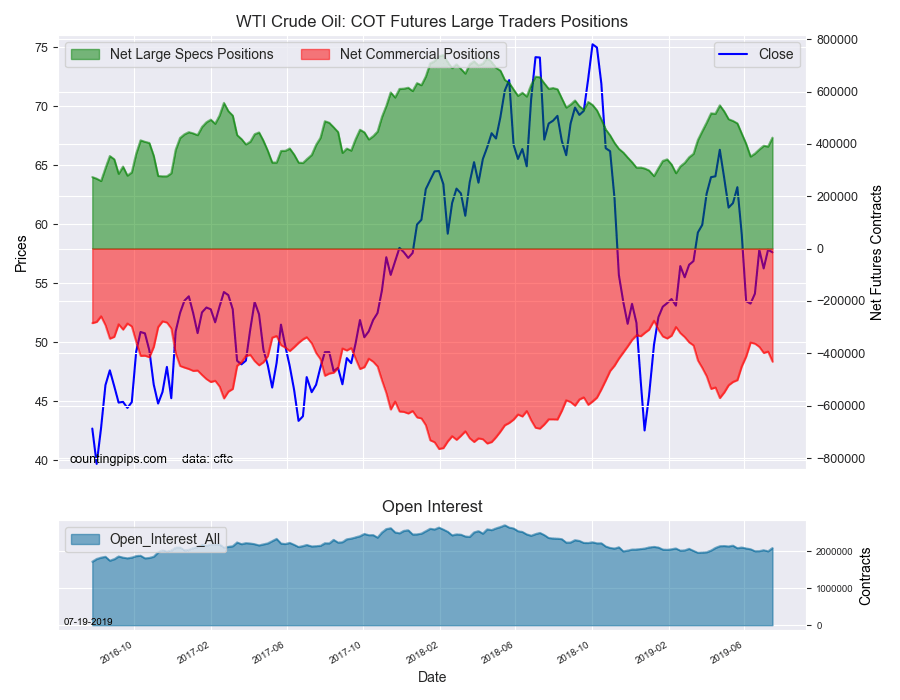
The non-commercial futures contracts of WTI Crude Oil futures, traded by large speculators and hedge funds, totaled a net position of 423,762 contracts in the data reported through Tuesday July 16th. This was a weekly rise of 33,613 net contracts from the previous week which had a total of 390,149 net contracts.
The week’s net position was the result of the gross bullish position (longs) advancing by 39,788 contracts (to a weekly total of 545,484 contracts) while the gross bearish position (shorts) rose by just 6,175 contracts for the week (to a total of 121,722 contracts).
Speculative bullish positions have now gained in four out of the past five weeks and by a total of +72,107 contracts in that period. Prior to this recent streak of gains, the speculator positions had dropped for seven straight weeks and by a total of -195,704 contracts before turning around.
The current bullish standing is now back above the +400,000 net contract position for the first time since June 4th.
WTI Crude Oil Commercial Positions:
The commercial traders position, hedgers or traders engaged in buying and selling for business purposes, totaled a net position of -431,546 contracts on the week. This was a weekly decline of -38,579 contracts from the total net of -392,967 contracts reported the previous week.
WTI Crude Oil Futures:
Over the same weekly reporting time-frame, from Tuesday to Tuesday, the WTI Crude Oil Futures (Front Month) closed at approximately $57.62 which was a decrease of $-0.21 from the previous close of $57.83, according to unofficial market data.
*COT Report: The COT data, released weekly to the public each Friday, is updated through the most recent Tuesday (data is 3 days old) and shows a quick view of how large speculators or non-commercials (for-profit traders) as well as the commercial traders (hedgers & traders for business purposes) were positioned in the futures markets.
The CFTC categorizes trader positions according to commercial hedgers (traders who use futures contracts for hedging as part of the business), non-commercials (large traders who speculate to realize trading profits) and nonreportable traders (usually small traders/speculators).
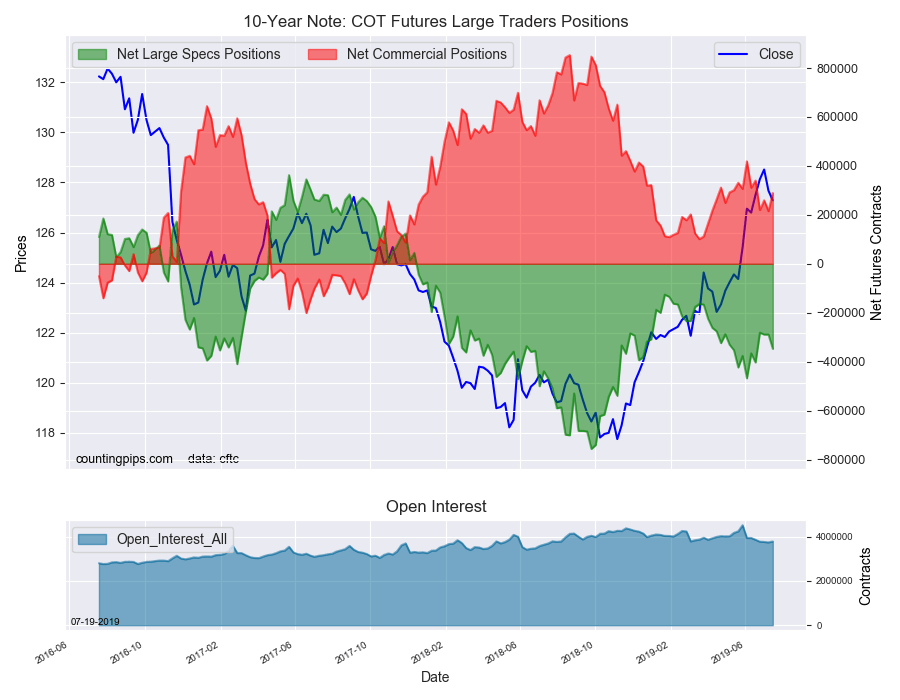
Large bond speculators raised their bearish net positions in the 10-Year Note futures markets this week, according to the latest Commitment of Traders (COT) data released by the Commodity Futures Trading Commission (CFTC) on Friday.
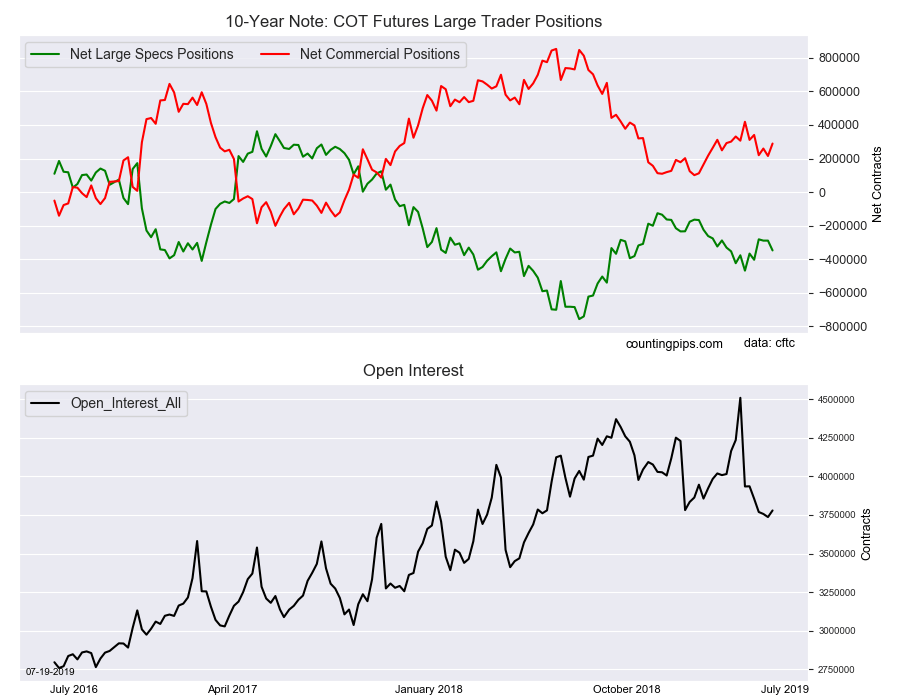
The non-commercial futures contracts of 10-Year Note futures, traded by large speculators and hedge funds, totaled a net position of -347,222 contracts in the data reported through Tuesday July 16th. This was a weekly change of -58,386 net contracts from the previous week which had a total of -288,836 net contracts.
The week’s net position was the result of the gross bullish position (longs) falling by -1,435 contracts (to a weekly total of 680,971 contracts) while the gross bearish position (shorts) jumped by 56,951 contracts for the week (to a total of 1,028,193 contracts).
Large speculators added to their existing bearish positions by the most in six weeks and pushed the current bearish standing above the -300,000 net contract level for the first time in a month.
Speculators are usually reliable trend-followers and momentum traders but have been betting against higher 10-year bond prices in recent months despite prices go higher.
10-Year Note Commercial Positions:
The commercial traders position, hedgers or traders engaged in buying and selling for business purposes, totaled a net position of 289,324 contracts on the week. This was a weekly advance of 74,147 contracts from the total net of 215,177 contracts reported the previous week.
10-Year Note Futures:
Over the same weekly reporting time-frame, from Tuesday to Tuesday, the 10-Year Note Futures (Front Month) closed at approximately $127.28 which was a fall of $-0.39 from the previous close of $127.67, according to unofficial market data.
*COT Report: The COT data, released weekly to the public each Friday, is updated through the most recent Tuesday (data is 3 days old) and shows a quick view of how large speculators or non-commercials (for-profit traders) as well as the commercial traders (hedgers & traders for business purposes) were positioned in the futures markets.
The CFTC categorizes trader positions according to commercial hedgers (traders who use futures contracts for hedging as part of the business), non-commercials (large traders who speculate to realize trading profits) and nonreportable traders (usually small traders/speculators).
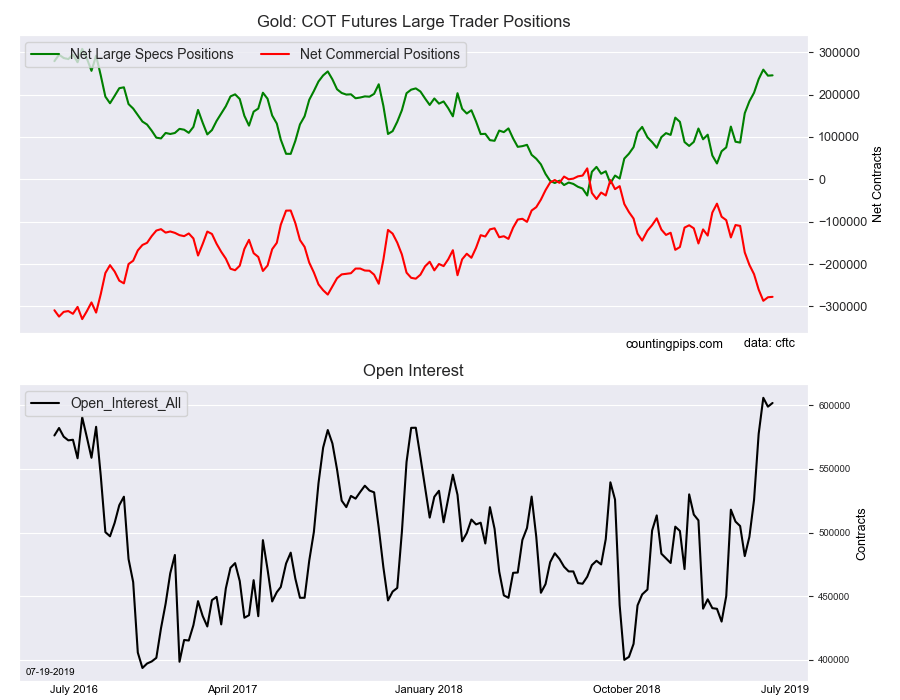
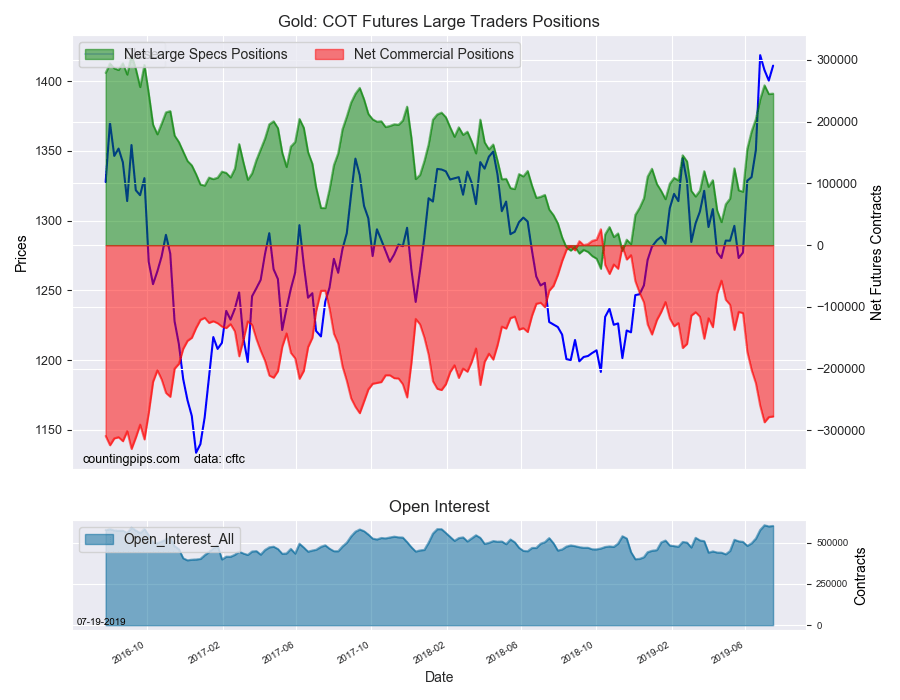
Large precious metals speculators increased their bullish net positions in the Gold futures markets this week after a down week last week, according to the latest Commitment of Traders (COT) data released by the Commodity Futures Trading Commission (CFTC) on Friday.
The non-commercial futures contracts of Gold futures, traded by large speculators and hedge funds, totaled a net position of 245,501 contracts in the data reported through Tuesday July 16th. This was a weekly rise of 738 net contracts from the previous week which had a total of 244,763 net contracts.
The week’s net position was the result of the gross bullish position (longs) advancing by 3,430 contracts (to a weekly total of 309,535 contracts) while the gross bearish position (shorts) rose by 2,692 contracts for the week (to a total of 64,034 contracts).
Large speculators edged their bullish bets higher after a pull back (-14,183 contracts) last week. The trend for bullish bets has been sharply higher since May 28th when the net positions had fallen to a total of +86,688 contracts. Since then, bullish bets have risen by a total of 158,813 contracts (a weekly average gain above +20,000 contracts) as positions have increased for six out of the past seven weeks to a total above +240,000 net contracts.
Gold Commercial Positions:
The commercial traders position, hedgers or traders engaged in buying and selling for business purposes, totaled a net position of -277,408 contracts on the week. This was a weekly gain of 1,008 contracts from the total net of -278,416 contracts reported the previous week.
Gold Futures:
Over the same weekly reporting time-frame, from Tuesday to Tuesday, the Gold Futures (Front Month) closed at approximately $1411.20 which was an advance of $10.70 from the previous close of $1400.50, according to unofficial market data.
*COT Report: The COT data, released weekly to the public each Friday, is updated through the most recent Tuesday (data is 3 days old) and shows a quick view of how large speculators or non-commercials (for-profit traders) as well as the commercial traders (hedgers & traders for business purposes) were positioned in the futures markets.
The CFTC categorizes trader positions according to commercial hedgers (traders who use futures contracts for hedging as part of the business), non-commercials (large traders who speculate to realize trading profits) and nonreportable traders (usually small traders/speculators).
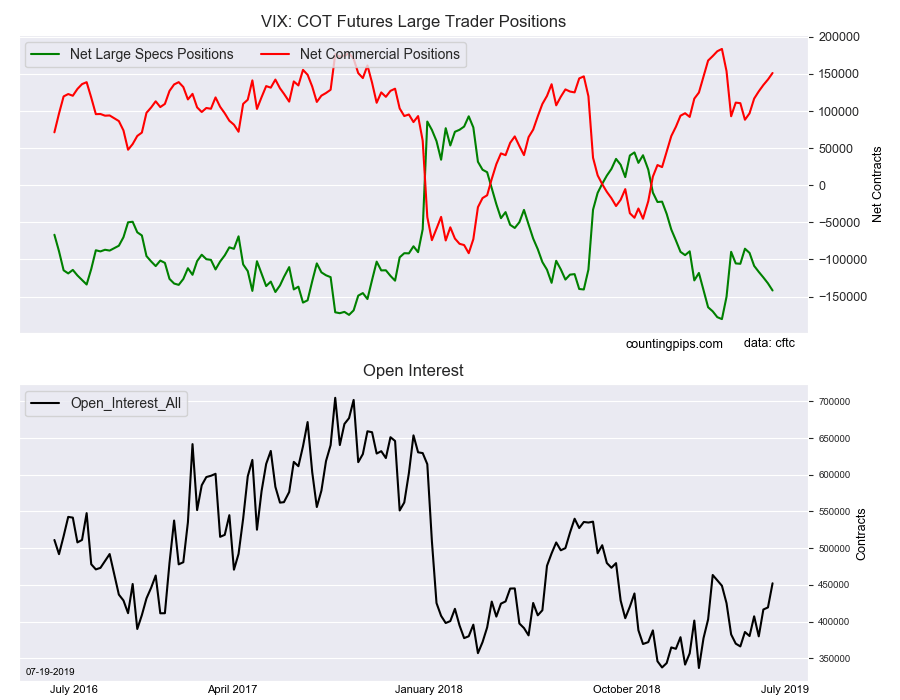
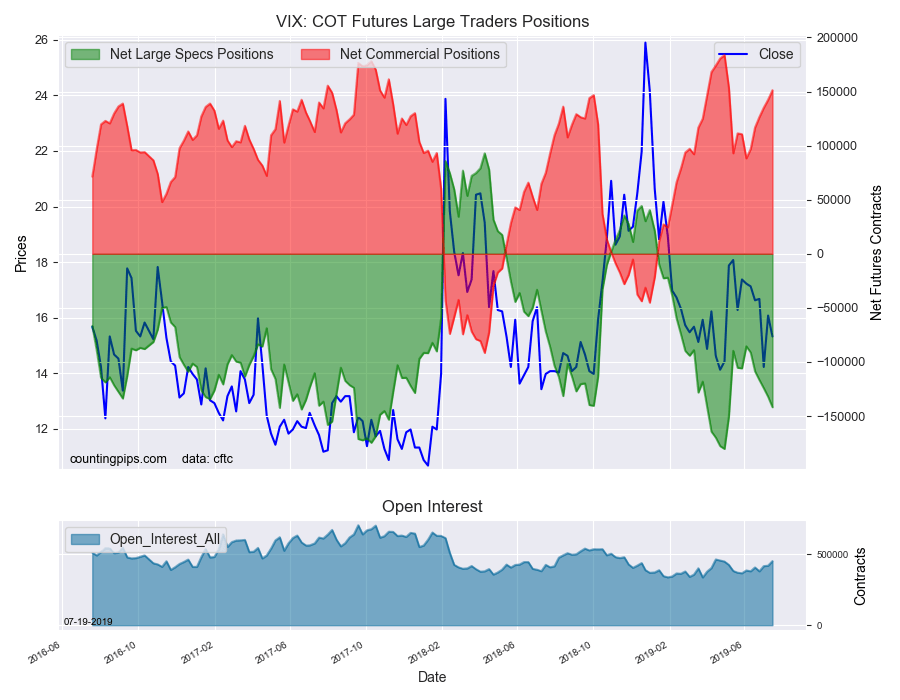
Large volatility speculators added to their bearish net positions in the VIX futures markets this week, according to the latest Commitment of Traders (COT) data released by the Commodity Futures Trading Commission (CFTC) on Friday.
The non-commercial futures contracts of VIX futures, traded by large speculators and hedge funds, totaled a net position of -141,797 contracts in the data reported through Tuesday July 16th. This was a weekly change of -9,615 net contracts from the previous week which had a total of -132,182 net contracts.
The week’s net position was the result of the gross bullish position (longs) growing by 12,879 contracts (to a weekly total of 113,796 contracts) but being more than overcome by the gross bearish position (shorts) which gained by 22,494 contracts for the week (to a total of 255,593 contracts).
The large speculators continue to keep pushing their bearish bets higher and betting on lower volatility. Spec bearish positions have now risen for six straight weeks (by a total of -56,287 contracts) and for eight out of the past nine weeks.
The current bearish standing is at the highest level since May 7th which was one week after the all-time record high bearish position of -180,359 net contracts.
VIX Commercial Positions:
The commercial traders position, hedgers or traders engaged in buying and selling for business purposes, totaled a net position of 151,284 contracts on the week. This was a weekly increase of 8,792 contracts from the total net of 142,492 contracts reported the previous week.
VIX Futures:
Over the same weekly reporting time-frame, from Tuesday to Tuesday, the VIX Futures (Front Month) closed at approximately $15.32 which was a decrease of $-0.75 from the previous close of $16.07, according to unofficial market data.
*COT Report: The COT data, released weekly to the public each Friday, is updated through the most recent Tuesday (data is 3 days old) and shows a quick view of how large speculators or non-commercials (for-profit traders) as well as the commercial traders (hedgers & traders for business purposes) were positioned in the futures markets.
The CFTC categorizes trader positions according to commercial hedgers (traders who use futures contracts for hedging as part of the business), non-commercials (large traders who speculate to realize trading profits) and nonreportable traders (usually small traders/speculators).
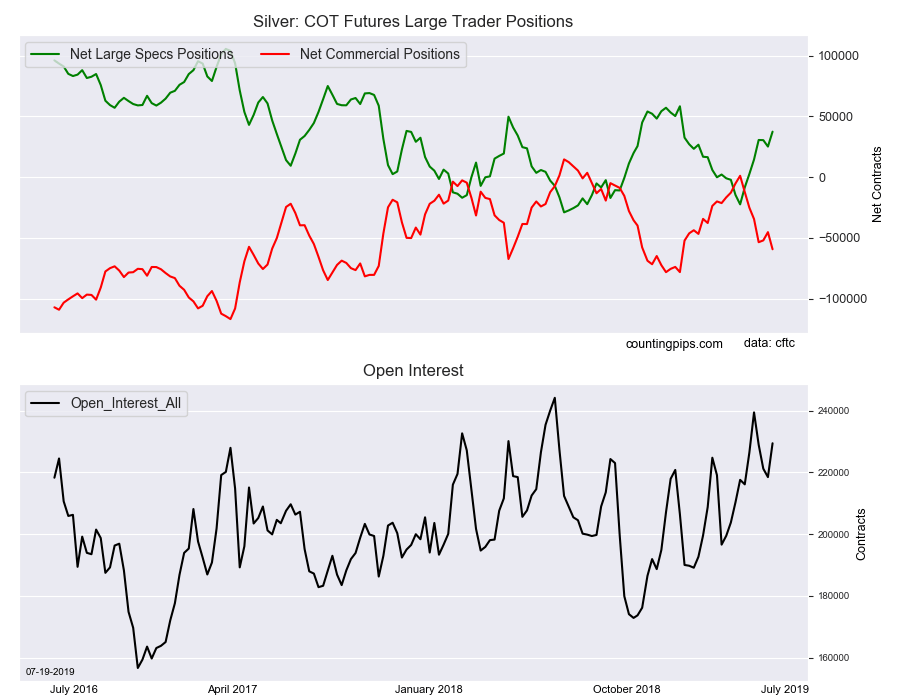
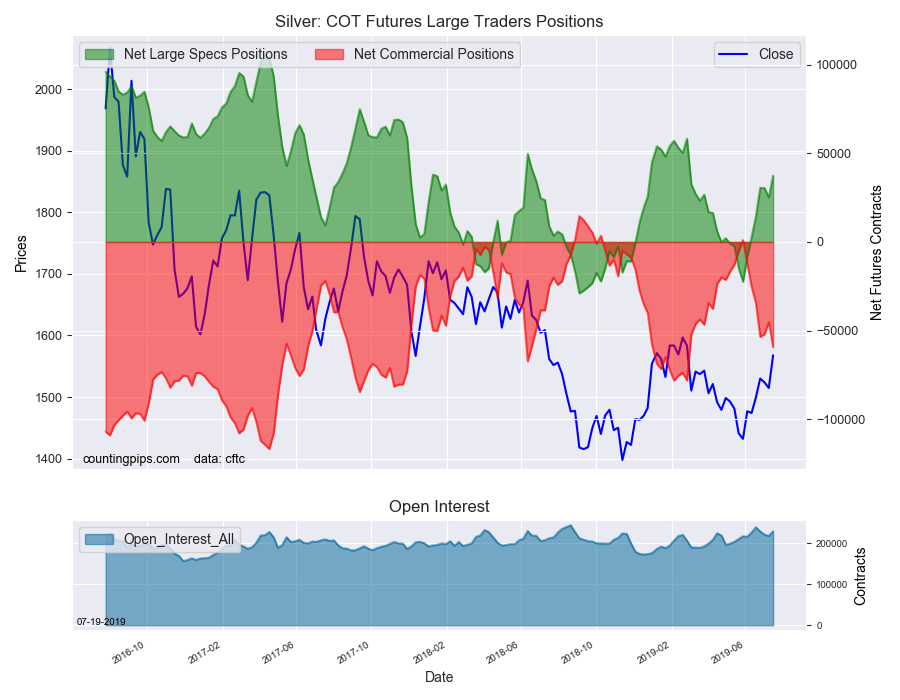
Large precious metals speculators sharply increased their bullish net positions in the Silver futures markets this week, according to the latest Commitment of Traders (COT) data released by the Commodity Futures Trading Commission (CFTC) on Friday.
The non-commercial futures contracts of Silver futures, traded by large speculators and hedge funds, totaled a net position of 37,425 contracts in the data reported through Tuesday July 16th. This was a weekly increase of 12,274 net contracts from the previous week which had a total of 25,151 net contracts.
The week’s net position was the result of the gross bullish position (longs) increasing by 4,369 contracts (to a weekly total of 100,449 contracts) while the gross bearish position (shorts) declined by -7,905 contracts for the week (to a total of 63,024 contracts).
Large speculators had decreased their bullish bets in the previous two weeks before this week’s rebound. The Silver speculative bets have been on a strong uptrend since June 4th that has taken the net position from bearish territory (-8,443 contracts) to a bullish position of more than +37,000 net contracts. The current standing is now at the highest level since February of this year.
Silver Commercial Positions:
The commercial traders position, hedgers or traders engaged in buying and selling for business purposes, totaled a net position of -59,357 contracts on the week. This was a weekly drop of -14,080 contracts from the total net of -45,277 contracts reported the previous week.
Silver Futures:
Over the same weekly reporting time-frame, from Tuesday to Tuesday, the Silver Futures (Front Month) closed at approximately $1567.80 which was an uptick of $53.10 from the previous close of $1514.70, according to unofficial market data.
*COT Report: The COT data, released weekly to the public each Friday, is updated through the most recent Tuesday (data is 3 days old) and shows a quick view of how large speculators or non-commercials (for-profit traders) as well as the commercial traders (hedgers & traders for business purposes) were positioned in the futures markets.
The CFTC categorizes trader positions according to commercial hedgers (traders who use futures contracts for hedging as part of the business), non-commercials (large traders who speculate to realize trading profits) and nonreportable traders (usually small traders/speculators).
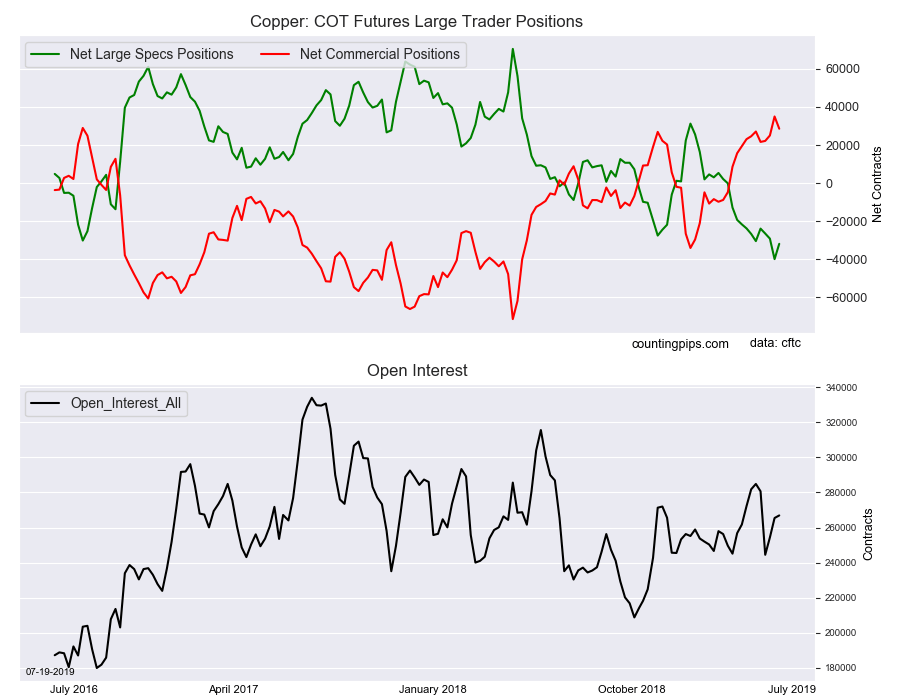
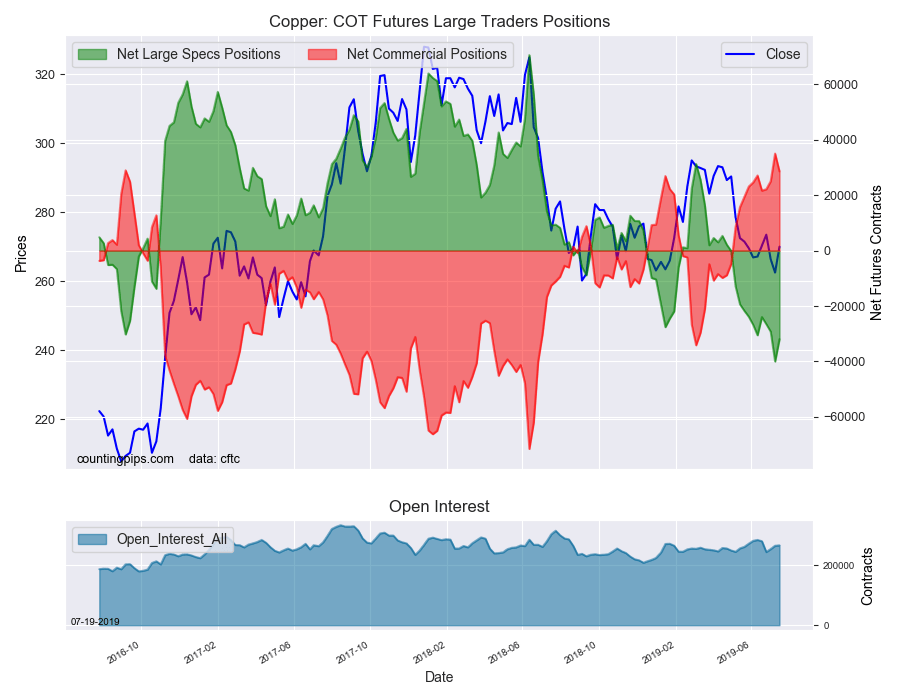
Large precious metals speculators decreased their bearish net positions in the Copper futures markets this week following a strong run of higher bearish sentiment, according to the latest Commitment of Traders (COT) data released by the Commodity Futures Trading Commission (CFTC) on Friday.
The non-commercial futures contracts of Copper futures, traded by large speculators and hedge funds, totaled a net position of -31,943 contracts in the data reported through Tuesday July 16th. This was a weekly change of 8,044 net contracts from the previous week which had a total of -39,987 net contracts.
The week’s net position was the result of the gross bullish position (longs) decreasing by -2,874 contracts (to a weekly total of 73,722 contracts) while the gross bearish position (shorts) dropped by -10,918 contracts for the week (to a total of 105,665 contracts).
The large speculators cooled off on their bearish sentiment a bit this week after pushing bearish positions higher for three straight weeks and for eleven out of the previous twelve weeks.
The current standing remains highly bearish with the net standing over the -30,000 contract level for a second straight week. Speculator positioning has deteriorated quite quickly over the past few months and has gone from a total of +2,126 net contracts on April 23rd to over -31,943 contracts on July 16th.
Copper Commercial Positions:
The commercial traders position, hedgers or traders engaged in buying and selling for business purposes, totaled a net position of 28,577 contracts on the week. This was a weekly shortfall of -6,438 contracts from the total net of 35,015 contracts reported the previous week.
Copper Futures:
Over the same weekly reporting time-frame, from Tuesday to Tuesday, the Copper Futures (Front Month) closed at approximately $270.00 which was a rise of $7.50 from the previous close of $262.50, according to unofficial market data.
*COT Report: The COT data, released weekly to the public each Friday, is updated through the most recent Tuesday (data is 3 days old) and shows a quick view of how large speculators or non-commercials (for-profit traders) as well as the commercial traders (hedgers & traders for business purposes) were positioned in the futures markets.
The CFTC categorizes trader positions according to commercial hedgers (traders who use futures contracts for hedging as part of the business), non-commercials (large traders who speculate to realize trading profits) and nonreportable traders (usually small traders/speculators).
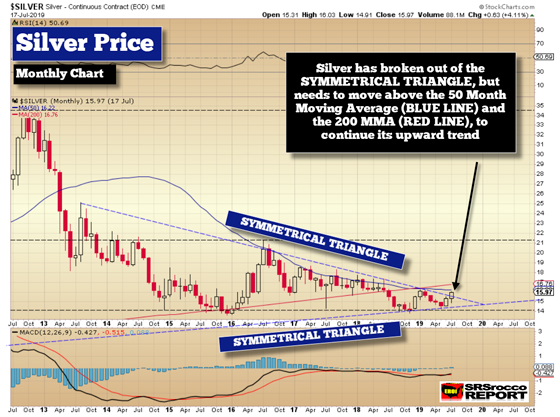
While the silver price has broken above the symmetrical triangle formation, it still has a few key levels to surpass to continue its upward trend. However, it was crucial for silver to first break above rather than below the symmetrical triangle to be able to remain in a bullish direction.
So, we have to take one positive silver price action at a time and look at the next technical levels. First, we can clearly see that silver broke upward above the Symmetrical Triangle formation:
We must remember, silver needs to close above the upper Symmetrical Triangle line by the end of July for it to be a Breakout. If you look at the monthly candlesticks in July & August 2016 (chart below), while silver shot above the blue dashed line, it did not close above it. Actually, the silver price closed at the end of July & August 2016 right at the upper Symmetrical Triangle formation line.
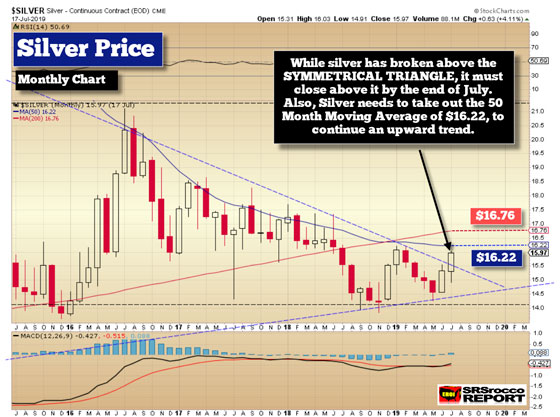
Second, if silver can close above this upper Symmetrical Triangle line by the end of July, it would also have to push above the 50 Month Moving Average (MMA @ $16.22), shown in the chart below:
If you look at both charts, the silver price has not closed above the 50 MMA (BLUE LINE) since early 2013. Furthermore, each time silver tried to surpass the 50 MMA since 2016; it closed below it. So, the next important key level for silver is the 50 MMA at $16.22. If would need to close above this level for a bullish trend to remain.
And, once silver is able to close above the $16.22 (50 MMA) level, it will need to break the 200 Month Moving Average (RED LINE) of $16.76. These are the two next important levels for silver to close above, ON A MONTHLY BASIS. Thus, silver needs to close at the end of July or August above these levels to be able to reach the next MAJOR KEY BREAKOUT LEVEL of $21.35-$21.50.
AFTER-HOURS UPDATE: Both silver and gold looked strong today as both closed nicely higher today. Silver also surpassed the next important key level, the 50 Month Moving Average at $16.22, and Gold was up $20 today. We could be finally seeing the next leg of the Gold-Silver Bull Market after a 5-year consolidation phase.
However, the metals could experience a pullback first. We just have to wait and see what happens over the next 10 days of trading, as both gold and silver much close above these key levels at the end of the month.
While the technical levels that I have mentioned in both Gold and Silver bring in more traders, investors, hedge funds, and institutional buying, it was due to the fundamentals of FED SOFTENING on its monetary policy that was the underlying cause. By the Fed changing its monetary policy to lowering interest rates and cutting back on its balance sheet liquidation, that was all that was needed to give the much-needed PUSH above those KEY LEVELS.
The Money Metals News Service provides market news and crisp commentary for investors following the precious metals markets.
Currency Point – Adding to our positions, knocking a pair out
Our USD thesis is very much holding true. In fact, the fait accompli around the cut to the Federal Funds Rate has been strengthened further by several events of the past week.
These been: – New York President John Williams confirming that its ‘better to take preventative measures’ – Vice Chair Richard Clarida followed this comment in an interview with Bloomberg with this comment: ‘When you only have so much stimulus at your disposal, it pays to act quickly to lower rates at the first sign of economic distress’ – Chair Jerome Powell: “Uncertainties about this outlook have increased, particularly regarding trade developments and global growth…[We] will act as appropriate to dustain the expansion”
The fait accompli of the July FOMC meeting has moved to a debate about how much will the Board cut on the 31st? Will it be 25-basis point (bps) or a hard faster 50bps.
As of last week, there was a growing trend from traders that a 50bps cut was now becoming a possibility. Since the remarks above the probability of a 50bps cut have moved from 17% at the start of the week to 40% at time of writing, the momentum suggests it will go past 50% before the meeting.
This all but locks in USD weakness over this period; thus we again highlight ‘choice’ as the USD will tends to ‘overpower’ in all pairs.
However, will need to single out GBP and EUR as possible numerators to ignore for the following reasons: GBP: – Final week of the ‘mini-election’ for the PM role. Boris Johnson looks the most likely however Jeremy Hunt is still very much in the mix. – A Brexit ‘no deal’ risk is building rapidly – Bank of England is becoming dovish All are risks on the GBP side
EUR: – ECB meeting this week, likely to signal further accommodation – Could cut Deposit and Lending rates as early as this week. Risks on the EUR side
The trade here is in the USD, thus look for pairs where the opposite currency is in a ‘neutral’ or ‘rising’ bias. It why we are adding to our AUD/USD long positions we have taken over the period weeks.
Welcome to this week’s Market Wrap Podcast, I’m Mike Gleason.
Coming up Craig Hemke of the TF Metals Report joins me for a very interesting discussion on how a myriad of problems are really starting to show up in the all-too-important banking sector, explains the recent move in the precious metals and gives some very key price levels for gold and especially silver that he’s watching very closely.
Craig also addresses the recent silver underperformance to gold in recent years and what’s behind that. So, stick around for an in-depth conversation with our friend Craig Hemke, coming up after this week’s market update.
Well, silver has finally made its move! After languishing and lagging over the past several months, silver prices broke out in a big way this week.
The white metal rallied to a one-year high on Thursday. As of this Friday recording, silver is packing a hefty weekly gain of nearly a dollar or 6.3% to bring spot prices to $16.25 an ounce.
Silver is finally showing some leadership – far outpacing gold’s 1.0% advance on the week. Gold prices currently check in at $1,430 per ounce, near a 6-year high.
Turning to the platinum group metals, platinum is up 2.3% this week to trade at $853. And palladium is actually showing a weekly loss of 2.1% to trade at $1,516.
Palladium’s underperformance adds weight to the idea that a change in leadership is underway. Palladium had been the stellar performer in the metals space since 2016. It achieved the rare feat of commanding a higher price per ounce than gold. But gold may be poised to soon re-claim its status as the most precious of metals, and silver may be primed to deliver superior gains in percentage terms.
On previous podcasts and in numerous articles at MoneyMetals.com, we made the case for silver as an incredible bargain opportunity. Our case for silver may have largely fallen on deaf ears outside the gold and silver bug community while the market remained stubbornly in a basing out phase.
But now that silver has potentially entered a breakout phase, the financial media is beginning to take notice.
Bloomberg News Anchor: Today I’m going to talk about poor man’s gold: silver, which is on quite a tear of five days in a row, the best five days since 2016. What’s happening here?
Greg Bender – Bloomberg News: Well the gold/silver ratio has been ripping higher, at 30 year highs, and a lot of people have been looking at silver, waiting for it to wake up a little bit, and it looks like it finally has. We’re seeing high volume, open interest is at the highest level in over two years.
Bloomberg News Anchor: And I’ll switch it to that right now, here’s that silver VIX. Wow, look at that. And so that can be bullish volatility too.
Greg Bender: Yeah, so unlike in equities, when volatility goes lower when equities rise, equity metal vol(ume) and metal prices rise together.
We’re seeing huge increases in speculative long positions in silver futures, significant inflows into silver-pegged exchange traded funds, and a big spike in silver mining equities. The SIL silver miners ETF surged 11% this week through Thursday’s close.
What may be dubbed the “paper market” for silver is leading the physical market in this very early stage of the rally. Demand for silver coins has been rather soft so far this year. We expect it will pick up as the public sees prices back on the move. For more analysis on the potential price moves for silver be sure to stick around for my interview with Craig Hemke in just a few moments as we dive into it further.
If an additional catalyst for safe-haven buying kicks in – perhaps tremors in the financial system or a plunge in the value of the dollar – then we could see premiums rise in the bullion market and concerns about physical supply tightness begin to drive prices.
Under such circumstances, silver could move a lot in a short amount of time. Given how undervalued silver remains even after this week’s rally, there is plenty of room for prices to double or even triple before the poor man’s gold would be considered anywhere near expensive on a historical basis.
What’s expensive now is what Wall Street is selling. Stock market bulls are betting the Federal Reserve’s expected shift to rate cutting will push the major averages further into record territory. That can’t be ruled out, of course.
But a deliberate campaign by the Fed and the Trump administration to weaken the U.S. dollar will almost certainly have unintended consequences. In addition to raising inflation risk, a weak dollar policy may inflame international tensions and weaken public confidence in the economy.
On Thursday, New York Fed President John Williams caused a bit of a stir when he suggested the central bank may need to hit the panic button at its upcoming policy meeting and cut rates by more than a quarter point. Williams said, “it pays to act quickly to lower rates at the first sign of economic distress.”
If economic distress is what’s coming, then investors would be wise to make sure they are well diversified into non-financial assets. In such a scenario, this week won’t be the last in which precious metals outperform stocks. It may even just be the start of a major long-term trend that stays in force for years to come.
Well now for more on this recent rally in the metals and what we should expect moving forward, let’s get right to this week’s exclusive interview.
Mike Gleason: It is my privilege now to welcome in Craig Hemke of the TF Metals Report. Craig is a well-known name in the metals industry, and runs one of the most highly-respected websites in our space, and provides some of the best analysis on the banking schemes, the flaws of Keynesian economics, and evidence of manipulation in the gold and silver markets that you will find anywhere.
Craig, welcome back and thanks for joining us. How are you today?
Craig Hemke: Mike, Happy Pet Rock Day. As we record this it’s July 17th, that is the four year anniversary of the infamous article written by Jason Zweig of the Wall Street Journal where he said, “Let’s face it, gold is just a pet rock.” So Happy Pet Rock Day, my friend.
Mike Gleason: Good start. Craig, I want to talk about silver first off here. Silver is showing some real life finally these last couple of days. It has been underperforming gold and that was certainly making us a bit nervous, we’d rather see silver confirming gold’s move higher. James Turk was out with a great statistic this week talking about how there have been 11,186 trading days in the COMEX since the prohibition of owning gold was lifted in January 1975. The ratio traded at 93, as it did just a few days ago, or higher, only 82 days. 82 days out of over 11,000 so you get the feeling for how extraordinary the current discount in silver is relative to gold.
What do you make of silver’s under-performance to this point, Craig? And then, what are you expecting for the white metal moving forward and is this bump that we’ve seen here over the last few days in silver the start of something, perhaps?
Craig Hemke: Mike, that’s a question that requires a whole bunch of different answers that hopefully kind of tie together. First and foremost, people need to understand that in 2009 to 2011 that most recent price run that took us all the way to $49 was fantastic obviously, but the last part of it from $38 to $49 was almost exclusively what we call a commercial short squeeze. The CTFC data, the Commitment of Traders report, the bank participation report all bore that out back in 2011. And what I always thought was going on was that you had the story of JP Morgan had inherited this massive short-position from Bear Stearns and they were maintaining it rather than getting out of it and thus were getting squeezed. They had no physical silver. Back then they were immediately rubber-stamped in the spring of 2011 to start their own COMEX silver vault. And in the eight years since, that vault now controls more than half of the total vaulted silver on the COMEX, more than 150 million ounces they’ve accumulated. Most of it through their proprietary house accounts, stopping 1,000 contracts or so every single month and taking into delivery and holding it in the eligible accounts.
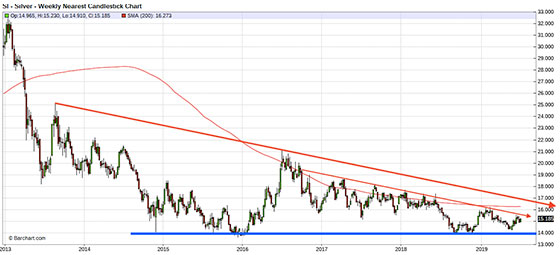
First thing you’ve got to understand is JP Morgan still has a monopolistic control of the pricing structure, at least as it applies through the COMEX. They’ve worked very hard in the last several years to paint silver into a corner and you can see that on the weekly chart. Maybe there’s a physical floor at around $14, the price keeps getting wedged tighter and tighter into a corner below some trend lines, the 200-week moving average. Why is silver under-performing? I think that’s it. I think these banks, JP Morgan and Citi, specifically, make a boatload of money shorting it on a consistent basis, issuing new contracts, taking the risk of being short against the speculator longs, that they can just outwait until the speculator longs rollover and then get back out or even move onto the short side.
So, I think that’s the biggest thing. I’ve been telling folks on my site that I would not at all be surprised to see the gold/silver ratio go to 100 to 1 before silver finally breaks out just because of that monopolistic control of the pricing scheme by those banks… meaning gold could go to $1,600 while silver could still be at $16. Now recently, here this week, we’ve seen silver rally and there’s a lot of speculation as to what’s going on with that. The thing I think is probably most interesting and perhaps even most valid is this idea that some big institutions have been, because of looking at the gold/silver ratio, have been long gold and short silver in this process. You can see … maybe you can see it some of the data … and now they’re taking those trades off, which has maybe been holding gold back this week while silver has been rallying.
I don’t know, there might be some validity to that, but let’s watch real closely here, Mike, because yes it’s exciting. Silver’s picking up, but man, there is an incredible amount of technical and we’ll just call it bank-created resistance between about $15.80 and maybe $17, so let’s get above $17 and your old friend Craig is going to start getting really excited, but between now and then, it’s still going to be a tough fight for this next 10% from here.
Mike Gleason: Yeah, still stuck in that range for sure and until it pops through that one way or the other, it’s hard to get too, too excited, but we’ll be watching. You wrote something on Tuesday that I wanted to get into. The current interest rate environment is a killer for banks, at least to the extent they are relying upon banking MO of borrowing at lower interest rates and lending at a higher rate, making a spread. Right now the margin is pretty low, the Fed funds rate is currently higher than the rate of a 10-year Treasury. Banks borrowing at the Fed’s discount window are finding it difficult to lend profitably.
At least the current rate environment finally killed the free-money scheme by which banks borrow at zero from the central bank to then buy Treasuries, pocketing two or three percent. Deutsche Bank recently announced massive layoffs and is restructuring its business so that, coupled with your observation about the tough operating environment for banks makes us wonder if there are other casualties coming. What are you expecting there? Talk about the banks here, Craig.
Craig Hemke: Well, I tell you what, Mike. Talk about history repeating and rhyming and all that kind of jazz. There’s a reason why, if you plot the chart of the yield on the German 10-year bund together with Deutsche Bank common stock you see they move almost together tick for tick and as rates go more negative in Europe, it’s just killing the European banks because again, traditionally the bank business model is to borrow short and lend long and pocket the spread. That’s how banks have operated for centuries. Well the problem is now the short rates, especially in the U.S., are higher than the long rates.
How do you make any money in that regard? You’re seeing that now even in the U.S. banks. Wells Fargo was talking about that yesterday. Citi talking about that today on Wednesday, the 17th and this is clearly a problem for Deutsche Bank and the rest of the EU banks. And then what does it do? It drives the kind of behavior that led us into 2008 where the banks can’t make money the old fashion way of printing it and then stealing it from everybody on the interest on the money they create. No, they’ve got to branch out and do all kinds of risky crap like create credit default swaps and CDOs and all of their proprietary trading and investment banking and all the stuff as they’ve had to take on more and more risk to generate more and more return and line their bonus pools that led us to the events of 2007 and 8. Well, here we go again.
They can’t make money the old-fashioned way, so now they’re going to start continuing down this road of more and more risky ventures. Don’t underestimate too, Mike, all of those European banks are tied together in kind of a daisy chain of risk where Bank A owns the debt of Bank B and Bank B owns the debt of Bank C and Bank C owns the debt of Bank A. And so if one of them starts to struggle and fail, it’s like an industry-wide margin call and you get this run on those banks. This is a really nasty situation all brought to you by your glorious charlatans at the ECB and at the Fed that have tried to maintain this illusion for now a decade that they have it all under control. They know exactly what they are doing and that things are going to one day go back to normal.
Nothing could be farther from the truth. The recognition of that is what is now driving gold and silver higher this year and as this continues to play out, it’s going to drive both even higher the remainder of this year and into next.
Mike Gleason: Staying on the topic of the Fed. People have been wondering why, if the U.S. economy is so strong, the FOMC is likely to start cutting interest rates when it gets back together in a couple of weeks. Perhaps the pain in the banking sector is part of that answer. We know the central banks actual mandate is to defend private sector banks, it isn’t maintaining a stable currency in fostering for full employment, the nonsense stated publicly. But in addition to their commitment to maintaining the profitability of banks, there’s also plenty of evidence that the U.S. economy is nowhere near as strong as represented.
What do you see as the Fed’s motivation for lower rates, Craig? And where do you think the FOMC is headed over the next year or two?
Craig Hemke: Mike, this is what I’ve been talking about at TF Metals Report says since last year, specifically late last year: is that 2019 is going to look a lot like 2010 and that in 2010 we were told that QE1 was just a one-time deal. There were green shoots to the economy everywhere. Ben Bernanke was hailed as the savior on the cover of The Atlantic. All these different things about how … oh look, we’re saved, everything’s great. And we were cooking along, more than 3% GDP, but then we started to fail in the third quarter. By the fourth quarter, a negative GDP and the first quarter of ’11 was negative as well thereby there’s your recession. The Fed responded in November 2010 with QE2, loss of faith and confidence that the central bankers had any idea what they were doing is what eventually drove a dive in the dollar, silver from $18 to $48 and gold from $1,160 to $1,920. Well here we are again, right.
We were told in the beginning, even late last year there were going to be four rate hikes this year. All the Wall Street economists were echoing, parroting that from the Fed. We were told the economy was just growing infinitely, everything was just hunky dory and all this beautiful stuff and I said, “No way, uh huh. This is all going to come crashing down, recession is inevitable.” And so now these moves by the Fed revealing themselves to be the charlatans that they are – they’re just making this stuff fly by the seat of their pants – it’s all playing out like we said now in a retracement, something that rhythms at least with 2010, but when you look at why the Fed is looking to cut … you read all this stuff, and yeah, but look at retail sales and the employment report and we can talk about the BS of those particular government statistics, but in the end the Fed knows their only hope to keep the place spinning is economic growth. It’s got to keep the U.S. economy chugging along so that the stock market keeps going up and they can keep this illusion going that they have some control.
Well, anybody that’s ever-studied economics knows that an inverted yield curve invariably leads to recession. Now, you can just look at it straight as lower rates on the long end versus the short end or some people look at other metrics. Is the three-month T Bill below Fed funds and is it there for more than a month? Is that the thing that guarantees a recession is coming? Either way, all I know is an inverted yield curve, where the Fed funds, the short rate, is higher than say the 10-year note leads to recession every time and these fuzzy headed academics at the Fed know this. The Fed funds rate is basically quoted at 2.4%. The two-year U.S. Treasury note is 1.85. The 10-year U.S. Treasury note is 2.1. so just simply to get the yield curve to be flat, the Fed needs to cut 50 basis points, lowering the Fed funds to 190 versus 185 for two and 210 for the ten.
They owe us probably 75 to get it down to 165 and at least have a positive slope again. That, Mike, is why they’re talking about cutting rates. All the other stuff, inflation, that’s all just window dressing to try to mollify the masses and keep them confused and buying stocks. They are looking to cut the Fed funds rate to simply reestablish a positively sloping yield curve. Help their banks for the same reasons that we talked about in the first question and then hope to keep the economy growing. I think they are behind the curve, they’ve been behind the curve all year. They’ll continue to be behind the curve. I would love it if they did not do anything two weeks from now and didn’t even cut at all. That would be fabulous, if they didn’t do anything. But they’ll probably cut 25 and talk about cutting at least 25 more. That will still continue to be beneficial for the metals as people figure out once again, like they did in 2010 that the emperors have no clothes as that awareness ripples through, again, precious metal prices just continue higher.
Mike Gleason: Obviously the real interest rate environment is what drives a lot of metals prices or drive them higher so that’s certainly what we’ll be looking for.
I want to get back to Deutsche Bank here for a second. Talk about that specifically if you would. We’ve all been watching the share price move lower, they’ve had constant legal troubles and they are loaded with bad debt. Part of the restructuring plan entails dumping $50 billion of toxic assets. They will be laying off 18,000 employees around the world. The big question is whether that will be enough to save them. ZeroHedge reported a quasi-bank run earlier this week, it appears nervous clients are pulling roughly $1 billion per day of deposits.
Deutsche Bank has $50+ trillion in derivatives exposure. What do you think? Will Deutsche Bank survive, first of all? Will Germany step up with a bailout and could this be the first domino that falls and starts a global economic panic?
Craig Hemke: Yes, yes and yes. How’s that? You like that? That a short enough answer? Deutsche Bank will survive in some form because, yes, the German … it’s the national bank of Germany. They’ll step in, the Bundesbank will step in regardless of what the ECB says what they can or can’t do. And they’ll keep it afloat. Now in the meantime, you mentioned this money flowing out of there, think if they’re acting as custodians for all your funds, for all your hedge fund, all your money in your hedge fund and you’re moving it all over the place, the last thing you want to do is see Deutsche Bank shuttered or a bank holiday or something like that. You don’t have access to your money for a certain period of time. It’s like, you might remember when MF Global bit the dust back in whatever that was, 2011.
I think eventually most everybody, whatever cash you had in there, you got back, but it took months. You got a little bit at a time over months. Well, if you had a billion fricking dollars in your hedge fund at Deutsche Bank, do you think you want to play that game over the next six to 12 months? Not a chance. So then there’s a possibility that that becomes kind of a critical mass exodus. Now Deutsche Bank’s a huge bank with supposedly billions if not trillions in what they would consider to be assets, but nonetheless, that’s a lot of cash that could really head for the exits and put them in quite a bind.
The end game of all this, though, is what we talked about at the beginning about how all of those European banks are linked together and to some extent the U.S. banks are linked to them as well. A renewed, even more severe EU banking crisis is most likely what’s coming, which is why the ECB is talking about restarting QE and buying whatever debt they can get their hands on over there. All of that is what’s driving interest rates even more negative in Europe. I mean, we’re up now over 13 trillion globally in negative yielding debt, even junk bonds are now negative yield in Europe. Even emerging market debt is even now negative yielding. This is madness.
But when the central bankers set off on this course to create 20 trillion in fresh currency over the last decade, that money just sloshes around the planet and when the risks get high, just simply getting your money back in 10 years from Switzerland, that sounds like a pretty damn good deal. And so all of this feeds on itself. It certainly appears that we’re reaching a point of critical mass here in 2019.
Mike Gleason: Craig, before we wrap up, I’d like to get your thoughts on maybe the technical side of gold and silver here. What levels you’re looking at, you spoke about that a little bit earlier with silver maybe over $17, kind of being the breakout point that we need to see breached. What levels are you looking for and what would you get excited about if we took them out to the upside and then conversely, where on the downside do we need to hold if we do see a pullback. Let’s get your update there as we begin to close and then perhaps anything else you want to touch on.
Craig Hemke: Mike, let’s go back to silver real quick because I want to make sure it’s clear what I’m talking about, and I’ll send you a chart that I posted for everybody on my site back on Friday, the 12th that illustrates this point. On the weekly chart of silver, since everything broke down in 2013 and everybody remembers that back in April 2013 when gold fell $200, was smashed down through $1,525. And silver fell $3 in a day, smashed down through $26. I mean, we’ve been going sideways. Now, gold is finally breaking out, but silver is not. And if you look at a weekly chart of silver, you can clearly see three obvious points of resistance. One, there’s the main trend line that starts back at the recovery high in August of 2013 when price got all the way back up to $25. You connect that to the next high of near $21 in July of 2016 and continue that on down. That’s the line that’s near $17.
Now below that is the 200-week moving average, which we barely got above in 2016 and then every single time we’ve gotten above that 200-week moving average on a weekly closing basis, from the middle of 2016 to the middle of 2018, we were immediately smashed the very next week and that doesn’t happen by accident. That’s JP Morgan and Citi making sure there’s no breakout. It’s happened 15 times, 15 weeks where price closed above the 200-week moving average only to be smashed the next week with a big red candle. Sol, you’ve got to figure that trend is probably going to continue.
The 200-week moving average right now is at $16.28. And then if you draw a parallel line to the main line, and you start it when that 200-week moving average was first broken in September of 2016, you’ll see a whole bunch of tops that connect with that line through ’17 and ’18. That line is around $15.80. So, between $15.80 and $17, as I mentioned earlier is a tremendous amount of bank created and technical resistance. That’s why I think gold continues higher and silver continues mostly sideways maybe for another six to eight months. And that’s why I think the gold/silver ratio could go to 100.
Now, at some point the demand for silver, just simply because the substitution effect will take over. Now what do I mean by that, that’s where economists talk about well, you know, when things are bad, instead of buying steak, you buy hamburger. Well if gold keeps going like I think it’s going to go, to $1,600 and $1,700 and back up to the old all-time high, just like its doing in every other currency, at some point people are going to go, “Well, hell’s bells, what is silver doing at $16?” And then it’s going to break out and then it’s going to feed on itself and it’s going to get a whole bunch of positive momentum and people are going to be seeing it just like they are seeing now in gold. So, to begin with in silver, I just think it’s going to be a tough ride. It doesn’t mean you can’t trade it and make money, but it’s going to be a tough ride maybe for another six months.
Gold, on the other hand, everybody knows it broke out through $1,360, that was the top end of the range it’s held since 2013. Last week it posted its highest weekly close since May of 2013, it’s even higher now. All of the stuff that’s going on between the central bankers and, don’t forget about political risks. Gosh, that summer of 2011, we had the U.S. credit being downgraded by S&P, we had the massive gridlock and debt ceiling debates in Washington, DC. Well, all of that’s happening again now, here in the summer of 2019.
Gold’s going to keep going higher, though of course obviously never straight up. It’s overbought. The Commitment to Traders report is heavy and all that kind of stuff, but the next target from here once it’s above $1,440 is maybe $1,480. The key level, I mentioned a second ago is $1,525, that was the level that held for 19 months from 2011 into 2012. That was a level that was taken out in April of 2013. $1,525 will be a key important level of resistance in the months ahead. I think we go up and get close there some time before the end of this year and then go blasting through there next year. Either way, both metals look great and man, oh man, should people be buying the shares. My friend, Eric Sprott told me a little over a month ago that in the early stages of a bull market it’s the large cap, high cost producers that really make money because if you’re making $100 an ounce at $1,300 gold, you make $200 an ounce at $1,400 gold, so you just doubled your earnings. And thus, we’re seeing the large big shares, the HUI Index, the GDX just going like crazy. That’s a sign of an early stage of a bull market too.
Everything looks good, but again, never does it mean we’re going straight up, but all of these forces that I’ve been writing about, that you and I have been talking about, that I’m sure you’re telling your listeners on a weekly basis, are really coming together. You should be averaging into your metal stack if you still have a higher cost basis than the current price you should be adding into it now. You should acquiring new metal now. Now is the time. This is the early stages of renewed bull market and you do not want to fall behind and be trying to play catch up all through the remainder of this year and into next.
Mike Gleason: Yeah, figures it can get pretty exciting and does seem like we’re on the verge of something that could be maybe explosive perhaps and look forward to catching up with you as that unfolds. Well, outstanding commentary once again, Mr. Hemke and thanks for your time today. Now before we sign off, please tell everyone more about the TF Metals Report and what it is that they’ll find there if they visit your site.
Craig Hemke: I’m sorry I can’t stop laughing about this Mr. Hemke stuff, Mike. That’s okay. You can call me anything you want, I’ve been called a lot worse especially on Twitter. Anyway, the TF Metals Report obviously there’s never been a more valuable time to be a part of it. What I do, all of this analysis is only $12 a month, so it’s 40 cents a day. I think the people that subscribe have recently felt like they get a pretty tremendous value. I think we do a pretty good job. But the community itself is fantastic. There’s people from around the world, literally around the world of all political persuasions, all working together helping each other out to see ourselves through this madness because we recognize at the end of the day we’re all in the same boat, man, whether you’re a progressive or a conservative or whether you live in Australia or whether you live in England.
Join us at TFMR, it’s a great place to discuss the metals. I’m pretty proud of what we’ve built there, we’ve been around almost 10 years and it’s finally starting to get fun again, TFMetalsReport.com.
Mike Gleason: You should be proud, it’s a great site and we follow it closely here in our office, I can tell you it’s fantastic analysis and everyone should definitely check it out. Excellent, thanks again, Craig. Enjoy the rest of your summer and I look forward to our next conversation. Take care my friend.
Craig Hemke: All the best to everybody on your end too, Mike.
Mike Gleason: Well, that will do it for this week, thanks again to Craig Hemke. The site is TFMetalsReport.com, definitely a fantastic source for all things precious metals and a whole lot more. We urge you to check that out so you too can get some of the very best commentary on the metals markets that you will find anywhere.
Mike Gleason: And be sure to check back here next Friday for our next Weekly Market Wrap Podcast. Until then, this has been Mike Gleason with Money Metals Exchange. Thanks for listening and have a great weekend, everybody.
The Money Metals News Service provides market news and crisp commentary for investors following the precious metals markets.