The economic calendar for the week ahead will focus on the US markets, with a number of releases focusing on various aspects from housing to flash manufacturing estimates. The week culminates with the release of the second quarter advance GDP report.
The economic data this week will likely give more clarity for the Federal Reserve. While the markets are already discounting a 50 basis point Fed rate cut, the data is likely to give more impetus.
The Eurozone
In the eurozone, the European Central Bank’s monetary policy meeting is set for Thursday. Speculation is rife that the ECB will announce a major shift to its monetary policy. However, the key interest rates are likely to remain unchanged. There’s the prospect that the ECB could potentially restart its bond purchase program to stimulate stagnating inflation and growth.
The markets elsewhere are relatively quiet with no major market-moving events lined up. Besides the ECB meeting, the flash manufacturing and services PMI reports from Markit for the eurozone and the US will be coming out. The data is likely to shed light on how the respective economies’ businesses have fared in July.
New Zealand
New Zealand will be reporting its trade balance figures this week. The data also covers the imports and exports for June. The release of the trade balance figures will likely show how New Zealand’s economy fared during the second quarter of the year.
Now let’s take a more in-depth look at the upcoming events.
US Durable Goods Orders & Advance GDP Report
The main items on the agenda this week will be the release of the durable goods orders report for June. The data will likely impact the expectations of the second-quarter GDP. Economists forecast that the headline durable goods orders will rise 0.5% on the month in June.
In the previous month, durable goods orders fell 1.3%. Excluding transportation, core durable goods orders are forecast to rise just 0.1% on the month in June. This follows the revised 0.4% increase we saw in May. Overall, the impact of the durable goods orders could be seen in the GDP. A better than expected report could see the GDP being revised higher over the course of the next few releases.
The advance GDP report is due on Friday. The median forecasts point to a 1.8% increase in the quarterly GDP. This marks one of the slowest paces of increases in the US economy in recent years.
On a quarter over quarter basis, the GDP price index is forecast to rise by 1.3% for the quarter ending June 2019. This follows a 0.6% increase in the previous quarter. The forecasts are quite dovish which gives room for an upside surprise.
Besides the GDP report, the personal consumption expenditure report will also be released.
ECB to Hold Monetary Policy Meeting
The European Central bank will be holding its monetary policy meeting this week on Thursday. The main question, heading into the monetary policy meeting is what the central bank could do to revive growth and inflation.
Previously, minutes from the June ECB meeting showed that policymakers were seriously concerned about inflation and growth. This comes after the ECB ended its bond purchase program last December.
ECB President Mario Draghi had previously indicated that the ECB could take action as early as July. However, there isn’t much clarity as the ECB could either cut interest rates further or even restart its bond purchase program.
For the moment, the markets are expecting to see further clarity via the forward guidance. It is possible that the ECB will announce a cut to rates or restart of QE program by autumn this year. Regardless, the outcome of the ECB meeting is going to be quite dovish.
The US dollar is strengthening against most currencies. The US dollar index (#DX) closed in the positive zone (+0.38%) on Friday’s trading session. The American currency was supported by weakening investors’ expectations regarding a sharp reduction in the Fed’s interest rate at the next meeting on July 30-31. The president of the Federal Reserve Bank (FRB) of St. Louis, James Ballard, said he was in favor of reducing the rate by only 0.25 percentage points instead of 0.5%, as participants in financial markets had previously assumed.
On Friday, ambiguous economic data were also published in the United States. Thus, the consumer expectations index from the University of Michigan in July was 90.1 and turned out to be better than the expected value of 89.8. However, at the same time, the consumer sentiment index from the University of Michigan counted to 98.4 and was worse than the predicted value of 98.6.
Today, the US-Mexico deal regarding migrants is expiring and it is not yet clear what the next step of US President Donald Trump will be. The United States and Mexico reached an agreement in June of this year, according to which it was decided that if the United States deemed that Mexico did not do enough for migrants from Mexico to the United States to return to their homeland before July 22, two countries would begin negotiations on changing the rules. We recommend keeping track of current information on this issue.
The “black gold” prices show a positive trend. At the moment, futures for the WTI crude oil are testing the mark of $56.90 per barrel.
Market Indicators
On Friday, the US stock markets were bearish: #SPY (-0.56%), #DIA (-0.30%), #QQQ (-0.73%).
The yield on 10-year US government bonds is at 2.04-2.05%.
The news feed 2019.07.22:
Today the publication of important economic news is not expected.
On Friday the 19th of July, trading on the euro closed down against the dollar, and has been trading within a limited range over the course of several days. Throughout the Asian, European, and US sessions, the EURUSD pair went no higher than 1.1287, and no lower than 1.1194. In today’s Asian session, trading on the pair opened at 1.1276, subsequently slipping to 1.1240, and then recovered slightly to 1.1260 at the opening of the European session.
The weak showing by the German PPI (-0.4%) fell short of expectations (-0.2%) and marked a significant decline from the previous reading of -0.1%. Meanwhile, public sector net borrowing in the UK came out at 6.5b GBP, more than double what was expected, and nearly double the previous reading, which further sunk the euro.
Speeches from FOMC members James Bullard and Eric Rosengren during the US session pushed the euro to 1.1203.
Day’s news (GMT+3):
15:30 US: Chicago Fed national activity index (Jun).
18:00 Japan: BoJ’s Governor Kuroda speech.
Current situation:
ECB President Mario Draghi in his June address spoke of the regulator’s intention to lower interest rates and to consider further stimulative measures economic if key indicators continue to worsen. He looks set to approve another round of quantitative easing before leaving his post, while many investors also expect another rate reduction of 10 – 20 base points.
The Federal Reserve is planning to slash interest rates at its next meeting on the 31st of July. The EURUSD pair is most likely to keep moving within its limited range of 1.1287 and 1.1149 pending any major developments, while a breakout of either of these levels will set the future course of the currency pair. This, of course, assumes that we don’t get any developments over the course of the week that may overshadow the expected rate reduction by the Federal Reserve.
With a thin economic calendar, we want to start the beginning of the week with a purely technical piece on the DAX30 CFD.
After the German index broke below 12,300 points Thursday or last week, driven by a short dip in US equities, the DAX30 CFD went for a test of the crucial region around 12,180/200 points.
‘Crucial’, because this region can be considered the trend support on the hourly chart, holding the sequence of higher highs and lows since the beginning of June in play.
Still, by the last weekly close bulls couldn’t recapture 12,300 points what leaves the DAX30 CFD vulnerable to another test of the region around 12,180/200 today and in the days to come.
A successful attempt to break lower activates the psychologically relevant region around 12,000 points, while recapturing 12,300 makes another test of 12,430/470.
Then, on Thursday with the ECB rate decision, the cards will be re-shuffled.
Source: Admiral Markets MT5 with MT5-SE Add-on DAX30 CFD Hourly chart (between July 1, 2019, to July 19, 2019). Accessed: July 19, 2019, at 10:00pm GMT – Please note: Past performance is not a reliable indicator of future results, or future performance.
Source: Admiral Markets MT5 with MT5-SE Add-on DAX30 CFD daily chart (between April 10, 2018, to July 19, 2019). Accessed: July 19, 2019, at 10:00pm GMT – Please note: Past performance is not a reliable indicator of future results, or future performance.
In 2014, the value of the DAX30 CFD increased by 2.65%, in 2015, it increased by 9.56%, in 2016, it increased by 6.87%, in 2017, it increased by 12.51%, in 2018, it fell by 18.26%, meaning that after five years, it was up by 10.5%.
Investing in Forex with Admiral Markets
Admiral Markets offers professional traders the ability to trade with a custom, upgraded version of MetaTrader 5, allowing you to experience trading at a significantly higher, more rewarding level. Experience benefits such as the addition of the Market Heat Map, so you can compare various currency pairs to see which ones might be lucrative investments, access real-time trading data, and so much more. Click the banner below to start your FREE download of MT5 Supreme Edition!
Disclaimer: The given data provides additional information regarding all analysis, estimates, prognosis, forecasts or other similar assessments or information (hereinafter “Analysis”) published on the website of Admiral Markets. Before making any investment decisions please pay close attention to the following:
This is a marketing communication. The analysis is published for informative purposes only and are in no way to be construed as investment advice or recommendation. It has not been prepared in accordance with legal requirements designed to promote the independence of investment research, and that it is not subject to any prohibition on dealing ahead of the dissemination of investment research.
Any investment decision is made by each client alone whereas Admiral Markets shall not be responsible for any loss or damage arising from any such decision, whether or not based on the Analysis.
Each of the Analysis is prepared by an independent analyst (Jens Klatt, Professional Trader and Analyst, hereinafter “Author”) based on the Author’s personal estimations.
To ensure that the interests of the clients would be protected and objectivity of the Analysis would not be damaged Admiral Markets has established relevant internal procedures for prevention and management of conflicts of interest.
Whilst every reasonable effort is taken to ensure that all sources of the Analysis are reliable and that all information is presented, as much as possible, in an understandable, timely, precise and complete manner, Admiral Markets does not guarantee the accuracy or completeness of any information contained within the Analysis. The presented figures refer that refer to any past performance is not a reliable indicator of future results.
The contents of the Analysis should not be construed as an express or implied promise, guarantee or implication by Admiral Markets that the client shall profit from the strategies therein or that losses in connection therewith may or shall be limited.
Any kind of previous or modeled performance of financial instruments indicated within the Publication should not be construed as an express or implied promise, guarantee or implication by Admiral Markets for any future performance. The value of the financial instrument may both increase and decrease and the preservation of the asset value is not guaranteed.
The projections included in the Analysis may be subject to additional fees, taxes or other charges, depending on the subject of the Publication. The price list applicable to the services provided by Admiral Markets is publicly available from the website of Admiral Markets.
Leveraged products (including contracts for difference) are speculative in nature and may result in losses or profit. Before you start trading, you should make sure that you understand all the risks.
By Hussein Sayed, Chief Market Strategist (Gulf & MENA), ForexTime
Equity markets kicked off the week in red on Monday with risk appetite seeming to be hurt by miscommunication from Federal Reserve. The probability of a 50-basis point rate cut by the Federal Reserve rose on Thursday after Federal Reserve Bank of New York President John Williams said the US central bank should take swift action when faced with adverse economic conditions. His comments led investors to believe that a more aggressive rate cut is underway when the Fed meets on July 30-31. However, a statement from the NY Fed stated that Williams’ speech was an academic one based on research and not about potential action at the upcoming Federal Open Market Committee (FOMC) meeting. The clarification from the NY Fed trimmed the probability of 50 basis point rate cut to below 20% from about 65%. In such time of uncertainty, messages from the Fed needs to be more coordinated and aligned to prevent shocks in the markets. The sentiment was even further dented on Friday after Iran captured the British oil tanker, increasing tensions in the already volatile region.
Surprisingly though, oil price gains were limited. Market participants would have expected prices to climb $10 to $20 given the rising tensions in the Strait of Hormuz, which is the most critical shipping route for Oil. Brent traded 1.6% higher on Monday, while still $4 below the previous week high. The little reaction seen in prices suggest two things. One, markets do not believe that these tensions will further escalate and two, the ongoing trade disputes will further hit demand while the US supply continues to reach new highs. While fundamentals do support lower oil prices, investors need to carefully watch the developments in Strait of Hormuz. After all, the Strait is responsible for one-fifth of the world’s oil supply, and any disruption will lead to a significant spike in prices.
This week investors will be watching for signs on how the next phase of ECB monetary easing will look like. European bond and equity markets have already been moving on assumptions of a rate cut and more Quantitative Easing (QE). If a rate cut doesn’t come on Thursday, expect ECB Chief Mario Draghi to provide guidance on when and how easing will take place. Any disappointment from the ECB will likely lead to a sell-off in Eurozone bonds and steep rally in the Euro, however, I don’t think this is the base case scenario.
Earnings season is in full swing, Tech along with Industrial companies will likely make most of the headlines. This week may determine whether US corporates will enter an earning recession or have avoided it. Alphabet, Amazon, Facebook, and Twitter among other companies will all release their second-quarter results. Almost 30% of Corporate America have been citing the US-China trade tensions as a major headwind to their profitability and expect this number to increase with the second week of earnings announcement.
Disclaimer: The content in this article comprises personal opinions and should not be construed as containing personal and/or other investment advice and/or an offer of and/or solicitation for any transactions in financial instruments and/or a guarantee and/or prediction of future performance. ForexTime (FXTM), its affiliates, agents, directors, officers or employees do not guarantee the accuracy, validity, timeliness or completeness, of any information or data made available and assume no liability as to any loss arising from any investment based on the same.
Dollar strengthens on improving consumer sentiment
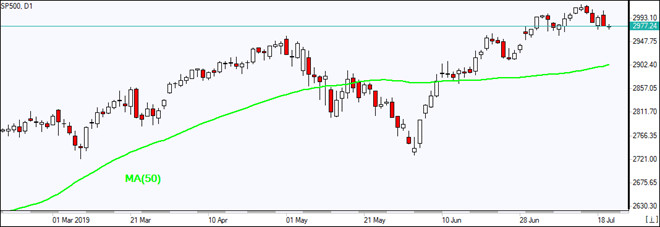
US stock market advance paused on Friday as steep interest rate cut expectations moderated after New York Fed said Williams’ comments about need to ‘act quickly’ referred to his academic research and not upcoming Federal Reserve meeting. The S&P 500 slid 0.6% to 2976.61, losing 1.2% for the week. Dow Jones industrial slipped 0.3% to 27154.20. The Nasdaq fell 0.7% to 8146.49. The dollar weakening reversed as University of Michigan consumer sentiment index was revised upward. The live dollar index data show the ICE US Dollar index, a measure of the dollar’s strength against a basket of six rival currencies, rose 0.43% to 96.13 and is higher currently. Stock index futures point to higher market openings today
DAX 30 leads European indexes rebound
European stocks ended marginally higher on Friday despite renewed concerns Italy’s year-old coalition government might collapse. Both EUR/USD and GBP/USD turned lower but are higher currently. The DAX 30 rose 0.3% to 12260.07. France’s CAC 40 inched up 0.03% and UK’s FTSE 100 added 0.2% to 7508.70.
Chinese shares lead Asian indexes retreat
Asian stock indices are mostly falling today while the STAR market in China, a Nasdaq-style board of 25 tech companies, gains after opening due to oversubscription in IPO shares by retail investors. Nikkei fell 0.2% to 21416.79 with yen slide against the dollar intact. China’s markets are retreating: the Shanghai Composite Index is down 1.3% and Hong Kong’s Hang Seng Index is 1.3% lower. Australia’s All Ordinaries Index pulled back 0.1% with the Australian dollar slide against the greenback intact.
Brent futures prices are extending gains today. Prices rose on Friday on report Iran seized a U.K.-flagged tanker Stena Impero: Brent for September settlement ended 0.9% higher at $62.47 a barrel Friday, nevertheless closing 6.4% lower for the week.
Note: This overview has an informative and tutorial character and is published for free. All the data, included in the overview, are received from public sources, recognized as more or less reliable. Moreover, there is no guarantee that the indicated information is full and precise. Overviews are not updated. The whole information in each overview, including opinion, indicators, charts and anything else, is provided only for familiarization purposes and is not financial advice or а recommendation. The whole text and its any part, as well as the charts cannot be considered as an offer to make a deal with any asset. IFC Markets and its employees under any circumstances are not liable for any action taken by someone else during or after reading the overview.
Peter Epstein of Epstein Research delves into the reasons why he believes this developmentand other developments in the lithium marketstrengthen the investment thesis.
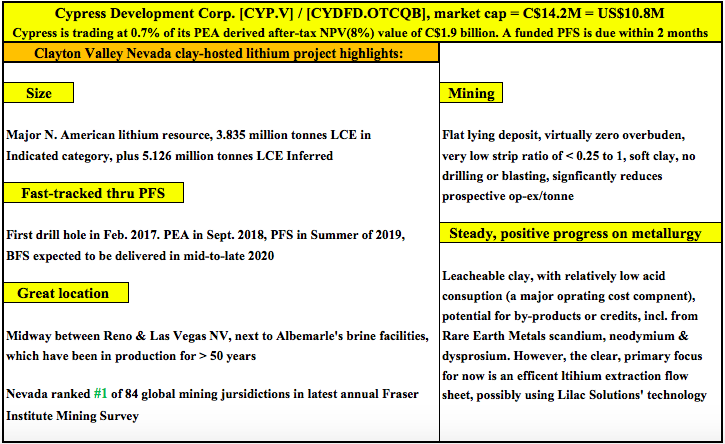
Earlier this year, Cypress Development Corp. (CYP:TSX.V; CYDVF:OTCQB; C1Z1:FSE) delivered a preliminary economic assessment (PEA) on its 100%-held Clayton Valley clay-hosted lithium project in Nevada (USA). The results were strong, (all figures post-tax, in Canadian dollars [CAS$]), an IRR [internal rate of return] of 32.7%; NPV [net present value](8%) = $1.95 billion upfront capex = $645.88 million; a 40-year mine life operating at 24,000 (24K) tonnes lithium carbonate equivalent (LCE) per year.
A fully funded prefeasibility study (PFS) is expected in late August or early September. After the release of this important report, management will be in a position to dive deeper into talks with a number of strategic and/or financial partners that have already expressed interest [see new corporate presentation].
The next capital raise (or, if an investment at the project level, it would not require the issuance of new shares), will fund a pilot plant bank feasibility study (BFS). The BFS is expected to be delivered in mid- to late 2020.
Cypress partners with lithium extraction technology company
On July 15, Cypress and privately owned Lilac Solutions announced a successful demonstration of favorable lithium recoveries from Cypress’ Clayton Valley project in Nevada. Lilac is a lithium extraction technology company based in California. Cypress’ project is a large, clay-hosted lithium deposit containing 3.835 million tonnes LCE in the NI 43-101 Indicated resource category, plus 5.126 million tonnes LCE in the Inferred category [see NI 43-101 Technical Report (PEA)].
Cypress has developed an innovative leaching process that reduces the quantity of sulfuric acid needed (a major cost factor) to leach lithium from clay. After lithium is leached into solution (leachate), Lilac has proven it can extract it to produce a high-purity lithium solution, which can be processed with conventional equipment into high-purity lithium carbonate and hydroxide.
According to the news release, Lilac successfully extracted lithium from clay leachate, recovering 83% of the lithium, and rejecting greater than 99% of the sodium, potassium and magnesium impurities. Importantly, the remaining lithium in leachate can be recycled to allow for further recovery of lithium. The amount of additional lithium potentially recoverable in this manner is unknown at this time.
Cypress CEO Bill Willoughby, PhD, commented: “Lilac’s results are promising and offer another path forward to efficiently recover lithium from our process solutions. Our project is a significant potential source of domestic lithium and we are pleased to be working with Lilac in applying their ion-exchange technology.”
Several clay-hosted Li projects coming online in early 2020s
Readers should be aware that due to technical challenges associated with lithium extraction and/or prohibitive operating costs, no clay-hosted lithium project has reached commercial production. That’s very likely to change as Ioneer Resources’ (INR:ASX) Rhyolite Ridge and Bacanora Minerals Ltd.’s Sonora projects commence operations in the next few years.
Those two will likely be followed by Lithium Americas Corp.’s (LAC:TSX; LAC:NYSE) Thacker Pass project (Ioneer, Lithium Americas and Cypress Development each have projects in Nevada; Bacanora’s flagship clay-hosted lithium project is in Mexico). Ioneer’s project will get roughly half its revenue from the sale of boric acid.
If things continue to go well for Cypress, and management is able to line up one or more strategic partners to help fund development, the Clayton Valley project could reach commercial production a few years after Ioneer and Bacanoraperhaps around the same time, or a year behind, Thacker Pass.
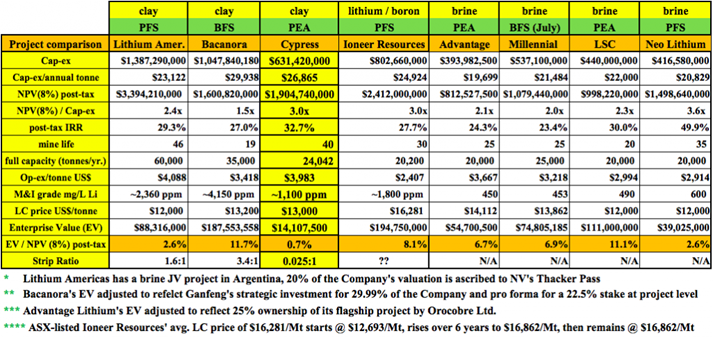
I argue that while behind the others, Cypress is in the same league, especially once it delivers a PFS. Therefore, as a percentage of independently derived, after-tax NPV, it should trade in the same ballpark. However, that is not the case. Cypress is trading at less than 1% of its NPV, while peers trade at between 2.6% and 11.7% [see chart below].
Even if one assumes that Cypress is facing more equity dilution than peers, it is trading at a significant discount. For example, consider a hypothetical doubling in Cypress’ share count to adjust for its earlier stage. The valuation would then be 1.5% of NPV. That’s still a 79% discount to the average of the other names in the chart, 7.1% of NPV.
Next steps after a PFS this summer, a pilot plant and the BFS
Following behind much larger companies has its advantages. Management at Cypress, most notably CEO Bill Willoughby, who’s a PhD mining engineer with nearly 40 years’ experience, is learning a great deal from technical press releases and reports filed by Ioneer, Bacanora and Lithium Americas. Management is learning what to do, but also what not to do.
The same learning process will continue as Cypress and Lithium Americas go through their respective pilot plant stages. Ioneer and Bacanora already have pilot plants operating. However, each project is unique. Bacanora and Lithium Americas each have projects that are far different from Cypress’ Clayton Valley, and different from each other’s.
Global lithium supply next decade highly uncertain
One of the more exciting things for investors is something that has nothing to do with Cypress. It’s the happenings, or lack of happenings, in Chile and Argentina, where project after project has been delayed or is outright stallednot just early-stage projects, but projects at the BFS stage. These have stalled over the past year or more due to a falling lithium price and inability to arrange financing.
This is generating negative investment sentiment and headlines, but in the medium- to longer-term, it’s great news for lithium pricing. Three years into a lithium price boom, albeit one that has tapered off lately, and production from Chilean brine operations has barely budged. There are about a dozen brine projects in Argentina, from pre-drilling to BFS-stage to fully funded, that simply are not moving forward.
I believe that the world might only get half to two thirds of the brine production expected out of Chile and Argentina by the middle of the next decade. Said another way, if 500,000 tonnes LCE is expected from those countries in 2026, I would not be surprised if we did not see that amount until 2029.
No new brine projects have been able to ramp up to nameplate capacity, and time periods to reach just 70%-80% of full capacity are stretching out to four or five years instead of two or three. Orocobre is an example of this.
Conclusion
By the time Cypress gets its Clayton Valley project up and running in the middle of the next decade, I think the lithium pricing environment is going to be strong, perhaps very strong. By strong I mean US$12K$16K/tonne. Very strong would be US$16K$20K/tonne. The current price is around US$11K/tonne. Cypress is an earlier-stage investment opportunity than some of its peers, but should be squarely in the middle of the bunch once it has tabled a PFS later this summer.
If true, Cypress Development Corp. and a select few other clay-hosted lithium companies should be in a prime position to enter the market at an ideal time. And, Nevada will be a great location from which to launch the sale of high-purity lithium products to global auto manufacturing plants across North America.
Peter Epstein is the founder of Epstein Research. His background is in company and financial analysis, and he is a Chartered Financial Analyst (CFA). He holds an MBA degree in financial analysis from New York University’s Stern School of Business.
Want to read more Energy Report articles like this? Sign up for our free e-newsletter, and you’ll learn when new articles have been published. To see a list of recent articles and interviews with industry analysts and commentators, visit our Streetwise Interviews page.
Disclosures: The content of this article is for information only. Readers fully understand and agree that nothing contained herein, written by Peter Epstein of Epstein Research [ER], (together, [ER]) about Cypress Development, including but not limited to, commentary, opinions, views, assumptions, reported facts, calculations, etc. is not to be considered implicit or explicit investment advice. Nothing contained herein is a recommendation or solicitation to buy or sell any security. [ER] is not responsible under any circumstances for investment actions taken by the reader. [ER] has never been, and is not currently, a registered or licensed financial advisor or broker/dealer, investment advisor, stockbroker, trader, money manager, compliance or legal officer, and does not perform market making activities. [ER] is not directly employed by any company, group, organization, party or person. The shares of Cypress Development are highly speculative, not suitable for all investors. Readers understand and agree that investments in small cap stocks can result in a 100% loss of invested funds. It is assumed and agreed upon by readers that they will consult with their own licensed or registered financial advisors before making any investment decisions.
At the time this interview was posted, Peter Epstein owned shares in Cypress Development Corp. and the Company was an advertiser on [ER].
Readers should consider me biased in my view of the Company. Readers understand and agree that they must conduct their own due diligence above and beyond reading this interview. While the author believes hes diligent in screening out companies that, for any reasons whatsoever, are unattractive investment opportunities, he cannot guarantee that his efforts will (or have been) successful. [ER] is not responsible for any perceived, or actual, errors including, but not limited to, commentary, opinions, views, assumptions, reported facts & financial calculations, or for the completeness of this interview or future content. [ER] is not expected or required to subsequently follow or cover events & news, or write about any particular company or topic. [ER] is not an expert in any company, industry sector or investment topic.
Streetwise Reports Disclosure: 1) Peter Epstein’s disclosures are listed above. 2) The following companies mentioned in the article are billboard sponsors of Streetwise Reports: Cypress Development Corp. Click here for important disclosures about sponsor fees. The information provided above is for informational purposes only and is not a recommendation to buy or sell any security. 3) Statements and opinions expressed are the opinions of the author and not of Streetwise Reports or its officers. The author is wholly responsible for the validity of the statements. The author was not paid by Streetwise Reports for this article. Streetwise Reports was not paid by the author to publish or syndicate this article. Streetwise Reports requires contributing authors to disclose any shareholdings in, or economic relationships with, companies that they write about. Streetwise Reports relies upon the authors to accurately provide this information and Streetwise Reports has no means of verifying its accuracy.
4) The article does not constitute investment advice. Each reader is encouraged to consult with his or her individual financial professional and any action a reader takes as a result of information presented here is his or her own responsibility. By opening this page, each reader accepts and agrees to Streetwise Reports’ terms of use and full legal disclaimer. This article is not a solicitation for investment. Streetwise Reports does not render general or specific investment advice and the information on Streetwise Reports should not be considered a recommendation to buy or sell any security. Streetwise Reports does not endorse or recommend the business, products, services or securities of any company mentioned on Streetwise Reports. 5) From time to time, Streetwise Reports LLC and its directors, officers, employees or members of their families, as well as persons interviewed for articles and interviews on the site, may have a long or short position in securities mentioned. Directors, officers, employees or members of their immediate families are prohibited from making purchases and/or sales of those securities in the open market or otherwise from the time of the interview or the decision to write an article, until one week after the publication of the interview or article.
Today, we are going to share with you some incredible charts that highlight why we believe all traders and investors need to stay keenly aware of the potential for very explosive moves over the next 6 to 12+ months. We’ve authored a number of articles about super-cycles, Gold, Oil and dozens of other symbols suggesting that a deeper and more complicated economic shift is taking place throughout the world. We’ve been following the trail of money and investments for many months and attempting to map out what we believe will happen in the future with our proprietary predictive modeling systems and adaptive learning utilities. Get ready for some crazy price ranges and a big move in the markets over the next 30+ days.
Right now, we believe the US stock market is poised for another attempt to move briefly higher as a flood of earnings hits the news wires next week. We are confident that the US stock market will attempt a move higher based on our predictive modeling systems and other technical analysis tools. We want to warn you that this upside move will likely become a “wash-out high” price rotation where price rallies briefly, stalls, then reverses back to the downside fairly quickly. We believe this “wash-out high” price pattern will set up and execute before August 5th or so. Be prepared as this move may sucker in a number of new long traders just before it breaks lower.
I highlighted the August 19th date (+/- 5 days) as a key inflection point/date in the markets. This is when we believe the US stock market may break down and when we believe a new price trend will attempt to establish. We are concerned the US stock market may break downward fairly aggressively based on our super-cycle research and predictive modeling research – causing traders to panic slightly.
Our expectations are that the US stock market may fall as the global markets collapse is warranted by a number of factors: the US Presidential election, global trade issues, global credit issues, weakening economic data throughout the globe and lofty price valuation levels within the US stock market. We believe a “price revaluation event” is the most likely outcome because of these factors and we believe the event will align with historical price patterns related to the US Presidential election cycle.
Weekly chart of the Transportation Index
This Weekly chart of the Transportation Index highlights the Volatility Range our Fibonacci price modeling system is suggesting. The support level near $10,400 is key to understanding what to expect from the markets going forward. This level is critical and when price breaks below this level, our researchers believe the TRAN will breakdown below the recent base near 9715 and continue much lower.
We don’t believe any upside price advance that takes place right now has any real momentum behind it. In fact, if you look at this historical chart of the trans, industrials, and small-cap sectors, we have seen a spike in price in these groups just for a week before a new bear market starts. This setup is identical to the 2007/08 top, so check out these charts here.
VIX Daily Chart Expectations
This VIX Daily chart highlights what we expect to happen over the next 10 to 15+ days. We expect earnings to continue to deliver near expected results with a few bumps here and there. We do believe some forward guidance revisions will create some shocks in the market going forward, but we don’t believe these guidance levels will present any real panic event until closer to the end of July. This is why we believe the VIX will continue to move near recent lows for another 7+ days, then start a mild upside move near the last week in July before breaking higher with an explosive upside move setting up in very late July or early August.
This upside spike in the VIX will more likely be the result of the “wash-out high” rotation pattern that we suggested above. If you have been taking advantage of the perpetual short trade on UVXY where you can earn 20-45% a month the past 10 years, well that gravy train may be over soon, at least until the next bull market starts in 8-24 months from now. I’ll go into more detail on this in a future article.
Dow Jones (YM) Weekly chart
This Dow Jones (YM) Weekly chart paints a very clear picture of what we are expecting to see happen. 7 to 10+ days of moderate upside price activity creating the “wash-out high” price pattern where the YM trades near the $27,725 level (key resistance). Once that “wash-out high” pattern is set up, we expect a moderate downside price rotation toward the $25,800 level. This is the move that will prompt a VIX Spike and begin a “shake out” price move.
After that, brief support will create an opportunity where traders may consider a “buy the dip” entry before a deeper and more aggressive downside move begins near Mid August. This is the August 19 Price Peak call that we initiated a few weeks ago. We believe this move is already in the process of setting up based on our predictive modeling tools, the pre-election year cycle, and the decade cycle as seen here. We are alerting skilled traders so they can prepare for this setup.
CONCLUDING THOUGHTS:
In short, the opportunities for skilled technical traders over the next 16+ months is incredible. Huge price swings, incredible trends, big rotations and 20%, 40%, 60%+ profits to be had if you know what to trade and when. These types of stock market rotations are perfect for skilled technical traders like us and we want to help you prepare for and trade these opportunities.
This bear market has been a long time coming, but finally, almost all the signs are showing that it’s about to start. As a technical analyst since 1997 having lost a fortune and making a fortune from bull and bear markets I have a good understanding of how to best attack the market during its various stages.
Be prepared for these incredible price swings before they happen and learn how you can identify and trade these fantastic trading opportunities in 2019, 2020, and beyond with our Wealth Building & Global Financial Reset Newsletter. You won’t want to miss this big move, folks. As you can see from our research, everything has been setting up for this move for many months – most traders/investors have simply not been looking for it.
Join me with a 1 or 2-year subscription to lock in the lowest rate possible and ride my coattails as I navigate these financial market and build wealth while others lose nearly everything they own during the next financial crisis. Join Now and Get a 1oz Silver Round or Gold Bar Shipped To You Free.
I can tell you that huge moves are about to start unfolding not only in currencies, metals, or stocks but globally and some of these supercycles are going to last years. A gentleman by the name of Brad Matheny goes into great detail with his simple to understand charts and guide about this. His financial market research is one of a kind and a real eye-opener. 2020 Cycles – The Greatest Opportunity Of Your Lifetime
As a technical analysis and trader since 1997, I have been through a few bull/bear market cycles. I believe I have a good pulse on the market and timing key turning points for both short-term swing trading and long-term investment capital. The opportunities are massive/life-changing if handled properly.
I’M GIVING AWAY – FREE GOLD & SILVER WITH MEMBERSHIPS
Kill two birds with one stone and subscribe for two years to get yourFREE PRECIOUS METAL and get enough trades to profit through thenext metalsbull market and financial crisis!
Our incredible ADL predictive modeling system predicted a moderate price anomaly on July 10th, 2019 in Crude Oil. We wrote about this oil set up on July 10th. Within this article, we suggested that Crude Oil would rotate to levels near $47~$48 rather quickly, then find some moderate support in December and January where support is likely to be found near $45 to $50. After that, the price of Oil should weaken dramatically where price could fall to levels below $30 ppb on extreme price weakness.
We are writing to you today to suggest that Oil prices may attempt to find very brief support near $55.25 as this level represents a key price trigger level which acts as support/resistance. After such a big downside move for the week, it is our opinion that Oil will briefly hold near this $55.25 level as oil tries to hold support for a couple of days.
We believe the selling may abate or weaken slightly early next week as earnings continue to hit the news cycle and future expectations are adjusted based on this data. Quite a bit of data will be released next week with the worlds biggest firms releasing Q2 data and Q3 expectations. We believe this news/data will result in a brief pause in the decline of oil prices and allow traders to set up for the next move lower.
This Daily Crude Oil Chart highlights the downside price action this week as oil collapsed from the $60 upside target called from our early June oil video forecast. The chart below also highlights our Fibonacci price modeling tool that is currently suggesting support will be found just above $51 ppb – which is aligned with the previous price bottom in early June 2019. Mild resistance is also found near $56.70 (the BLUE projected price level). This level will likely act as a “congestion range” as price rotates and attempts another downside leg.
This Weekly Crude Oil chart highlights the bigger picture for oil. The recent breakdown in price has just crossed the Bearish Fibonacci trigger level (RED LINE near $55.20) and this breach suggests the downside price move may just be starting. Ultimate downside targets near $40 to $44 are where we believe the price will find support over the next 30 to 60+ days. Beyond these levels, the price may continue much lower and eventually breach the sub $30 level in Q1 or Q2 of 2020, which would likely be a strong cause of the pending bear market.
Concluding Thoughts:
Any deep downside price move like this in Crude Oil would suggest that economic weakness and supply/demand issues are the root causes of a Crude Oil price collapse.
If the downside move continues as we are suggesting, many foreign nations will come under extreme economic pressures and currency levels/support could become threatened as the foundation for many oil-based economies will begin to crumble. This could create an extreme debt/credit issue for many nations throughout the planet and could push the US Dollar well above $100. The implications for extended trends and trades is incredible when you consider the scope of the economic shift that will take place if Crude Oil does begin trading below $30 in early 2020.
$30-$40 crude oil could spark or further deeping the pending bear market which has been a long time coming. Almost all the signs are showing that it’s about to start so get ready. If you want someone to guide you through the next 12-24 months complete with detailed market analysis and trade alerts (entry, targets and exit price levels) join my ETF Trading Newsletter.
As a technical analyst since 1997 having lost a fortune and made fortunes from bull and bear markets I have a good understanding of how to best attack the market during its various stages. The opportunities starting to present themselves will be life-changing if handled properly.
Be prepared for these incredible price swings before they happen and learn how you can identify and trade these fantastic trading opportunities in 2019, 2020, and beyond with our Wealth Building & Global Financial Reset Newsletter. You won’t want to miss this big move, folks. As you can see from our research, everything has been setting up for this move for many months – most traders/investors have simply not been looking for it.
Join me with a 1 or 2-year subscription to lock in the lowest rate possible and ride my coattails as I navigate these financial market and build wealth while others lose nearly everything they own during the next financial crisis.
FREE GOLD or SILVER WITH MEMBERSHIP!
So kill two birds with one stone and subscribe for two years to get yourFREE PRECIOUS METAL and get enough trades to profit through the next metalsbull market and financial crisis!
Here are this week’s links to the latest Commitment of Traders data changes that were released on Friday.
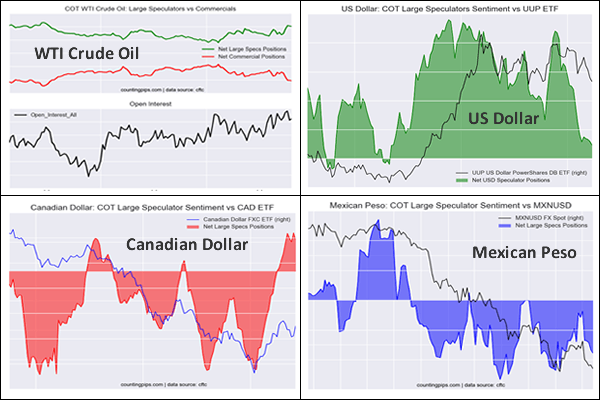
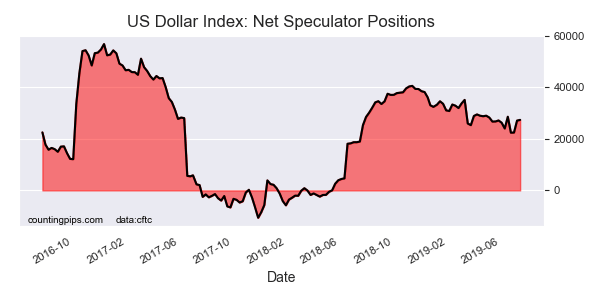
This week in the COT data, we saw the USD Index speculator bets edge a bit higher and gain for a third week. Canadian dollar speculator positions rose sharply and the CAD position is in bullish territory for a third week (the highest level since February 13th of 2018).
Speculators continued to add to their bearish bets for the British pound sterling for a fifth straight week to a total of -76,357 contracts. Euro positions, meanwhile, saw less bearish bets and the overall position is at the least bearish level since October.
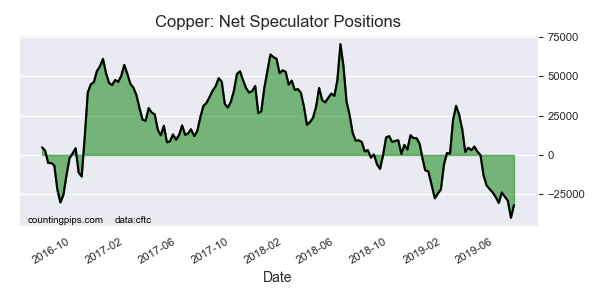
Copper speculators lessened their bearish bets this week for the first time in about a month. The copper position has been extremely bearish over the past few months as speculator bets had fallen for eleven out of the previous twelve weeks before this week’s rebound.
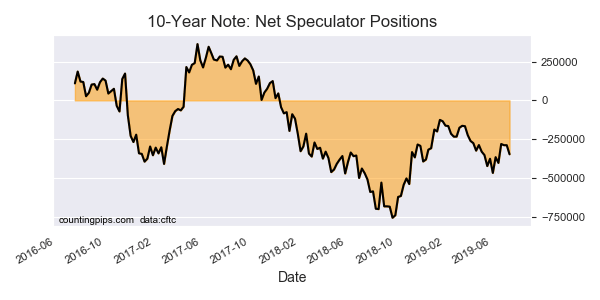
The 10-Year Bond positions went sharply more bearish this week after being virtually unchanged last week. Speculator bearish bets are back above the -300,000 net contract level for the first time in a month.
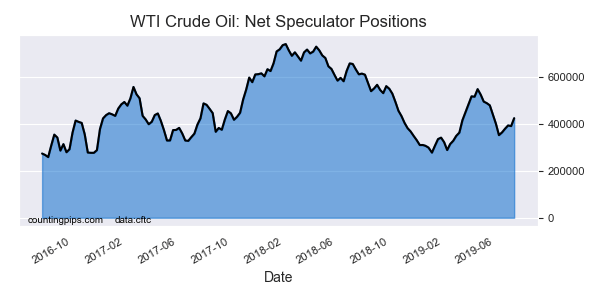
The WTI Crude oil speculators raised their bullish bets for the fourth time out of the past five weeks and pushed their current standing above the +400,000 net contract position for the first time since June 4th.
Large currency speculators boosted their net positions in the US Dollar Index futures markets this week, according to the latest Commitment of Traders (COT) data released by the Commodity Futures Trading Commission (CFTC) on Friday. See full article.
The large speculator contracts of WTI crude futures totaled a net position of 423,762 contracts, according to the latest data this week. This was a change of 33,613 contracts from the previous weekly total. See full article.
Large speculator contracts of the 10-Year Bond futures totaled a net position of -347,222 contracts, according to the latest data this week. This was a change of -58,386 contracts from the previous weekly total. See full article.
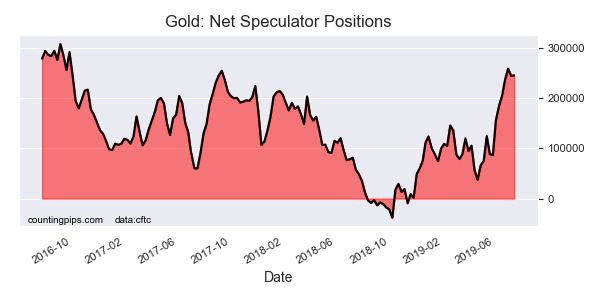
Large precious metals speculator contracts of the Gold futures totaled a net position of 245,501 contracts, according to the latest data this week. This was a change of 738 contracts from the previous weekly total. See full article.
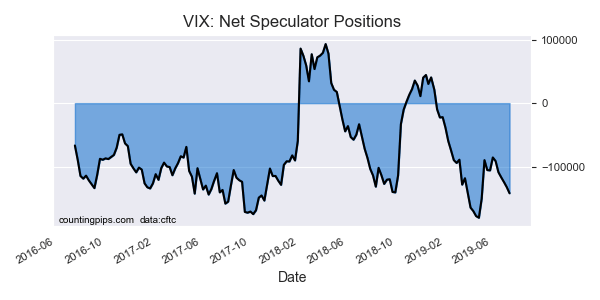
Large stock market volatility speculator contracts of the VIX futures totaled a net position of -141,797 contracts, according to the latest data this week. This was a change of -9,615 contracts from the previous weekly total. See full article.
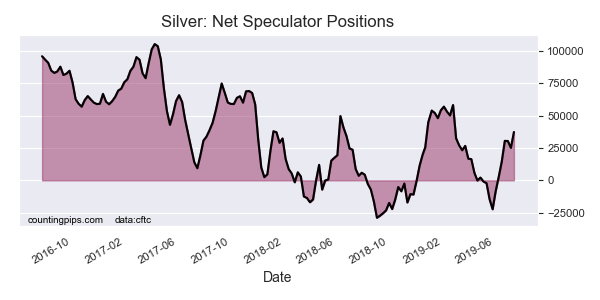
Large precious metals speculator contracts of the silver futures totaled a net position of 37,425 contracts, according to the latest data this week. This was a change of 12,274 contracts from the previous weekly total. See full article.
Metals speculator contracts of the copper futures totaled a net position of -31,943 contracts, according to the latest data this week. This was a change of 8,044 contracts from the previous weekly total. See full article.
*COT Report: The COT data, released weekly to the public each Friday, is updated through the most recent Tuesday (data is 3 days old) and shows a quick view of how large speculators or non-commercials (for-profit traders) were positioned in the futures markets.
The CFTC categorizes trader positions according to commercial hedgers (traders who use futures contracts for hedging as part of the business), non-commercials (large traders who speculate to realize trading profits) and nonreportable traders (usually small traders/speculators).
 Current situation: