Traders Brace For FOMC Today

By Orbex

FOMC In Focus

USD remains supported ahead of the FOMC meeting later today. The market is widely expecting the Fed to announce a .25% rate cut along with guidance for further easing over the remainder of the year.There is still a risk that the Fed goes for a larger .50% cut. Although in line with recent data strength this risk seems largely diminished. With the rate cut priced in, the USD reaction is likely to depend on the guidance and other comments during the press conference after. USD index trades 97.84 last.

Euro Lower on Weak Data

EURUSD trades on a weaker footing today as weakness in eurozone inflation, released this morning, underpins expectations of ECB easing. Core inflation printed just 0.9% in July, highlighting the issues facing the ECB. EURUSD trades 1.1148 last, still sitting above 1.1130 support for now.

GBP Hanging On

GBPUSD has managed to stay in the green today despite the rising uncertainty around Brexit. The key focus for GBP traders will, of course, be the BOE rate decision due tomorrow. While the bank is not expected to adjust policy, there are risks of a more dovish outlook, specifically regarding Brexit risks. These are likely to weigh on price. GBPUSD trades 1.2163 last, trading just above 1.2115 support for now.

Equities Higher on Fed Rate Cut Expectations

Risk assets have been trading higher across the European session so far as traders brace for the FOMC later today. Expectations of a Fed rate cut have kept SPX500 well supported over recent weeks and with the Fed expected to outline the likely need for further easing over the year, the risks of a rally higher in equities are elevated. SPX500 trades 3016.18 last, just below the 3019.15 resistance.

Safe Havens Stronger

Safe havens have had a stronger day so far with both JPY and gold mildly higher against USD. Moves have been quiet and the main focus will be on the US rate decision later today which has the potential to support both gold and JPY. USDJPY trades 108.56 last with price straddling the middle of the 108.24–108.77 range. XAUUSD trades 1430.90 last with price still capped by 1433.48 resistance.

Crude Cruising Higher

Oil prices remain well supported today following yesterday’s report from the API which showed that US crude stores had fallen again last week. The market is now waiting on the headline EI report due later today. This could confirm a seventh consecutive week of drawdowns, which would be strongly bullish for oil. Crude trades 58.44 last, heading back up to test the 60 level next.

High Betas Back In Business

USDCAD has seen lower prices today. Yesterday, price traded back down below the 1.3145 level and is hovering around there so far today. CAD has been well supported by the recovery in oil prices while expectations of a Fed rate cut later today have the potential to further depress USDCAD. Price trades 1.3148 last.

AUDUSD has been a little softer so far today following explosive moves higher overnight in reaction to better than expected inflation data. Aussie CPI printed 1.6% in Q2, up from 1.3% prior and above the expected 1.5%. AUDUSD trades .6895 last, trading back up near the broken.6910 level.

By Orbex
 

EURMXN Euro/Mexican Peso Analysis: Getting ready for significant data and events

By IFCMarkets

Getting ready for significant data and events

US Fed and Bank of Mexico are going to cut rates. Will the EURMXN quotations grow?

This movement occurs with the strengthening of the euro and the weakening of the Mexican peso. On July 31, 2019, the Fed meeting will take place, at which the rate is expected to decrease by 0.25% to 2.25%. Market participants believe that the US regulator will not stop at this and will continue easing monetary policy. The last time the Fed lowered the rate in November 2008, at the height of the global economic crisis. Recall that the current level of the American rate is 2.5% with an annual inflation of 2.1%. Its decline can weaken the dollar and strengthen the euro. The next meeting of the ECB will be held only on September 12, 2019. Eurozone GDP data for the 2nd quarter and preliminary inflation for July may affect the dynamics of the euro. They will be released July 31, 2019. On the same day, Mexico’s GDP for the 2nd quarter will be published. The next meeting of the Bank of Mexico will be held on August 15. Theoretically, it can reduce the rate, which is 8.25% with inflation of only 3.95% in annual terms. Mexican President Andres Manuel Lopez Obrador said that the Bank of Mexico needs not only to control inflation, but also to accelerate GDP growth. In his opinion, low lending rates could support this process.

EURMXN

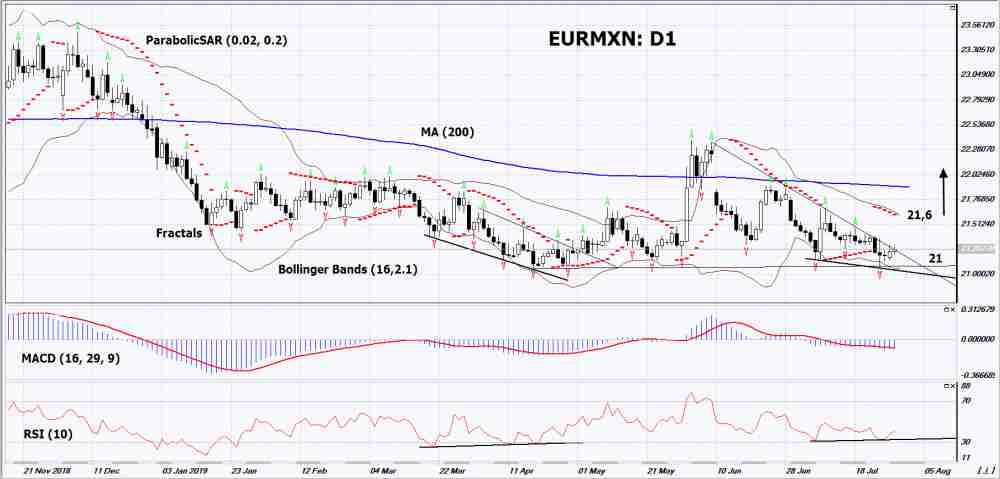
On the daily timeframe EURMXN: D1 rose to the resistance line of the downward trend. Various technical analysis indicators formed signals for improvement. Further growth of quotations is possible in case of positive macroeconomic news in the EU and negative – in Mexico.

  • The Parabolic indicator shows a lower signal. It can be used as an additional resistance level that must be overcome before opening a buy position.
  • The Bolinger bands narrowed, indicating low volatility. The bottom line of Bollinger has a slope up.
  • The RSI indicator is below 50. It has formed a divergence to the increase.
  • The MACD indicator gives a bullish signal.

The bullish momentum may develop if EURMXN will exceed the upper Bollinger line, the Parabolic signal and its last upper fractal: 21.6. This level can be used as an entry point. The initial stop lose may be placed below the last lower fractal and the lower Bollinger line: 21. After opening the pending order, stop shall be moved following the signals from the Bollinger and Parabolic to the next fractal minimum. Thus, we are changing the potential profit/loss to the breakeven point. More risk-averse traders may switch to the 4-hour chart after the trade and place a stop loss moving it in the direction of the trade. If the price meets the stop level (21) without reaching the order (21,6), we recommend to cancel the order: the market sustains internal changes that were not taken into account.

Technical Analysis Summary

PositionBuy
Buy stopAbove 21,6
Stop lossBelow 21

Market Analysis provided by IFCMarkets

August 19 Price Peak Prediction Is Confirmed By Our ADL Predictive System

By TheTechnicalTraders.com

Our Adaptive Dynamic Learning (ADL) predictive price modeling system is one of the most unique and incredible predictive price utilities anyone has ever seen.

Over the past 24+ months, the ADL system has been able to call nearly every market rotation in the US major indexes (the ES, NQ, and YM) as well as our incredible call in Gold from October 2018 till now.  There is really nothing on the planet that can make accurate predictions for future price activity like our ADL predictive modeling tool.

Weekly chart of the NQ – NASDAQ

This Weekly chart of the NQ (NASDAQ futures) highlights the ADL predictive modeling systems results from a price peak in late April 2019.  The results consist of 52 unique price instances that make up the future predictive price levels.  This prediction suggested that price would fall to levels near $7200 by May 27, 2019, then rally from that date to a peak level near August 19, 2019.  This new August 19 peak level will likely be near $8500 – nearly +500 pts from the current price level.

Traders that have setup short positions may feel quite a bit of pressure over the next 4+ weeks as this move higher extends to align with our ADL predictive modeling system.  Overall, we believe a volatile price period in the markets may extend near this August 19 prediction where price volatility will increase and a potential for a downside price rotation may occur.

Additional ADL predictive results suggest a downside potential for price to levels near $7200 as volatility increases near August 19, 2019.  These predictions are suggesting that the key date, August 19, 2019, will likely be the peak in the price for a period of time.  The downside predictions where the price is suggested to reach $7200 indicates the range of potential volatility after the August 19 peak.

We have been suggesting that traders continue to scale back long positions before this peak is reached.  Ideally, we urge traders to pull some profits off the table and to prepare for this potential rotation in price as well as to prepare for increased volatility near or after August 19, 2019.  Our extended research suggests deeper support is found near $6700 and we believe a volatility increase could drive prices towards these levels in a reversion price rotation.

As of right now, the most logical expectation for the price is for a continued upside price bias lasting 3 to 4 more weeks reaching a price peak near August 19, 2019 – just as we originally predicted. The Fed rate cut we just talked about could be what spurs the market on for this final exhaustion rally. As we near that critical date, we expect to see increased volatility throughout the global stock market and we would expect the VIX to begin a spike move higher.

Currently, an ADL price anomaly is setting up that may prompt a quick downside move on or after the August 19 date.  It is because of this price anomaly setup that we are suggesting the bottom for the price could be anywhere between $6500 and $7200 (ADL predicted levels).  In other words, get ready for some increased volatility and a very strong potential for a price reversion to unfold.

We have seen some really strange price action in small-cap stocks this week which I will cover shortly as well, so stay tuned!

CRUCIAL WARNING SIGNS ABOUT GOLD, SILVER, MINERS, AND S&P 500

In early June I posted a detailed video explaining in showing the bottoming formation and gold and where to spot the breakout level, I also talked about crude oil reaching it upside target after a double bottom, and I called short term top in the SP 500 index. This was one of my premarket videos for members it gives you a good taste of what you can expect each and every morning before the Opening Bell. Watch Video Here.

I then posted a detailed report talking about where the next bull and bear markets are and how to identify them. This report focused mainly on the SP 500 index and the gold miners index. My charts compared the 2008 market top and bear market along with the 2019 market prices today. See Comparison Charts Here.

On June 26th I posted that silver was likely to pause for a week or two before it took another run up on June 26. This played out perfectly as well and silver is now head up to our first key price target of $17. See Silver Price Cycle and Analysis.

More recently on July 16th, I warned that the next financial crisis (bear market) was scary close, possibly just a couple weeks away. The charts I posted will make you really start to worry. See Scary Bear Market Setup Charts.

CONCLUDING THOUGHTS:

In short, you should be starting to get a feel of where each commodity and asset class is headed for the next 8+ months. The next step is knowing when and what to buy and sell as these turning points take place, and this is the hard part. If you want someone to guide you through the next 12-24 months complete with detailed market analysis and trade alerts (entry, targets and exit price levels) join my ETF Trading Newsletter.

Be prepared for these incredible price swings before they happen and learn how you can identify and trade these fantastic trading opportunities in 2019, 2020, and beyond with our  Wealth Building & Global Financial Reset Newsletter.  You won’t want to miss this big move, folks.  As you can see from our research, everything has been setting up for this move for many months.

Join me with a 1 or 2-year subscription to lock in the lowest rate possible and ride my coattails as I navigate these financial market and build wealth while others lose nearly everything they own during the next financial crisis.

As a technical analysis and trader since 1997, I have been through a few bull/bear market cycles. I believe I have a good pulse on the market and timing key turning points for both short-term swing trading and long-term investment capital. The opportunities starting to present themselves will be life-changing if handled properly.

FREE GOLD OR SILVER WITH MEMBERSHIP!

Kill two birds with one stone and subscribe for two years to get your FREE PRECIOUS METAL and get enough trades to profit through the next metals bull market and financial crisis!

Chris Vermeulen – TheTechnicalTraders.com


Fed Likely To Cut For The First Time Since 2015

By Orbex

The Federal Reserve will be concluding its two-day monetary policy meeting today. This will culminate with the release of the monetary policy statement.

For the first time since 2015, the central bank will be most likely cutting interest rates by 25 basis points. This would bring the short term Fed funds rate down to 2.20% – 2.25%.

The Fed funds rate has been in a steady incline since December 2015. In response to the global financial crisis, the central bank had lowered interest rates to historic lows of 0.50%. However, after nearly a decade since then, the Fed started to raise rates gradually.

This pushed up the Fed funds rates from the historic lows of 0.5% to 2.50%.

U.S. Fed Funds Rate
US Fed Funds Rate

The rise in the US interest rates was in response to a gradually improving economy.

After growth faltered in 2007 – 2008, the US economy was supported by the Fed’s unconventional tools which included injecting liquidity into the economy.

Over the years, the central bank’s efforts have paid off as the US economy quickly turned higher.

How Did We Get Here?

Today’s policy decision is in response to the prospects of a slowing US economy. Up until the previous governors, the Fed was always seen as responding to a crisis after it happened. For the first time, we will see the Fed taking a proactive approach.

Given the fact that the US economy is currently in the midst of the longest economic expansion, investors and markets at large are concerned about the threat of a recession.

This was evident from earlier this year as the US treasury yield curve inverted, a historic signal that predicts a recession. However, analysts were quick to dismiss its reliability. On the ground level, there are a lot of issues currently plaguing the US economy.

U.S. GDP, Q1 2019
U.S. GDP, Q1 2019

The US economy grew at an annualized pace of 3.1% in the first quarter of this year. However, growth has steadily slowed ever since GDP grew 4.2% on an annualized basis in the second quarter of 2018.

Recent economic data showed that according to the initial GDP estimates, the US economy grew at an annualized pace of 2.1% in the second quarter of 2019.

There are a number of reasons behind this.

For one, the Washington administration is currently actively pursuing trade as leverage against its trading partners. China, has been the worst hit. President Trump has raised tariffs on imports from China as well as a few other countries.

The basis for the trade wars was an effort to rein in the ballooning trade deficit that the US has with most of its trading partners. The United States imports more goods than it produces.

What Comes Next for the Fed?

While the rate cut is highly expected in the markets, questions remain on what the future policy course might be. The central bank, in its June Fed meeting, indicated that it expects no rate hikes for the remainder of this year.

President Trump, and the markets, to a certain extent, were initially pricing in a 50bps rate cut. This was in response to slowing manufacturing as well a somewhat sluggish labor market data.

In June, the US nonfarm payrolls surprised by showing a 220k increase in jobs. This was higher than expected and comes after a weak spell.

Various FOMC members have grown more vocal in recent times about taking precautions. Just last week, NY Fed President Williams signaled that the Fed should cut rates by at least 50 basis points.

However, officials downplayed the comments signaling that the markets could expect to see just a quarter-point cut. At this point, it is unlikely that the Fed will take an extreme step to lower rates by 50bps.

On the contrary, we could expect to see the Fed wait for the response from lower interest rates and then act accordingly.

A lot will depend on today’s forward guidance that the Fed will issue. In the near term, it is likely that the Fed will wait for the final GDP figures for the second quarter and perhaps wait for the initial GDP estimates for the third quarter before responding with policy measures.

By Orbex


Forex Technical Analysis & Forecast 31.07.2019 (EURUSD, GBPUSD, USDCHF, USDJPY, AUDUSD, USDRUB, GOLD, BRENT)

Article By RoboForex.com

EURUSD, “Euro vs US Dollar”

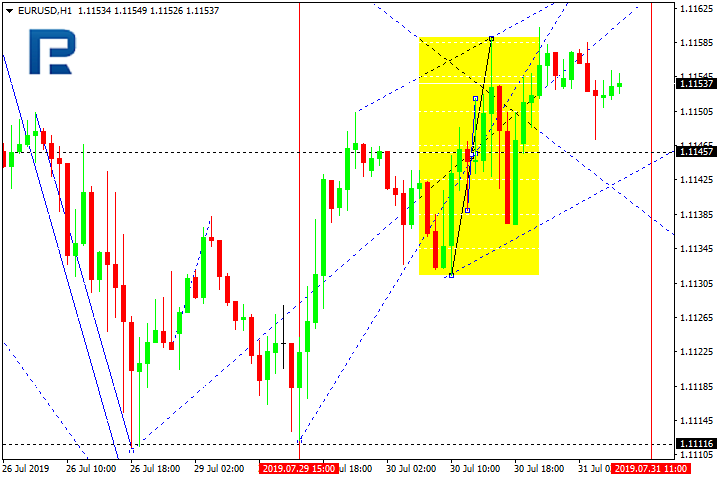
EURUSD is moving upwards; it has broken the consolidation range to the upside and may continue the correction with the short-term target at 1.1173 (an alternative scenario). In fact, the price may start plummeting towards 1.1075 at any moment.

EURUSD
Risk Warning: the result of previous trading operations do not guarantee the same results in the future

GBPUSD, “Great Britain Pound vs US Dollar”

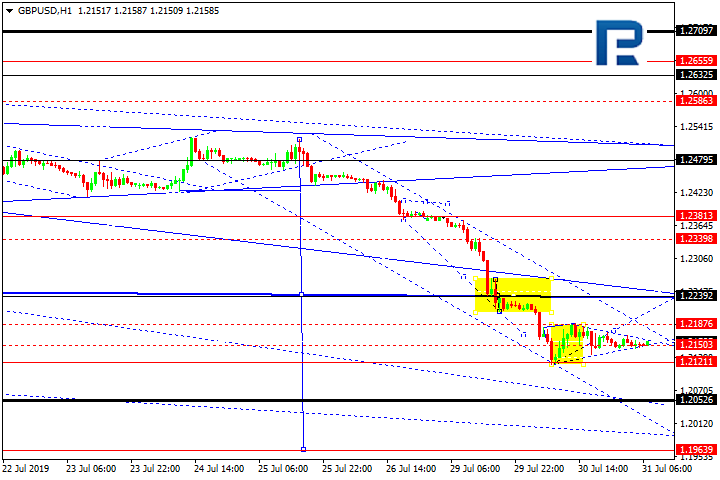
GBPUSD is consolidating around 1.2150. If the price breaks this range to the upside at 1.2180, the instrument may start a new correction towards 1.2240; if to the downside at 1.2121– continue trading inside the downtrend with the target at 1.2000.

GBPUSD
Risk Warning: the result of previous trading operations do not guarantee the same results in the future

USDCHF, “US Dollar vs Swiss Franc”

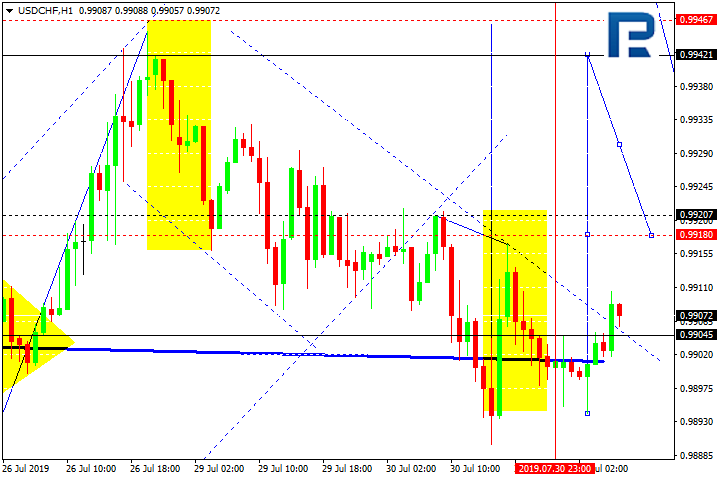
USDCHF is moving upwards. Possibly, today the pair may break 0.9918 and then continue growing with the short-term target at 0.9942. Later, the market may start another correction towards 0.9820 and then form one more ascending structure with the first target at 1.0000.

USDCHF
Risk Warning: the result of previous trading operations do not guarantee the same results in the future

USDJPY, “US Dollar vs Japanese Yen”

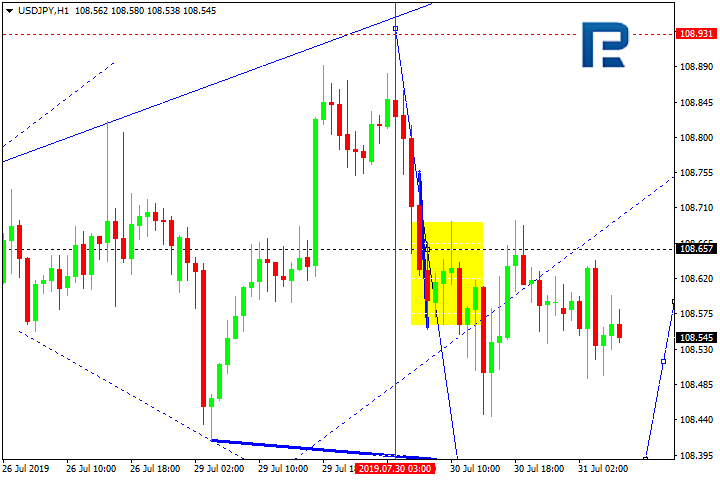
USDJPY is moving downwards. Today, the pair may fall to reach 108.37 and then start another growth towards 108.66. After that, the instrument may form a new descending structure to break 108.30 and then continue trading inside the downtrend with the short-term target at 108.00.

USDJPY
Risk Warning: the result of previous trading operations do not guarantee the same results in the future

AUDUSD, “Australian Dollar vs US Dollar”

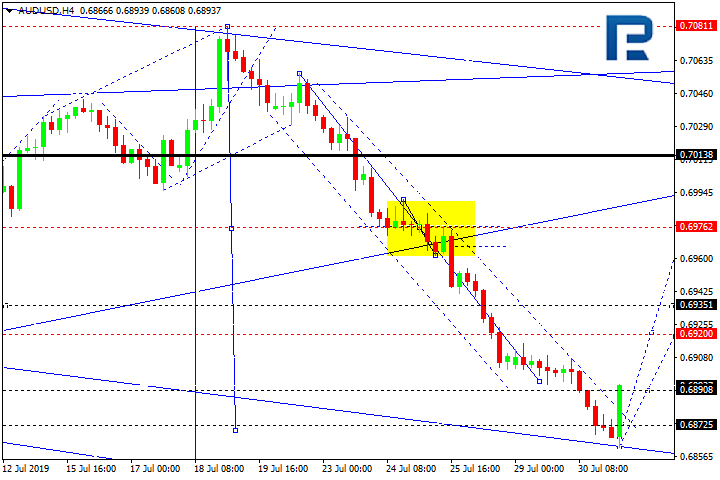
AUDUSD has reached the key downside target at 0.6870; right now, it is moving upwards. Possibly, the pair may start a new correction with the target at 0.6977.

AUDUSD
Risk Warning: the result of previous trading operations do not guarantee the same results in the future

USDRUB, “US Dollar vs Russian Ruble”

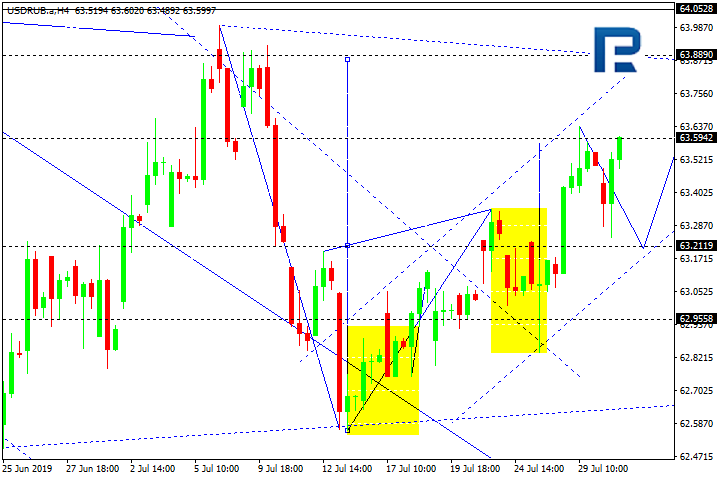
USDRUB has finished the correction; right now, it is moving upwards to reach 63.88. Later, the market may start a new decline towards 63.21.

USDRUB
Risk Warning: the result of previous trading operations do not guarantee the same results in the future

XAUUSD, “Gold vs US Dollar”

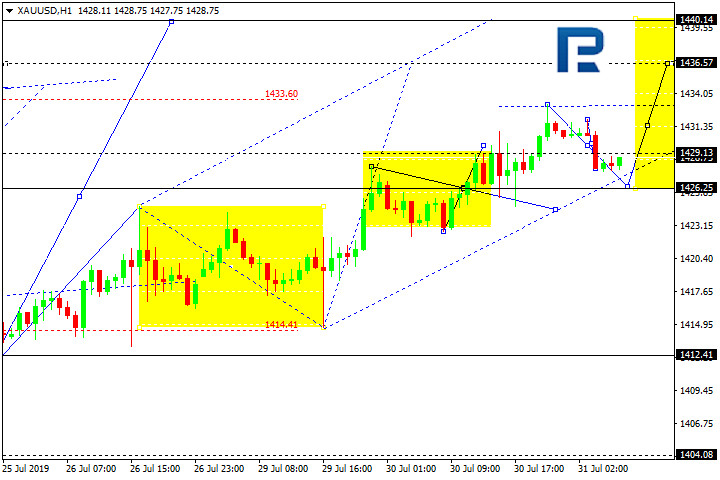
After completing the continuation pattern at 1426.26, Gold is moving upwards inside the third correctional wave with the target at 1436.57. After that, the instrument may fall to reach 1426.26 and then form one more ascending structure towards 1440.14.

GOLD
Risk Warning: the result of previous trading operations do not guarantee the same results in the future

BRENT

Brent is moving upwards. Today, the pair may reach the short-term target at 66.60. After that, the instrument may start a new decline towards 65.00 and then resume trading inside the uptrend with the first target at 67.60.

BRENT

Article By RoboForex.com

Attention!
Forecasts presented in this section only reflect the author’s private opinion and should not be considered as guidance for trading. RoboForex LP bears no responsibility for trading results based on trading recommendations described in these analytical reviews.

Fibonacci Retracements Analysis 31.07.2019 (GBPUSD, EURJPY)

Article By RoboForex.com

GBPUSD, “Great Britain Pound vs US Dollar”

It would be better to analyze GBPUSD in the daily chart. As we can see, after breaking the low at 1.2395, the pair is trading towards the post-correctional extension area between 138.2% and 161.8% fibo at 1.2022 and 1.1788 respectively. It’s interesting to note that 1.2395, which earlier was the support, is now the resistance.

GBPUSD_D1
Risk Warning: the result of previous trading operations do not guarantee the same results in the future

The short-term scenario is shown on the H1 chart. After finishing the descending impulse, the pair is starting a new short-term pullback. The support is the low at 1.2118. The correctional targets are 23.6%, 38.2%, and 50.0% fibo at 1.2213, 1.2272, and 1.2320 respectively.

GBPUSD_H1
Risk Warning: the result of previous trading operations do not guarantee the same results in the future

EURJPY, “Euro vs. Japanese Yen”

As we can see in the daily chart, there is a convergence on MACD, which may indicate a possible reverse after the price has reached 76.0% fibo. The targets of this pullback may be 23.6% and 38.2% fibo at 121.67 and 122.62 respectively. The instrument may yet break the support at 120.04, but only after completing the pullback.

EURJPY_D1
Risk Warning: the result of previous trading operations do not guarantee the same results in the future

In the H4 chart, the pair is being corrected after finishing the previous descending impulse. By now, the correction has already reached 38.2% fibo and may continue towards 50.0% and 61.8% fibo at 121.52 and 121.87 respectively.

EURJPY_H4
Risk Warning: the result of previous trading operations do not guarantee the same results in the future

Article By RoboForex.com

Attention!
Forecasts presented in this section only reflect the author’s private opinion and should not be considered as guidance for trading. RoboForex LP bears no responsibility for trading results based on trading recommendations described in these analytical reviews.

Weak Eurozone Data Supports ECB Easing

By Orbex

Eurozone Economic Sentiment Indicator Falls

Expectations that the ECB will have to announce fresh easing measures have increased again this week. This comes as another batch of data out of the eurozone undershot expectations.

The eurozone economic sentiment indicator fell from 103.3 in June to 102.7 in July, raising serious concerns about growth over the remaining half of the year.

The decline was widespread across all sectors. This is particularly concerning as, up to now, services had been able to defy the move lower in manufacturing. The decline in the services sector was mainly as a result of a drop in expectations of future demand, which highlights the bleak outlook for the eurozone.

The manufacturing picture is worse still! Order books continue to weaken, leading to pessimistic business conditions. This has the knock-on effect of reducing employment expectations. The biggest red flags have been the severe declines in production in Germany. And these come on the back of particularly poor German PMIs last week.

Weak German Inflation

The latest inflation figures out of Germany will also be worrying for the central bank. Headline inflationprinted just 1.1% in Germany over July, down from 1.5% in June.

The decline was driven mainly by a price fall in heating oil which has started to move lower compared to last year. Indeed, as the negative impact of weaker oil and slower global growth looks set to continue, inflation is likely to remain stagnant in the coming months. This, in turn, keeps the pressure on the ECB to act.

At its last meeting, the ECB took markets by surprise by refraining from easing. However, the ECB gave a clear signal that it will most likely need to cut rates in the coming months. The bank added that its staff was also discussing alternative measures to fuel growth.

Key Comments From Draghi

Speaking during the post-meeting press conference, Draghi told reporters:

 “[The] last projections were in a sense suggesting that we might have had a rebound in the second part of the year. Now incoming signs show weaknesses – weakness of growth in the second, in the third quarter as well, so this rebound becomes less likely now…The balance of risks was assessed to be on the downside… the simple prolonged and lingering of this uncertainty is by itself a materialization of one of these risks.”

Draghi went on to say:

 “This [economic] outlook is getting worse and worse and it is getting worse and worse in manufacturing and getting worse and worse in countries where manufacturing is very important.”

Commenting further on growth, Draghi said:

The risks surrounding the euro area growth outlook remain tilted to the downside,reflecting the prolonged presence of uncertainties related to geopolitical factors, the rising threat of protectionism, and vulnerabilities in emerging markets.”

Finally, on stimulus, Draghi said:

“A significant degree of monetary stimulus continues to be necessary to ensure that financial conditions remain very favorable and support the euro area expansion, the ongoing buildup of domestic price pressures, and, thus, headline inflation developments over the medium term.”

Technical Perspective

eurusd

For now, EURUSD is fighting to stay above the 1.1130 level support. After a failed break of the bearish trend line from year to date highs, EURUSD traded back down to the level, which is currently holding, presenting a potential triple bottom. However, bulls will need to see price back above 1.3250 to get price out of the danger zone. For now, focus remains on further downside with 1.1027 the next downside level to watch.

By Orbex


The Analytical Overview of the Main Currency Pairs on 2019.07.31

by JustForex

The EUR/USD currency pair

Technical indicators of the currency pair:
  • Prev Open: 1.11448
  • Open: 1.11545
  • % chg. over the last day: +0.12
  • Day’s range: 1.11479– 1.11611
  • 52 wk range: 1.1111 – 1.2009

EUR/USD currency pair began to recover after a prolonged fall. The trading instrument has updated local maxima. At the moment, EUR/USD quotes are consolidating in the range of 1.11350-1.11600. Investors have taken a wait before the Fed’s monetary policy decision. For the first time since 2008, the regulator is expected to cut interest rates. We recommend to pay attention to the comments and rhetoric of the representatives of the Central Bank. Financial market participants will also evaluate a number of important economic releases. Positions must be opened from key levels.

The Economic News Feed for 31.07.2019:

  • – Labour Market Report (GER) – 10:55 (GMT+3: 00);
  • – Consumer Index (EU) – 12:00 (GMT+3:00);
  • – GDP Report (EU) – 00:00 (GMT+3:00);
  • – ADP Nonfarm Employment Change (Jul) (US) – 15:15 (GMT+3:00);
  • – Fed Interest Rate Announcement (US) – 21:00 (GMT+3:00);
EUR/USD

Indicators do not provide accurate signals: 50 MA crossed 100 MA.

The MACD histogram is in the positive zone and continues to rise, indicating a further correction of the EUR/USD quotes.

The Stochastic Oscillator is in the neutral zone, the %K line is above the %D line, which also indicates bullish moods.

Trading recommendations
  • Support levels: 1.11350, 1.11150, 1.11000
  • Resistance levels: 1.11600, 1.11850, 1.12100

If the price consolidates above 1.11600, expect further recovery toward 1.12000-1.12200.

Alternatively, the price can drop toward 1.11000.

The GBP/USD currency pair

Technical indicators of the currency pair:
  • Prev Open: 1.23748
  • Open: 1.22147
  • % chg. over the last day: -1.28
  • Day’s range: 1.21182 – 1.22258
  • 52 wk range: 1.2118 – 1.3385

GBP is still under pressure due to the growing risks of hard Brexit. There are aggressive sales on the GBP/USD currency pair. During yesterday’s and today’s trading, the drop in quotes exceeded 230 points. The trading instrument reached two-year lows. At the moment, the key support and resistance levels are 1.21200 and 1.22000. We expect a further decline in the GBP/USD currency pair and recommend to keep track of current information on the issue of Brexit. Open positions from the key levels.

The Economic News Feed for 31.07.2019 is calm.

GBP/USD

Indicators signal the strength of sellers: the price has fixed below 50 MA and 100 MA.

The MACD histogram is in the negative zone and below the signal line, which gives a strong signal to sell GBP/USD.

The Stochastic Oscillator is in the oversold zone, the %K line crossed the %D line. There are no signals at the moment.

Trading recommendations
  • Support levels: 1.21200, 1.20500
  • Resistance levels: 1.22000, 1.22650, 1.23000

If the price consolidates below 1.21200, expect a further decline toward 1.20800-1.20600.

Alternatively, the quotes can correct toward 1.22500-1.22700.

Registration

The USD/CAD currency pair

Technical indicators of the currency pair:
  • Prev Open: 1.31650
  • Open: 1.31634
  • % chg. over the last day: -0.03
  • Day’s range: 1.31560 – 1.31772
  • 52 wk range: 1.2727 – 1.3664

CAD has stabilized after a rather long growth. At the moment, the USD/CAD currency pair is trading in a flat. Local levels of support and resistance are 1.31500 and 1.31800. The financial market participants expect additional drivers. Today we recommend to pay attention to economic reports from the USA. Trading instrument has the potential for further growth. Positions must be opened from key levels.

The Economic News Feed for 31.07.2019 is calm.

USD/CAD

Indicators do not give accurate signals: the price crossed 50 MA and 100 MA.

The MACD histogram is located near the 0 mark.

The Stochastic Oscillator is in the overbought zone, the %K line crossed the %D line. There are no signals at the moment.

Trading recommendations
  • Support levels: 1.31500, 1.31200, 1.30900
  • Resistance levels: 1.31800, 1.32000

If the price consolidates above 1.31800, expect further growth toward 1.32200-1.32400.

Alternatively, the quotes can drop toward 1.31250-1.31000.

The USD/JPY currency pair

Technical indicators of the currency pair:
  • Prev Open: 108.779
  • Open: 108.612
  • % chg. over the last day: -0.17
  • Day’s range: 108.501 – 108.650
  • 52 wk range: 104.97 – 114.56

The technical pattern on the USD/JPY currency pair is still ambiguous. The trading instrument is consolidating. Currently, the local support and resistance levels are 108.450 and 108.700. Financial market participants expect the Fed to decide on a key interest rate. We also recommend paying attention to the dynamics of US Treasury bond yields. Positions must be opened from key levels.

The Economic News Feed for 31.07.2019 is calm.

USD/JPY

Indicators do not give accurate signals: the price crossed 50 MA and 100 MA.

The MACD histogram is in the negative zone, which signals bearish sentiment.

The Stochastic Oscillator is in the neutral zone, the% K line crossed the% D line. There are no signals at the moment.

Trading recommendations
  • Support levels: 108.450, 108.250, 108.000
  • Resistance levels: 108.700, 108.900, 109.250

If the price consolidates below 108.450, the quotes will fall toward 108.000.

Alternatively, the quotes can grow toward 109.000-109.200.

by JustForex

Currency Majors Are Consolidating. The Fed Meeting Is in the Focus of Attention

by JustForex

The US dollar does not change a lot against a basket of major currencies. The US dollar index (#DX) closed with a slight increase (+0.02%). Financial market participants expect the Fed to decide on the interest rate. Experts forecast that the regulator should reduce the range of the key interest rate for the first time since 2008. After the announcement of the decision, Fed Chairman, Jerome Powell, will hold a press conference. Investors will closely monitor the official’s speech and look for signals regarding the future rate of monetary policy this year.

The US currency was under pressure due to the statements about the negotiations with China by US President, Donald Trump. As the President said, China delayed trade talks once again, which should have already begun. Trump believes that Beijing waits for the 2020 US presidential elections to make a deal with the new president and continue to “ripoff” the United States.

The British pound is still under pressure. The new British Prime Minister, Boris Johnson, repeated that he would not make a deal with the EU until the condition of the backstop (a process that will help to avoid the resumption of customs control and unhindered trade on the border between Northern Ireland and the Republic of Ireland) would be excluded from it. EU officials said they did not intend to resume negotiations on the Brexit deal.

Today, during the Asian trading session, optimistic data from China have been published. Thus, manufacturing PMI counted to 49.7 in July and was better than the forecasted value of 49.6. Also, the consumer price index (q/q) was published in Australia, which increased by 0.6% in the second quarter instead of 0.5%.

The bullish sentiment continues to prevail in the “black gold” market. At the moment, futures for the WTI crude oil are testing the mark of $58.25 per barrel. At 17:30 (GMT+3:00), crude oil inventories will be published in the US.

Market Indicators

Yesterday, the bearish sentiment was observed in the US stock markets: #SPY (-0.25%), #DIA (-0.08%), #QQQ (-0.43%).

The 10-year US government bonds yield is 2.05-2.06%.

The news feed for 2019.07.31:

– Statistics on the labor market in Germany at 10:55 (GMT+3:00);
– Consumer price index in the Eurozone at 12:00 (GMT+3:00);
– Data on Eurozone GDP at 12:00 (GMT+3:00);
– ADP nonfarm employment change in the US at 15:15 (GMT+3:00);
– Report on Canada GDP at 15:30 (GMT+3:00);
– Fed interest rate decision at 21:00 (GMT+3:00).

by JustForex

Markets Mixed Ahead Of Fed Decision Today

By Orbex

The Federal Reserve’s FOMC will be concluding its two-day monetary policy meeting today. Investors are bracing for a quarter basis point rate cut at today’s meeting. Besides the FOMC decision today, US and China trade talks have resumed. However, investors are less optimistic that a trade deal could be reached. As a result, the US dollar closed flat on Tuesday.

Euro Showing Signs of Bottoming

The common currency is seen consolidating near the lows. After slipping to 1.1101, the EURUSD currency pair has been attempting to post a bottom. Germany’s flash inflation estimates were positive. For July, headline CPI was seen rising 1.7%, advancing from 1.6% in June. The eurozone’s flash inflation estimates are due today. Forecasts point to a slower increase in consumer prices.

EURUSD Could Bounce Higher

The consolidation near the 1.1140 level of support is showing signs that the currency pair is preparing for a short term correction to the upside. The resistance level of 1.1250 remains the key challenge to the upside. As long as this resistance level is not breached, the currency pair is biased to the downside.

EURUSD

Sterling Chalks a New Two-Year Low

The declines in the pound sterling continued with the GBP falling to a fresh two-year low. The current bearish momentum in GBPUSD could eventually push it further down to test a three-year low. The declines come as investors adjust their expectations to price in a no-deal Brexit. The EU and the UK are in a stalemate with the Irish backstop arrangement being the sticking point for the two sides.

GBPUSD Rebounding off the Two-Year Low

The cable is seen rebounding off the lows at 1.2125, but price action remains confined to the previous H4 session. Given that the USD will be volatile today, GBP could likely rise in the near term. However, the upside bias remains weak at the moment. A breakdown below 1.2125 could, however, trigger further declines that could push GBPUSD down to 1.1990.

GBPUSD

Gold Prices Hold Steady Near the Top

The precious metal managed to post some modest gains on Tuesday but price action remains subdued. This indicates that investors are likely to wait on the sidelines into today’s Fed meeting. Economic data on Tuesday saw US inflation slipping below the Fed’s 2.0% inflation target rate.

Outlook for XAUUSD Remains Mixed

Price has stalled near the resistance area of 1431–1428 on the 4-hour chart. If this resistance holds, we could expect to see a downside breakout. However, given the volatility, we could expect a short term rebound to the upside. The previous highs near 1440 levels remain key. To the downside, a breakdown of the rising trend line could signal a move to 1404 level of support.

Gold

By Orbex