US Fed Set To Rattle Global Markets – Part I

By TheTechnicalTraders.com

With less than 24 hours to go before the US Fed rate decision announcement, all eyes are watching how the US stock market is reacting to the possibility of a rate cut (25 basis point) that has been telegraphed by the US fed many weeks in advance. Almost as if the US stock market is moving against all odds, the S&P and NASDAQ have pushed higher into new all-time high territory while the Dow Jones index currently trades just below recent highs.  What should traders expect with the Fed announcement and beyond?

Probability of Rate Cut Percent

First, we need to understand the global markets have already priced a 25 basis point rate decrease into the markets based on expectations.  The CME Fed expectations data suggests the market is 78.1% confident that a 25 basis point rate decrease will happen.

Source (CME)

This suggests that global traders are already prepared for this move and we may not see much volatility if the US Fed does not surprise anyone with their language/future expectations.

We believe the US Fed is taking this rate decrease to ease the supply of US Dollars throughout the world.  Over the past 18+ months, the strength of the US Dollar has prompted a shift away from weaker global economies and into the US equities market, US Treasuries and the US Dollar.  We believe this shift is reaching a critical moment in time where the fragility of the foreign markets has reached a tipping point.

Weekly US Dollar chart

You can see from this Weekly US Dollar chart that the rally from the bottom in early 2018 has been tremendous – +11.25% and climbing.  While this US Dollar rally has taken place, many foreign currencies have continued to weaken while the global economy has recently slowed to a crawl.  As long as the US Dollar stays within the magenta price channel moving forward, we expect this trend to continue.

The shift in how capital is being deployed and the stress that continues throughout the globe with regards to economic activity and output is related to something that we believe took place back in 2007 through 2016 – the global effort to support a very weak global economy.

We highlighted some of our thoughts in this recent research post about the black hold in global banking.

Overall, we believe the actions by the global central banks and the US Fed from 2007 till 2016 created a “setup” in the global markets that very few people foresaw or understood.  This shift happened at a pace and fever that few people could comprehend and came to a head in November 2016 when President Trump was elected.  We believe it happened somewhat like this…

2004~2006: Greenspan raises rates on an unprecedented scale (over 450%) pushing the US/global banking/credit sector into crisis in 2007-08

2008~2010: As the biggest global banking/credit crisis unfolds, the US Fed and global central banks do everything possible to save the world from decades of economic malaise and destruction.  US Fed lowers interest rates to near ZERO creating a run on US dollar debt/credit.

The Current Market Setup

2011~2015: As foreign market engages in debt/credit expansion, infrastructure projects and an “easy money” rally mode, something begins to change in 2014~2015.  China realizes the nation’s wealth is being exported to the US and other markets as well as a US stock market rotation that shocked the global investors.

2016~2017: The US Elections (2016) took the focus away from the global markets for a period of 15+ months and allowed the easy US Dollar trading activities to continue into hyperspace.  This is when many foreign nations/companies took huge risks leveraging debt and success into future debt/risks based on a belief that “this success will never end”.

Then This Happened…

January 2017: President Trump is sworn in and the US Fed begins raising rates aggressively.  The disruption that resulted from this 2017 combination event resulting in one of the largest “global unwinding” processes we’ve seen in quite a while and it has really only just begun.

The downward rotation in the US Dollar in early 2017 as a result of uncertainty in US policy and perceived strength in foreign markets as US interest rates were still relatively low – under 1.4% most of that time.  After US FFR rates crossed above the 1.75% level, the easy US Dollar carry trade became much more difficult to maintain and foreign investors had already setup trillions in debts expecting the US Fed to maintain easy money policies for decades.

Source: https://fred.stlouisfed.org/series/EFFR

What is the US Fed expected to do at this time?  Either they lower the FFR so that the global markets can continue to run their credit/debt functions and attempt to deleverage the “setup” over the next 5+ years or the US Fed risks creating a run-away train type of scenario where foreign central banks lack the ammo to support their own economies and the US Fed risks creating hyper-inflation by not acting accordingly.  In short, the US Fed to the global bankers rescues again.

Well, here we go with the US Fed setting the policy and expectations for the future as this incredible 1800% FFR rate increase has pushed the global markets into potential turmoil.  We’ll complete our research in the second half of this research post in a few hours stay tuned!

CRUCIAL WARNING SIGNS ABOUT GOLD, SILVER, MINERS, And S&P 500

In early June I posted a detailed video explaining in showing the bottoming formation and gold and where to spot the breakout level, I also talked about crude oil reaching it upside target after a double bottom, and I called short term top in the SP 500 index. This was one of my premarket videos for members it gives you a good taste of what you can expect each and every morning before the Opening Bell. Watch Video Here.

I then posted a detailed report talking about where the next bull and bear markets are and how to identify them. This report focused mainly on the SP 500 index and the gold miners index. My charts compared the 2008 market top and bear market along with the 2019 market prices today. See Comparison Charts Here.

On June 26th I posted that silver was likely to pause for a week or two before it took another run up on June 26. This played out perfectly as well and silver is now head up to our first key price target of $17. See Silver Price Cycle and Analysis.

More recently on July 16th, I warned that the next financial crisis (bear market) was scary close, possibly just a couple weeks away. The charts I posted will make you really start to worry. See Scary Bear Market Setup Charts.

CONCLUDING THOUGHTS:

In short, you should be starting to get a feel of where each commodity and asset class is headed for the next 8+ months. The next step is knowing when and what to buy and sell as these turning points take place, and this is the hard part. If you want someone to guide you through the next 12-24 months complete with detailed market analysis and trade alerts (entry, targets and exit price levels) join my ETF Trading Newsletter.

Be prepared for these incredible price swings before they happen and learn how you can identify and trade these fantastic trading opportunities in 2019, 2020, and beyond with our  Wealth Building & Global Financial Reset Newsletter.  You won’t want to miss this big move, folks.  As you can see from our research, everything has been setting up for this move for many months.

Join me with a 1 or 2-year subscription to lock in the lowest rate possible and ride my coattails as I navigate these financial market and build wealth while others lose nearly everything they own during the next financial crisis.

As a technical analysis and trader since 1997, I have been through a few bull/bear market cycles. I believe I have a good pulse on the market and timing key turning points for both short-term swing trading and long-term investment capital. The opportunities starting to present themselves will be life-changing if handled properly.

FREE GOLD OR SILVER WITH MEMBERSHIP!

Kill two birds with one stone and subscribe for two years to get your FREE PRECIOUS METAL and get enough trades to profit through the next metals bull market and financial crisis!

Chris Vermeulen –  TheTechnicalTraders.com

EURUSD: trading range from the 25th of July still intact

By Alpari.com

Previous:

On Tuesday the 30th of July, trading on the EURUSD pair closed 0.09% up. The pair remained within the range from the 25th of July. The single currency is getting propped up via the EURGBP cross, which has been on the rise since the 25th of July on the back of Brexit uncertainty.

The British pound is under pressure over the increased likelihood of the UK exiting the European Union without a deal. New Prime Minister Boris Johnson has said that the UK should prepare for no deal if the EU refuses to compromise.

Day’s news (GMT+3):

  • 10:55 Germany: unemployment rate (Jul).
  • 12:00 Eurozone: CPI (Jul), GDP (Q2), unemployment rate (Jun).
  • 15:15 US: ADP employment change (Jul).
  • 15:30 Canada: GDP (May).
  • 16:45 US: Chicago PMI (Jul).
  • 17:30 US: EIA crude oil stocks change (26 Jul).
  • 21:00 US: Fed interest rate decision and monetary policy statement.
  • 21:30 US: FOMC press conference.

Current situation:

My prediction that we’d get a test of the lower boundary of the 1.1100 – 1.1188 range has not yet come to pass. The EURUSD pair has been trading sideways for the last 3 days. The rally on the EURGBP pair is providing support to the euro, so markets are largely ignoring the ECB’s intention to ease monetary policy and even lower interest rates.

I’m still expecting 1.11 to be tested. We can’t rule out either boundary of our range being reached. Still, the odds are in favour of a drop.

There’s no chart today because markets are waiting on the FOMC interest rate decision. A rate reduction of 25 base points has already been factored in, so we may get some sharp movements if the key rate is reduced by 50 base points, or if we get some dovish rhetoric from Jerome Powell during the press conference to follow. Talks between the US and China have begun in Shanghai. Markets do not have high hopes for this. Today’s economic event calendar is quite full.

By Alpari.com

FED rate cut on Wednesday fully priced in. Gold about to drop?

By Admiral Markets

Source: Economic Events 31 July 2019 – Admiral Markets’ Forex Calendar

Today, we want to focus on the FED rate decision and its potential impact on Gold.

After the short push to new yearly highs in Gold after the comments from NY president Williams, which resulted in a spike in market expectations of a 50 basis point cut, these expectations stabilised over the past few days with markets currently expecting a 25 basis point rate cut from the FED.

What’s potentially interesting now is that the market seems to have nearly completely priced in any dovish remarks and speculation around monetary stimulus from the US central bank.

With that in mind, the upside potential in the yellow metal seems limited, having already priced out the chances of four rate cuts in 2019 (which currently ranks at slightly below 20% according to the FED Watch Tool), especially if the upcoming US economy data sets on Thursday (ISM Manufacturing) and Friday (Non-Farm Payrolls) report any positive data.

That said, price action wise, chances seem high that Gold will see a stint towards and probably below 1,400 USD with a first target around 1,380 USD.

But even if we break below 1,380 USD in the second half of the trading week, we maintain our mid-term bullish Gold bias and consider the region around 1,360/365 as a potential mid-term long-trigger with a first target to be found around 1,480/490 USD.

Source: Admiral Markets MT5 with MT5SE Add-on Gold Daily chart (between 25 April 2018 to 30 July 2019). Accessed: 30 July 2019 at 10:00 PM GMT

Please note: Past performance is not a reliable indicator of future results, or future performance.

In 2014, the value of Gold fell by 1.7%, in 2015, it fell by 10.4%, in 2016 it increased by 8.1%, in 2017 it increased by 13.1%, in 2018, it fell by 1.6%, meaning that after five years, it was up by 6.4%.

Trade CFDs on Gold

Disclaimer: The given data provides additional information regarding all analysis, estimates, prognosis, forecasts or other similar assessments or information (hereinafter “Analysis”) published on the website of Admiral Markets. Before making any investment decisions please pay close attention to the following:

  1. This is a marketing communication. The analysis is published for informative purposes only and are in no way to be construed as investment advice or recommendation. It has not been prepared in accordance with legal requirements designed to promote the independence of investment research, and that it is not subject to any prohibition on dealing ahead of the dissemination of investment research.
  2. Any investment decision is made by each client alone whereas Admiral Markets shall not be responsible for any loss or damage arising from any such decision, whether or not based on the Analysis.
  3. Each of the Analysis is prepared by an independent analyst (Jens Klatt, Professional Trader and Analyst, hereinafter “Author”) based on the Author’s personal estimations.
  4. To ensure that the interests of the clients would be protected and objectivity of the Analysis would not be damaged Admiral Markets has established relevant internal procedures for prevention and management of conflicts of interest.
  5. Whilst every reasonable effort is taken to ensure that all sources of the Analysis are reliable and that all information is presented, as much as possible, in an understandable, timely, precise and complete manner, Admiral Markets does not guarantee the accuracy or completeness of any information contained within the Analysis. The presented figures refer that refer to any past performance is not a reliable indicator of future results.
  6. The contents of the Analysis should not be construed as an express or implied promise, guarantee or implication by Admiral Markets that the client shall profit from the strategies therein or that losses in connection therewith may or shall be limited.
  7. Any kind of previous or modeled performance of financial instruments indicated within the Publication should not be construed as an express or implied promise, guarantee or implication by Admiral Markets for any future performance. The value of the financial instrument may both increase and decrease and the preservation of the asset value is not guaranteed.
  8. The projections included in the Analysis may be subject to additional fees, taxes or other charges, depending on the subject of the Publication. The price list applicable to the services provided by Admiral Markets is publicly available from the website of Admiral Markets.
  9. Leveraged products (including contracts for difference) are speculative in nature and may result in losses or profit. Before you start trading, you should make sure that you understand all the risks.

By Admiral Markets

Asian equities recoil at Trump’s confrontational tone around US-China trade imbalance

By Han Tan, Market Analyst, ForexTime

Asian equities are following US stocks lower, after US President Donald Trump once again adopted a confrontational tone in addressing the US-China trade imbalance. Such rhetoric fuels market caution, adding to the sense that a US-China trade deal remains far from imminent, even as negotiations are underway in Shanghai.

The tepid prospects of a US-China trade deal in the near-term have prevented meaningful gains in riskier assets, including most Asian currencies. Besides developments surrounding the US-China trade conflict, Asian currencies will also be subjected to the Dollar’s path post-Fed rate cut, both of which have contributed to a subdued outlook for regional currencies.

Dollar index swats away naysayers and remains elevated ahead of Fed decision

Despite the dovish tones out of the Federal Reserve, the Dollar index (DXY) has swatted its naysayers aside, as it remains above the 98 psychological level at the time of writing. With the crucial Federal Reserve decision due overnight, markets are betting that US interest rates will not be lowered by more than 25 basis points.

Investors around the world will be eagerly awaiting whether the Federal Reserve will affirm market expectations and deliver its first rate cut in a decade, which should also set the tone for policy easing out of other major central banks. The Dollar’s gains have been reinforced by US economic fundamentals, given the still-healthy consumer spending levels while inflation is ticking towards the Fed’s two percent target. Should the Fed deem it sufficient to just incur one “insurance” rate cut, which has been fully priced in by the markets, that could help justify the Dollar’s recent advances.

Brexit impasse adds to Sterling’s slippery slope

Although the Pound managed to bounce off the 1.212 level against the US Dollar at the time of writing, the weakening bias for GBPUSD remains clear amid intensifying concerns over a no-deal Brexit. With just three months remaining before the October 31 Brexit deadline, the hardline stance employed by new UK Prime Minister Boris Johnson has done little to assuage concerns that the UK will avoid crashing out of the EU without a deal.

The backdrop of deteriorating global growth may exacerbate the projected economic turmoil that comes with a hard Brexit. Such a worst-case scenario could well send the Pound below the 1.20 level against the Greenback. The Pound’s only hope for a sustained climb is for either PM Johnson or EU officials to creak open the door towards renegotiating the Brexit deal, although such a scenario appears elusive at the time of writing.

Gold, Oil climb despite Dollar’s never-say-die stance

Gold and Oil prices have advanced despite the Dollar’s resilience, with Bullion trading above $1430 at the time of writing while Brent futures have breached $65/bbl for the first time in two weeks. Gold prices could see more upside in the near-term, should markets look past the Fed and focus on the waning global growth momentum, especially considering that revived US-China trade talks have so far yielded naught.

Oil bulls can take heart from incoming monetary policy stimulus that should help shore up global economic activity, and in turn support demand for Oil. Still, the risk remains for Oil to unwind recent gains should the support from global central bankers be deemed insufficient in staving off economic headwinds.

Disclaimer: The content in this article comprises personal opinions and should not be construed as containing personal and/or other investment advice and/or an offer of and/or solicitation for any transactions in financial instruments and/or a guarantee and/or prediction of future performance. ForexTime (FXTM), its affiliates, agents, directors, officers or employees do not guarantee the accuracy, validity, timeliness or completeness, of any information or data made available and assume no liability as to any loss arising from any investment based on the same.


Forex-Time-LogoArticle by ForexTime

ForexTime Ltd (FXTM) is an award winning international online forex broker regulated by CySEC 185/12 www.forextime.com

Equities slip ahead of Fed rate cut decision

By IFCMarkets

US stocks pull back as Trump warns China against waiting for US elections

US stock indexes pulled back on Tuesday as President Trump tweeted China may be waiting to see if Democrats win election but warned that “if & when I win, the deal that they get will be much tougher than what we are negotiating now…or no deal at all.” The S&P 500 lost 0.3% to 3013.18 with mixed corporate reports providing little support. Dow Jones industrial slipped 0.1% to 27198.02. The Nasdaq lost 0.2% to 8273.61. The dollar strengthening paused ahead widely expected Fed decision of a 25 basis point rate cut today while core personal consumption expenditure index increased at previous month’s pace of 0.2% over month in June: the live dollar index data show the ICE US Dollar index, a measure of the dollar’s strength against a basket of six rival currencies, gained less than 0.1% to 98.06 but is lower currently. Stock index futures point to higher market openings today

DAX 30 leads European indexes losses

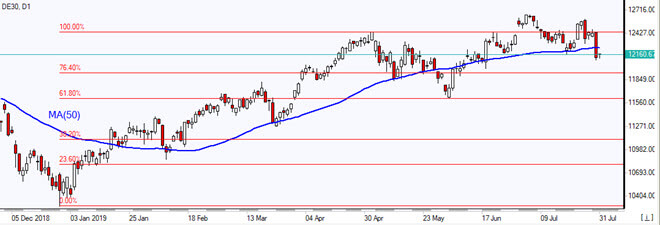
European stocks ended sharply lower on Tuesday undermined by weak earnings reports and renewed US-China trade war concerns after President Trump hardened his rhetoric in tweets. The EUR/USD continued its climb with GBP/USD’s slump intact yesterday but both pairs are higher currently. The Stoxx Europe 600 ended 1.5% lower. The German DAX 30 dropped 2.2% to 12147.24 dragged by Bayer and Lufthansa losses while GfK reported German consumer confidence fell third consecutive month. France’s CAC 40 fell 1.6%. UK’s FTSE 100 lost 0.5% to 7646.77.

DE30 closes below MA(50)     07/31/2019 Market Overview IFC Markets chart

Hang Seng paces Asian indexes retreat

Asian stock indices turned lower today as President Trumps warned China that any deal after 2020 election would be much tougher after he is re-elected. Nikkei lost 0.9% to 21521.53 as yen climb against the dollar slowed. Chinese stocks are falling as data showed China’s factory activity contracted again in July: the Shanghai Composite Index is down 0.7% and Hong Kong’s Hang Seng index is 1.2% lower. Australia’s All Ordinaries Index fell 0.5% as Australian dollar’s climb against the greenback resumed.

Brent rising as US crude oil inventories drop is expected

Brent futures prices are edging lower today. The American Petroleum Institute late Tuesday report indicated US crude inventories fell by 6 million barrels last week. Prices rose yesterday: October Brent gained 1.6% to $66.63 a barrel on Tuesday. Today at 16:30 CET the Energy Information Administration will release US Crude Oil Inventories.

Market Analysis provided by IFCMarkets

Note:
This overview has an informative and tutorial character and is published for free. All the data, included in the overview, are received from public sources, recognized as more or less reliable. Moreover, there is no guarantee that the indicated information is full and precise. Overviews are not updated. The whole information in each overview, including opinion, indicators, charts and anything else, is provided only for familiarization purposes and is not financial advice or а recommendation. The whole text and its any part, as well as the charts cannot be considered as an offer to make a deal with any asset. IFC Markets and its employees under any circumstances are not liable for any action taken by someone else during or after reading the overview.

Mylan Gets a Shot in the Arm with Pfizer Merger Deal

By The Life Science Report

Source: Streetwise Reports   07/29/2019

EpiPen manufacturer Mylan N.V. announced today that the company will merge with Pfizer Inc.’s Upjohn Division, which holds Pfizer’s off-patent branded and generic drugs, forming a new company.

Mylan Inc. (MYL:NASDAQ) and Pfizer Inc. (PFE:NYSE) today announced a definitive agreement to combine Mylan with Upjohn, Pfizer’s off-patent branded and generic established medicines business, creating a new global pharmaceutical company.

The report noted, “Under the terms of the agreement, which is structured as an all-stock, Reverse Morris Trust transaction, each Mylan share would be converted into one share of the new company. Pfizer shareholders would own 57% of the combined new company, and Mylan shareholders would own 43%. The Boards of Directors of both Mylan and Pfizer have unanimously approved the transaction.”

“The combination will be effected through a Reverse Morris Trust, under which Upjohn is expected to be spun off or split off to Pfizer’s shareholders and simultaneously combined with Mylan,” the release noted.

Plans for the merger have sent Mylan shares up more than 14% on the day. Mylan and Pfizer also issued second quarter earnings reports and Mylan further announced the retirement of CEO Heather Bresch effective upon the close of the above transaction in mid-2020.

In its quarterly earnings report Mylan announced total revenues for the three months ended June 30, 2019, were $2.85 billion, compared to $2.81 billion for the comparable prior year period, representing an increase of $43.2 million, or 2%. It further reported a U.S. GAAP diluted loss per ordinary share of ($0.33) as compared to earnings of $0.07 per ordinary share in the prior year period and adjusted diluted EPS of $1.03, as compared to $1.07 in the prior year period.

In a separate release, Mylan’s Board of Directors announced the retirement of CEO Heather Bresch, which will be effective upon the closing of the combination of Mylan and Upjohn, a division of Pfizer. The transaction is anticipated to close in mid-2020, subject to customary closing conditions, including receipt of regulatory approvals, and approval by Mylan shareholders. Board Chairman Robert J. Coury commented, “On behalf of Mylan’s Board of Directors, I extend my gratitude and respect for Heather Bresch’s years of extraordinary and passionate leadership at Mylan, which helped to pave the way for today’s historic announcement regarding the combination of Mylan and Upjohn.” He further pointed out that Bresch was named the first female CEO of a Fortune 500 global pharmaceutical company.

On a busy news day for both companies, Pfizer also posted second quarter earnings reporting Q2/19 revenues of $13.3 billion, reflecting 2% operational growth driven by 6% operational growth from Pfizer Biopharmaceuticals Group and Q2/19 reported diluted EPS of $0.89, and adjusted diluted EPS of $0.80.

Mylan N.V. is a global pharmaceutical company that develops, licenses, manufactures, markets and distributes generic, brand name and over-the-counter products in a range of dosage forms and therapeutic categories. Mylan is a maker of Epinephrine Auto-Injectors (EpiPens), which are used for the emergency treatment of life-threatening allergic reactions (anaphylaxis) caused by allergens, exercise or unknown triggers; and for people who are at increased risk for these reactions.

Pfizer is a research-based global biopharmaceutical company engaged in the discovery, development and manufacture of healthcare products. Its global portfolio is composed of many household name brand prescription medications including Prevnar 13, Xeljanz, Eliquis, Lipitor, Celebrex, Pristiq and Viagra.

On the news, Mylan shares opened up higher today at $20.95 (+2.49, +13.49%) and are currently trading at $21.01/share. Pfizer shares opened down slightly at $42.17 (-$0.92, -2.14%) and have traded between $41.75 to $43.00 today.

( Companies Mentioned: MYL:NASDAQ,
PFE:NYSE,
)

Upcoming Chinese PMIs (NBS & Caixin)

By Orbex

Contrary to other countries, this week is relatively quiet on the Chinese economic calendar.

The most important event coming up is the release of the official PMI and the private Caixin PMI survey. Both of these releases could likely move the markets.

This is also the first PMI since trade negotiations with the US were restarted … again. We’re also at the one year anniversary of the trade war, so year-on-year comparables will reference the shock in the market at the start of tariffs.

Even though negotiations have restarted between the world’s two largest economies, there hasn’t been much progress lately to encourage optimism among Chinese firms.

What We Are Looking For

Official (NBS) manufacturing and non-manufacturing PMIs will be coming out early on Wednesday. Then, the day after, we have the manufacturing PMI from Caixin. These are the only events on the economic calendar, so we could expect to see a stronger reaction to the data.

Expectations are for the NBS manufacturing PMI to slip further into contraction territory at 49.0, compared to 49.4 in the prior month. We can expect non-manufacturing PMI to improve a bit to 54.5 from 54.2 in the prior month. This would be the second consecutive month of contraction.

Even though last month’s result might have been dismissed as a technical outlier, a drop to 49 would be confirmation that China’s outlook in the manufacturing sector has stopped growing.

The next day we have Caixin manufacturing PMI. Expectations are for this to improve to 49.7 from 49.4 last month. This would bring the figure back to being just technical contraction.

The Divergence

The NBS survey covers primarily large, state-owned companies, a significant number of which are export-oriented. By comparison, Caixin covers a broader range with a higher ponderance of small, private companies.

These have been the target of the government’s recent stimulus, and also are said to be more flexible. This could be the explanation for the divergence in the surveys (generally it’s the NBS that comes in more positive than the private one).

Smaller companies are also more dependent on the domestic market, as are service companies. While manufacturing continues to have a poor outlook, services continues to trend higher, riding on internal demand in China.

Pay Attention to the Components

Last month’s, a drop in new orders dragged down manufacturing PMIs. This happened after President Trump’s announcement to impose tariffs on Chinese goods. With that threat removed this time around, it will be relevant to see if there is a rebound in the figure.

A couple of weeks ago, we had some indicative data that provides a more pessimistic outlook for the CNY and, by extension, the major commodity currencies that supply the world’s largest manufacturing center.

Quarterly GDP disappointed projections, and retail sales in June were also lower than expected. Although industrial production continued to grow, the pace had leveled off. And a poor showing in the PMIs this time around would further a pessimistic view!

By Orbex


Technical Analyst: The Outlook for Oil Is Bleak

The Energy Report

Source: Clive Maund for Streetwise Reports   07/29/2019

Technical analyst Clive Maund explains why he is bearish on oil and what could alter that outlook.

A commodity that will certainly not do well in a recession/depression is oil. So much capacity has been brought on-stream in recent years, particularly in the U.S., that in any economic contraction, supply will quickly turn into oversupply. As we know, a cyclical recession/depression is already well overdue and it has only been staved off so far by rate slashing and reckless money printing, which will eventually have catastrophic consequences. We have now arrived at the stage where desperate rate reductions and bouts of QE are having little to no effect—they are pushing on a piece of string as we transition from the stage where we have zombie banks and companies to a global zombie economy.

About the only hope for the oil producers is if they can somehow engineer a crisis by, for example, goading Iran into blocking the Straits of Hormuz, and, as it happens, that appears to be what is in train, and they have much more chance of achieving this because they have Israel on side, which is looking for any opportunity to inflict damage on Iran.

While the blocking of the Straits of Hormuz and the ensuing crisis in the oil markets would certainly generate massive windfall profits for oil producers and oil companies over a medium-term timeframe, this tactic will not be good for anyone long-term because it will implode the global economy, which is already in a very fragile state due to widespread extreme debt. So we have to ask whose priorities will prevail—that of the international community of nations, or that of Israel and the oil producing countries and companies, who, to put it mildly, are an extremely powerful lobby, and from what we are seeing on the ground so far with various orchestrated incidents near to and in the Persian Gulf, the will of the latter may be about to prevail and if it does, we are looking at an imminent extreme economic crisis. The one hope is that common sense will prevail and that Israel and the oil producers and companies grasp that it is ultimately not in their interest either to implode the world economy. However, as we recall, common sense did not prevail before either the First World War or the Second, or for that matter Vietnam.

The average citizen has no more understanding of what is really going on in the world of geopolitics than a Labrador. Consider the typical British “Tommy” going off to fight in the First World War. These men were mostly young and while not necessarily stupid, they were woefully ignorant and naïve and many of them paid for it with their lives or their health—who but an idiot would go and stand in a mud-filled trench for up to four years for a politician?—and that’s if they survived that long. They succumbed to the lie—perpetuated to this day more than a hundred years later—that the Germans were predatory aggressors who had to be confronted to “defend the Empire” when the truth was the polar opposite. The British Empire felt threatened by the rise of Germany and tricked it into a war so that it could destroy it. This is why, after the war, Germany was subject to onerous reparations that resulted in hyperinflation and the death of millions. When you grasp this you understand precisely why these injustices and the extreme conditions they gave rise to created the conditions for Hitler to come to power. This is pointed out to illustrate that you should never believe the official tabloid line on anything, and right now that includes the story being spun with respect to Iran.

Having glanced at the fundamentals we will now proceed to look at the oil charts, specifically those for light crude. We will “drill down,” starting with a very long-term chart and working our way through a range of charts and then more horizontally by ending with a look at a couple of shorter-term charts.

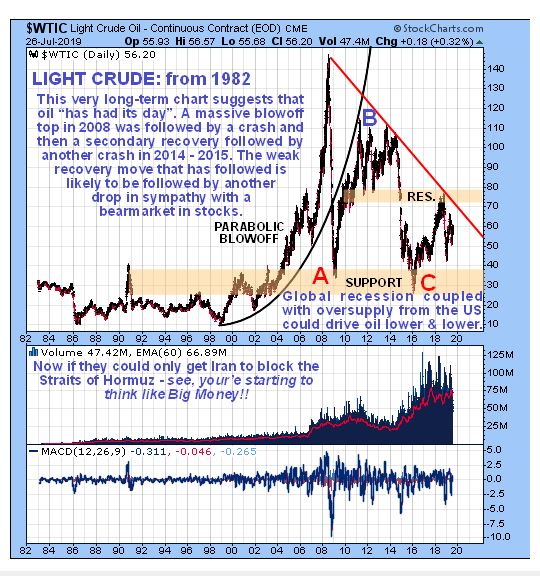
The very long-term chart going way back to 1982 is most interesting and gives us a “big picture” perspective on what is going on. On this illuminating chart we see that oil has essentially been in a major bear market since its massive 2008 parabolic blowoff top. The pattern is a classic 3-wave A-B-C bear market starting with an A-wave slam in 2008 that was, of course, made much worse because it synchronized with the general market crash at that time. This was followed by a big B-wave countertrend bear market rally that got as high as about $113 in 2011, whereupon, after a topping out process, it went into the destructive C-wave decline that took it even lower than the 2008 crash low by the time it hit bottom early in 2016 and led to the laying off of many U.S. oil workers. A driving force behind this decline was the attempt to crush Russia, which is highly dependent on oil revenue, but the attempt failed because Russia can cope with lower oil prices. Even though the C-wave low normally marks the end of the bear market, we would still need to see a bottoming process, which means that oil could easily return to its lows again, and if a recession/depression hits it is likely to drop well below them, especially given all the new capacity brought online in recent years, as mentioned above. So, barring a blocking of the Straits of Hormuz, the outlook is grim.


The 14-year chart allows us to see in more detail the bear market from the 2008 parabolic blowoff top to the present. The 2008–2009 crash plunge was followed by a big B-wave countertrend rally that peaked at about $113, and after the development of a topping Triangle was followed by another severe decline that was triggered by failure of the lower boundary of the Triangle. While this decline was not as extreme as the one in 2008, it caused mayhem in the U.S. oil industry. Since the early 2016 low we have seen a lesser recovery which petered out late last year leading to renewed decline. While the bear market could have ended with the C-wave low early in 2016, that depends on whether or not the economy holds up, which at this point doesn’t look likely, but even if it does the oil market will probably need to build out a base that will probably involve a test of those lows.


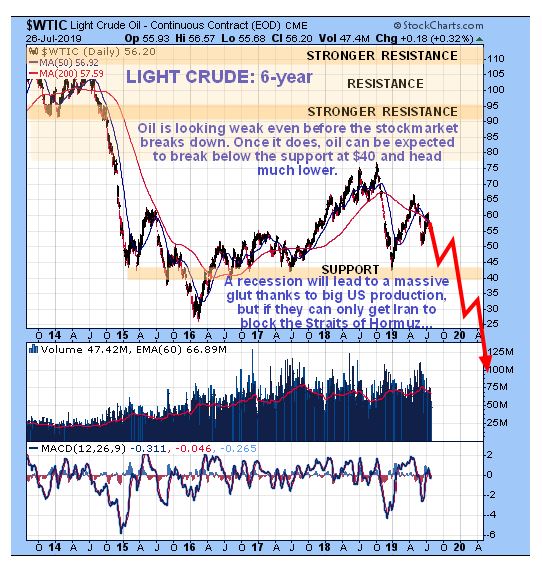
Zooming in further via the 6-year chart we see that, while the price recovery from the early 2016 lows has certainly been significant in percentage terms, the uptrend was rather insipid and led to it reversing into another decline late last year. Right now it is looking weak and prone to further decline, which will be exacerbated if stocks enter a bear market soon, as looks likely.


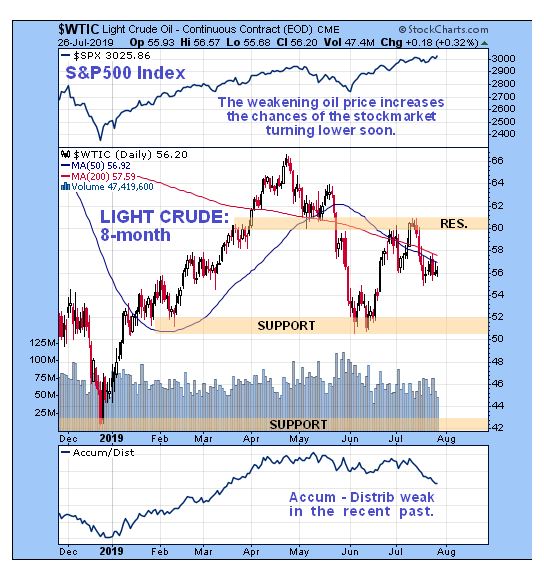
On the latest 8-month chart we see recent action in much more detail, and on this chart we have appended the Accumulation line at the bottom and the S&P500 index at the top. The Accumulation line is weak—it is well below where it was at the June price trough—which is bearish and calls for lower prices down the road. The oil price may also be a “canary in the coal mine” for the stock market, since sagging demand for oil is not a sign of a strong economy, and you will recall from the recent update on the US stock market that we are not taken in by the performance of the “shop window” Dow Industrials and S&P500 indices, which are skewed due to data manipulation.


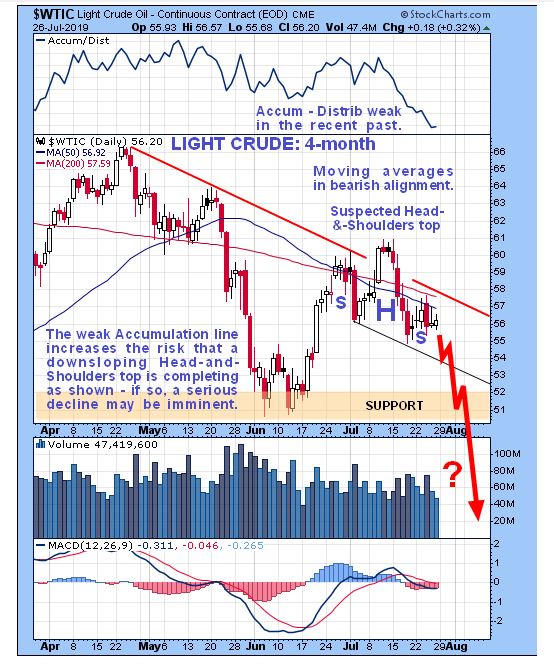
Finally, we look at the 4-month chart which allows us to see recent action in even more detail. On this chart we can see that an ugly little pattern has formed over the past month which is suspected to be a small downsloping Head-and-Shoulders top that projects the price down at least to the support in the $50 area and possibly lower with the chances of this scenario eventuating greatly increased by the weak accumulation line shown at the top of the chart.


As for oil stocks, recently they have been moving largely in tandem with oil itself, as we can see on the latest 6-month chart for the XOI oil index, which has the Light Crude chart added at the top. This chart looks weak with momentum rolling over and moving averages in bearish alignment, suggesting that this index will break below the nearby support it is perched just above and drop. So, in general, oil stocks look like a good short here.


So, to sum up, barring an extreme development like Iran blocking the Strait of Hormuz, the outlook for oil is bearish and bleak, with lower prices in prospect and possibly much lower prices.

Originally published on CliveMaund.com on July 28, 2019.

Clive Maund has been president of www.clivemaund.com, a successful resource sector website, since its inception in 2003. He has 30 years’ experience in technical analysis and has worked for banks, commodity brokers and stockbrokers in the City of London. He holds a Diploma in Technical Analysis from the UK Society of Technical Analysts.

Sign up for our FREE newsletter at: www.streetwisereports.com/get-news

Disclosure:
1) Statements and opinions expressed are the opinions of Clive Maund and not of Streetwise Reports or its officers. Clive Maund is wholly responsible for the validity of the statements. Streetwise Reports was not involved in the content preparation. Clive Maund was not paid by Streetwise Reports LLC for this article. Streetwise Reports was not paid by the author to publish or syndicate this article.
2) This article does not constitute investment advice. Each reader is encouraged to consult with his or her individual financial professional and any action a reader takes as a result of information presented here is his or her own responsibility. By opening this page, each reader accepts and agrees to Streetwise Reports’ terms of use and full legal disclaimer. This article is not a solicitation for investment. Streetwise Reports does not render general or specific investment advice and the information on Streetwise Reports should not be considered a recommendation to buy or sell any security. Streetwise Reports does not endorse or recommend the business, products, services or securities of any company mentioned on Streetwise Reports.
3) From time to time, Streetwise Reports LLC and its directors, officers, employees or members of their families, as well as persons interviewed for articles and interviews on the site, may have a long or short position in securities mentioned. Directors, officers, employees or members of their immediate families are prohibited from making purchases and/or sales of those securities in the open market or otherwise from the time of the interview or the decision to write an article until three business days after the publication of the interview or article. The foregoing prohibition does not apply to articles that in substance only restate previously published company releases.

Charts provided by the author.

CliveMaund.com Disclosure:
The above represents the opinion and analysis of Mr Maund, based on data available to him, at the time of writing. Mr. Maund’s opinions are his own, and are not a recommendation or an offer to buy or sell securities. Mr. Maund is an independent analyst who receives no compensation of any kind from any groups, individuals or corporations mentioned in his reports. As trading and investing in any financial markets may involve serious risk of loss, Mr. Maund recommends that you consult with a qualified investment advisor, one licensed by appropriate regulatory agencies in your legal jurisdiction and do your own due diligence and research when making any kind of a transaction with financial ramifications. Although a qualified and experienced stock market analyst, Clive Maund is not a Registered Securities Advisor. Therefore Mr. Maund’s opinions on the market and stocks can only be construed as a solicitation to buy and sell securities when they are subject to the prior approval and endorsement of a Registered Securities Advisor operating in accordance with the appropriate regulations in your area of jurisdiction.

Euro catches breath as Pound takes all the heat

By Lukman Otunuga, Research Analyst, ForexTime

The Euro enjoyed some stability today as investors directed most of their attention towards the battered Pound.

With the Euro appreciating against every single G10 currency excluding the Japanese Yen, bulls are certainly in the drivers sear today. While the Euro has scope to extend gains in the week ahead, the upside will be capped by Europe’s fundamentals and speculation over the European Central Bank cutting interest rates in September.

Where the Euro concludes the trading week will be influenced by the Eurozone Q2 GDP report scheduled for release on Wednesday. A positive print above the 1% estimate will most likely support the Euro against the Dollar and other major currencies.

In regards to the technical picture, the EURUSD remains under pressure on the weekly charts as there have been consistently lower lows and lower highs. A technical rebound could be in the cards if 1.1100 proves to be a reliable support. The Euro is seen retesting 1.2200 in the event of a breakout above 1.1150.

EURGBP blasts above 0.9180 as momentum builds

The last time the EURGBP traded above 0.9180 was in September 2017.

The currency pair is incredibly bullish on the daily charts with all signs pointing to further upside. A solid weekly close above 0.9200 will most likely open the doors towards 0.9270 in the short to medium term.

Disclaimer: The content in this article comprises personal opinions and should not be construed as containing personal and/or other investment advice and/or an offer of and/or solicitation for any transactions in financial instruments and/or a guarantee and/or prediction of future performance. ForexTime (FXTM), its affiliates, agents, directors, officers or employees do not guarantee the accuracy, validity, timeliness or completeness, of any information or data made available and assume no liability as to any loss arising from any investment based on the same.


Forex-Time-LogoArticle by ForexTime

ForexTime Ltd (FXTM) is an award winning international online forex broker regulated by CySEC 185/12 www.forextime.com

WHEAT/RUBLE Analysis: The expected decline in world exports and wheat harvest

By IFCMarkets

The expected decline in world exports and wheat harvest

In this review, we suggest to consider the WHEAT / RUB Personal Composite Instrument (PCI). It reflects the price dynamics of wheat versus Russian ruble. Is the WHEAT/RUB quotation growth possible?

It rises with the rise in price of wheat on the world market and the weakening of the Russian currency against the US dollar. The Russian agency SovEcon lowered the forecast for wheat exports from Russia in the agricultural season 2019/20 by 6.2 million tons to 31.4 million tons. Note that, according to the European Commission, the export of soft wheat from the EU countries for the first 4 weeks of the 2019/20 season, which began on July 1, was 22% less than last year’s level for the same period and amounted to 762 thousand tons. An additional factor in the growth of wheat prices may be drought and hot weather in the Midwest, which can damage crops. In addition, the heat is observed in Australia and individual EU countries. Against this background, the International Grains Council (IGC) lowered its forecast for world wheat production in the current season by 6 million tons to 763 million tons. The wheat harvest forecast in Russia was reduced to 75.7 million tons from 79.5 million tons. The weakening of the Russian ruble is possible due to the policy of the Central Bank of the Russian Federation aimed at further reducing the rate. In 2019, it was already reduced twice by 0.25% from 7.75% to 7.25%. This is a minimum since March 2014, when Western sanctions were not yet imposed on Russia. The Central Bank of the Russian Federation intends to further reduce the rate and bring it closer to inflation, which in Russia now stands at 4.7% in annual terms.

WHEAT/RUB

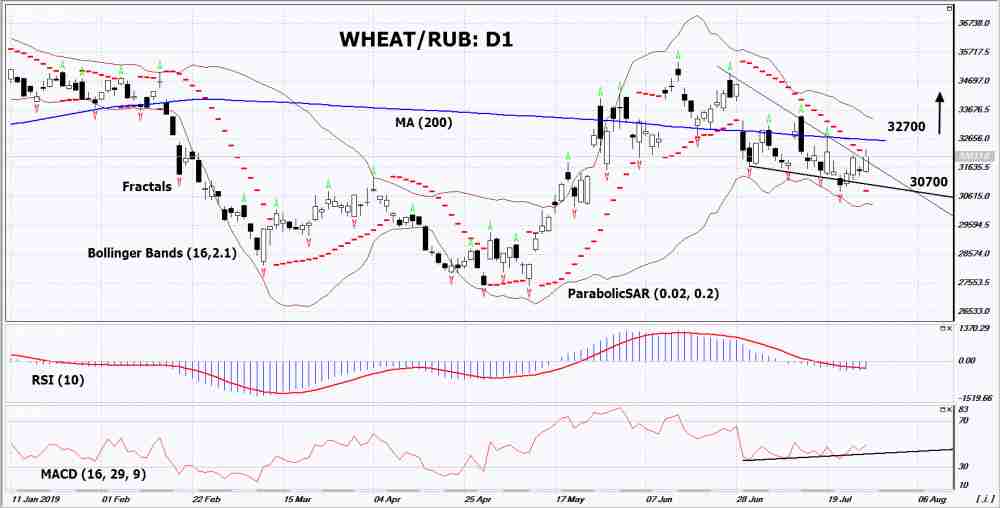
On the daily timeframe WHEAT/RUB: D1 exceeded the resistance line of the downward trend. Various technical analysis indicators have generated uptrend signals. Further growth of quotations is possible in case of an increase in demand and a reduction in world yield.

  • The Parabolic indicator shows a signal to increase.
  • The Bolinger bands widened, indicating high volatility. The bottom line of Bollinger has a slope up.
  • The RSI indicator is below 50. It formed a weak divergence to the increase.
  • The MACD indicator gives a bullish signal.

The bullish momentum may develop if WHEAT/RUB exceeds the last upper fractal and the 200-day moving average line: 32700. This level can be used as an entry point. The initial stop lose may be placed lower than the last lower fractal and the Parabolic signal: 30700. After opening the pending order stop shall be moved following the signals of Bollinger and Parabolic to the next fractal minimum. Thus, we are changing the potential profit/loss to the breakeven point. More risk-averse traders may switch to the 4-hour chart after the trade and place a stop loss moving it in the direction of the trade. If the price meets the stop level (30700) without reaching the order (32700), we recommend to cancel the order: the market sustains internal changes that were not taken into account.

Technical Analysis Summary

PositionBuy
Buy stopAbove 32700
Stop lossBelow 30700

Market Analysis provided by IFCMarkets