By IFCMarkets
Getting ready for significant data and events
US Fed and Bank of Mexico are going to cut rates. Will the EURMXN quotations grow?
This movement occurs with the strengthening of the euro and the weakening of the Mexican peso. On July 31, 2019, the Fed meeting will take place, at which the rate is expected to decrease by 0.25% to 2.25%. Market participants believe that the US regulator will not stop at this and will continue easing monetary policy. The last time the Fed lowered the rate in November 2008, at the height of the global economic crisis. Recall that the current level of the American rate is 2.5% with an annual inflation of 2.1%. Its decline can weaken the dollar and strengthen the euro. The next meeting of the ECB will be held only on September 12, 2019. Eurozone GDP data for the 2nd quarter and preliminary inflation for July may affect the dynamics of the euro. They will be released July 31, 2019. On the same day, Mexico’s GDP for the 2nd quarter will be published. The next meeting of the Bank of Mexico will be held on August 15. Theoretically, it can reduce the rate, which is 8.25% with inflation of only 3.95% in annual terms. Mexican President Andres Manuel Lopez Obrador said that the Bank of Mexico needs not only to control inflation, but also to accelerate GDP growth. In his opinion, low lending rates could support this process.
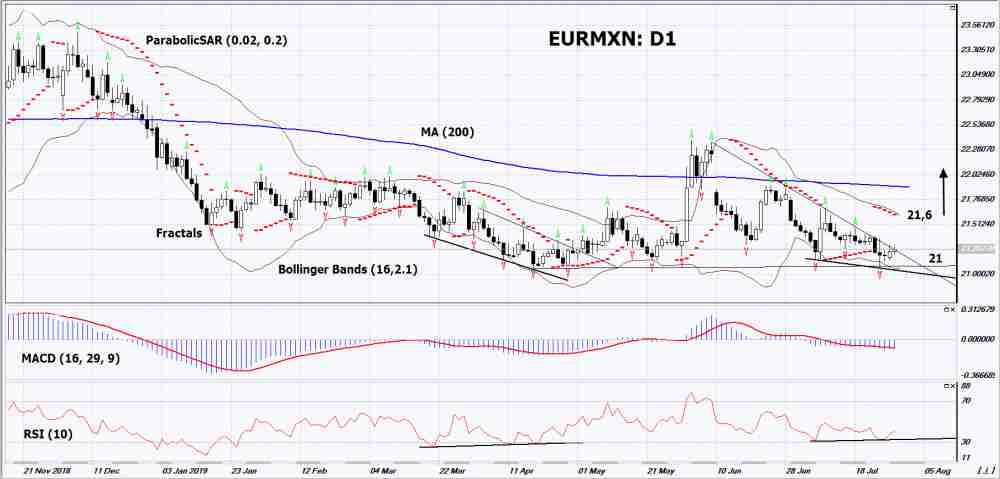
On the daily timeframe EURMXN: D1 rose to the resistance line of the downward trend. Various technical analysis indicators formed signals for improvement. Further growth of quotations is possible in case of positive macroeconomic news in the EU and negative – in Mexico.
- The Parabolic indicator shows a lower signal. It can be used as an additional resistance level that must be overcome before opening a buy position.
- The Bolinger bands narrowed, indicating low volatility. The bottom line of Bollinger has a slope up.
- The RSI indicator is below 50. It has formed a divergence to the increase.
- The MACD indicator gives a bullish signal.
The bullish momentum may develop if EURMXN will exceed the upper Bollinger line, the Parabolic signal and its last upper fractal: 21.6. This level can be used as an entry point. The initial stop lose may be placed below the last lower fractal and the lower Bollinger line: 21. After opening the pending order, stop shall be moved following the signals from the Bollinger and Parabolic to the next fractal minimum. Thus, we are changing the potential profit/loss to the breakeven point. More risk-averse traders may switch to the 4-hour chart after the trade and place a stop loss moving it in the direction of the trade. If the price meets the stop level (21) without reaching the order (21,6), we recommend to cancel the order: the market sustains internal changes that were not taken into account.
Technical Analysis Summary
| Position | Buy |
| Buy stop | Above 21,6 |
| Stop loss | Below 21 |
Market Analysis provided by IFCMarkets
Free Reports:
 Get Our Free Metatrader 4 Indicators - Put Our Free MetaTrader 4 Custom Indicators on your charts when you join our Weekly Newsletter
 Get our Weekly Commitment of Traders Reports - See where the biggest traders (Hedge Funds and Commercial Hedgers) are positioned in the futures markets on a weekly basis.