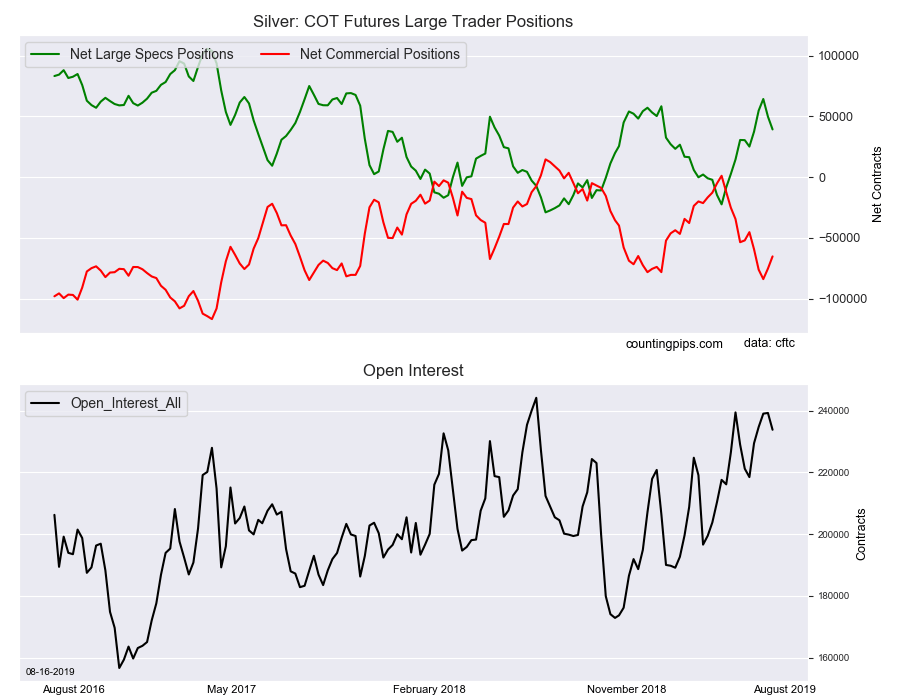
Large precious metals speculators cut back on their bullish net positions in the Silver futures markets again this week, according to the latest Commitment of Traders (COT) data released by the Commodity Futures Trading Commission (CFTC) on Friday.
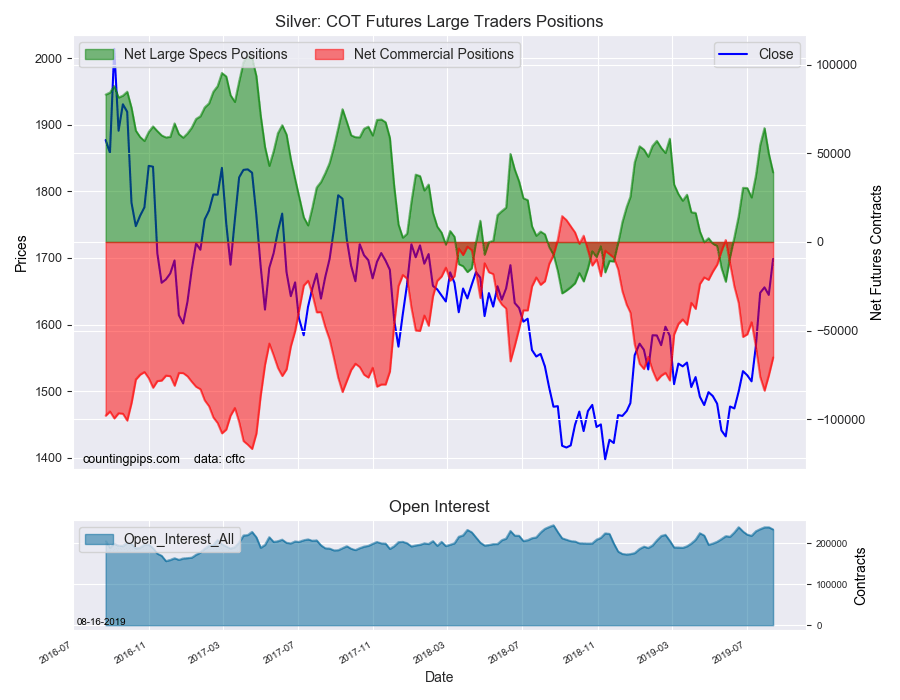
The non-commercial futures contracts of Silver futures, traded by large speculators and hedge funds, totaled a net position of 39,269 contracts in the data reported through Tuesday August 13th. This was a weekly lowering of -10,563 net contracts from the previous week which had a total of 49,832 net contracts.
The week’s net position was the result of the gross bullish position (longs) declining by -8,514 contracts (to a weekly total of 97,520 contracts) while the gross bearish position (shorts) increased by 2,049 contracts for the week (to a total of 58,251 contracts).
Large speculator positions declined for a second straight week by over -10,000 net contracts. Silver bets had been on a strong run-up in the previous months as positions had risen for seven out of the previous nine weeks (a total gain of +86,706 net contracts) before the recent slide. Silver positions continue to have strong bullish sentiment and have now been in bullish territory for ten straight weeks.
Silver Commercial Positions:
The commercial traders position, hedgers or traders engaged in buying and selling for business purposes, totaled a net position of -65,233 contracts on the week. This was a weekly uptick of 10,033 contracts from the total net of -75,266 contracts reported the previous week.
Silver Futures:
Over the same weekly reporting time-frame, from Tuesday to Tuesday, the Silver Futures (Front Month) closed at approximately $1698.50 which was a gain of $54.0 from the previous close of $1644.50, according to unofficial market data.
*COT Report: The COT data, released weekly to the public each Friday, is updated through the most recent Tuesday (data is 3 days old) and shows a quick view of how large speculators or non-commercials (for-profit traders) as well as the commercial traders (hedgers & traders for business purposes) were positioned in the futures markets.
The CFTC categorizes trader positions according to commercial hedgers (traders who use futures contracts for hedging as part of the business), non-commercials (large traders who speculate to realize trading profits) and nonreportable traders (usually small traders/speculators).
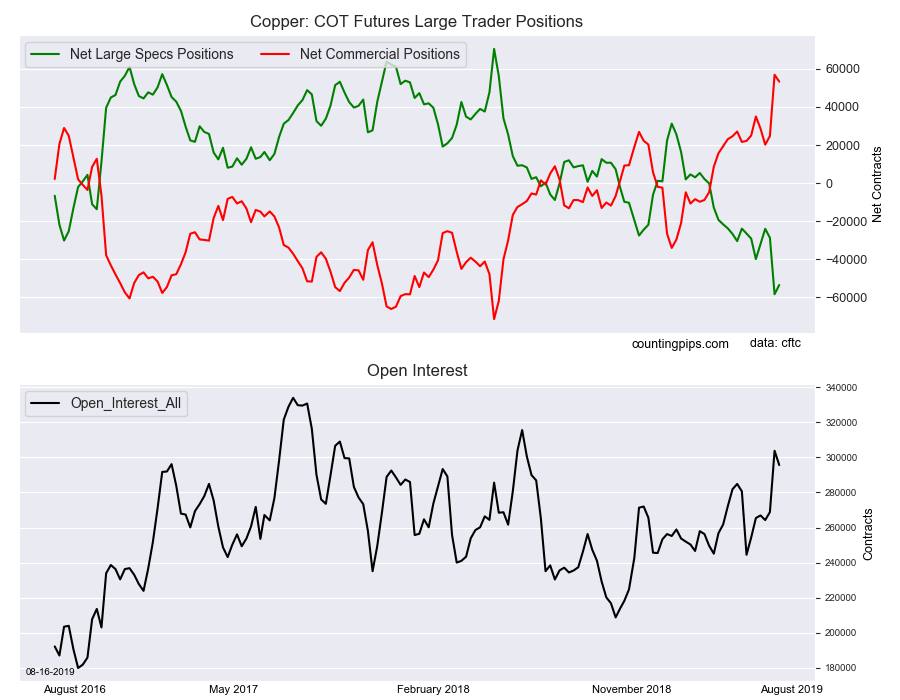
Large precious metals speculators cut back on their bearish net positions in the Copper futures markets this week following a large gain in bearish positions last week, according to the latest Commitment of Traders (COT) data released by the Commodity Futures Trading Commission (CFTC) on Friday.
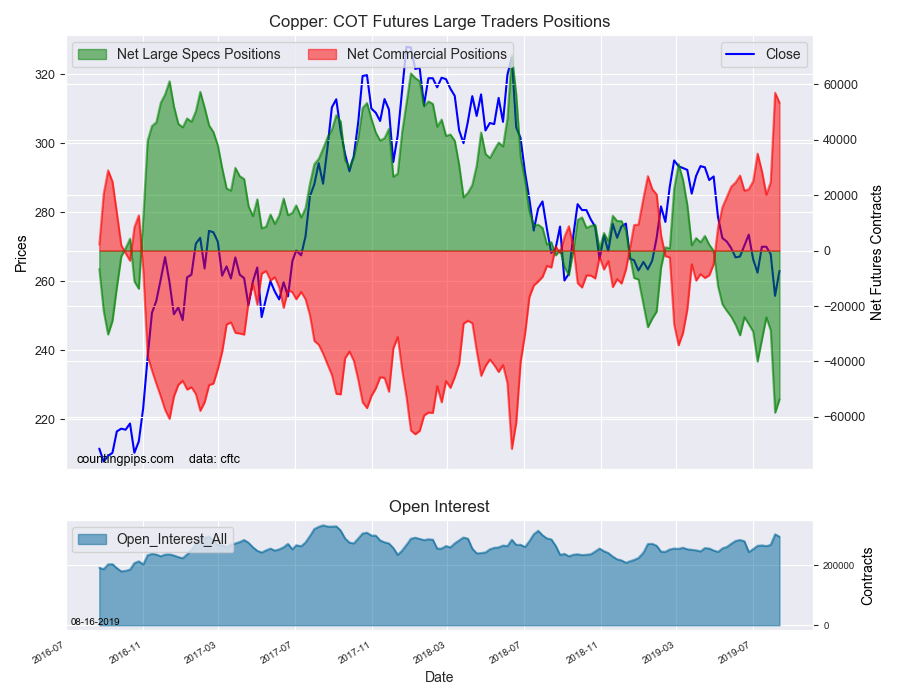
The non-commercial futures contracts of Copper futures, traded by large speculators and hedge funds, totaled a net position of -53,600 contracts in the data reported through Tuesday August 13th. This was a weekly change of 4,849 net contracts from the previous week which had a total of -58,449 net contracts.
The week’s net position was the result of the gross bullish position (longs) lowering by -2,926 contracts (to a weekly total of 76,207 contracts) while the gross bearish position (shorts) dropped by a greater amount of -7,775 contracts for the week (to a total of 129,807 contracts).
The decline in bearish bets this week comes after a sharp rise to a new record high bearish position last week at a total of -58,449 net contracts. The previous bearish record had been a total of -44,811 contracts on June 14th of 2016.
The current standing remains highly bearish above the -50,000 contract level for a second straight week. Copper has now been in a bearish overall level for sixteen straight weeks.
Copper Commercial Positions:
The commercial traders position, hedgers or traders engaged in buying and selling for business purposes, totaled a net position of 53,324 contracts on the week. This was a weekly decrease of -3,643 contracts from the total net of 56,967 contracts reported the previous week.
Copper Futures:
Over the same weekly reporting time-frame, from Tuesday to Tuesday, the Copper Futures (Front Month) closed at approximately $263.00 which was a boost of $7.25 from the previous close of $255.75, according to unofficial market data.
*COT Report: The COT data, released weekly to the public each Friday, is updated through the most recent Tuesday (data is 3 days old) and shows a quick view of how large speculators or non-commercials (for-profit traders) as well as the commercial traders (hedgers & traders for business purposes) were positioned in the futures markets.
The CFTC categorizes trader positions according to commercial hedgers (traders who use futures contracts for hedging as part of the business), non-commercials (large traders who speculate to realize trading profits) and nonreportable traders (usually small traders/speculators).
Welcome to this week’s Market Wrap Podcast, I’m Mike Gleason.
Coming up we dive into China with one of the foremost experts on the subject Gordon Chang. Gordon shares his thoughts on the U.S.-China trade war and why he believes it’s not likely to end anytime soon, talks about the pending economic catastrophe he sees in China and the effects it’s going to have on the global economy and, more importantly, for metals investors. You will not want to miss this incredibly in depth and fascinating conversation with the man nearly everyone goes to these days for an explanation of what’s really happening in China, Gordon Chang, coming up after this week’s market update.
Gold and silver prices have been on the move again this week. The metals continue to serve as a safe haven from trade wars, currency wars, plunging bond yields, and stock market volatility.
For the week, gold prices are up another 0.7% to bring spot prices to $1,509 per ounce. It’s down a bit today and is looking to hang on for a weekly close above the technically important $1,500 level. With a few hours here left in the trading week we’ll see if it can do that. Silver is higher by 0.6% since last Friday’s close to trade at $17.15. Platinum isn’t faring too well, down $20 or 2.3% to come in at $845. But its sister metal palladium shows a weekly gain of 1.5% and currently trades at $1,450 an ounce.
The Dow Jones Industrials, meanwhile, fell to a two-month low. When measured in terms of hard money – gold – the Dow actually fell to a two-year low. That puts it in bear market territory.
Although they are up here today, stocks did get clobbered mid-week on recession fears and interest rate abnormalities. On Wednesday, a critical part of the yield curve inverted for the first time since 2007.
The yield on the benchmark 10-year U.S. Treasury fell below the yield on the 2-year note. When this particular inversion has occurred in the past, it has reliably been followed by a recession. In fact, a yield curve inversion has preceded each of the last seven recessions.
The yield on the 30-year Treasury also inverted, in a sense, versus the Federal Reserve’s 2% inflation target. For the first time ever, 30-year government bonds were sold this week with yields below 2%.
In real terms, the entire yield curve may now be in negative territory. This week’s Consumer Price Index Report shows the core inflation rate rising at a 2.2% annualized basis.
However, another inflation gauge the Fed relies upon – core Personal Consumption Expenditures – has been running below 2%. That should give policymakers cover to pursue more aggressive stimulus measures in the months ahead.
Pressure is now building on the central bank to get short-term rates down, and get them down fast. Another quarter point cut may be viewed as inadequate by jittery investors and a frustrated President of the United States, who continues to bash Fed chairman Jerome Powell on a daily basis.
Even though Congress is on its summer recess, political risks are weighing heavily on markets. If it’s not President Donald Trump’s Fed tirades and trade wars, it’s the radical socialistic proposals from 2020 Democrat candidates and the bipartisan deficit spending splurge on Capitol Hill that has investors concerned.
Senator Rand Paul has warned of a coming “day of reckoning”:
Sen. Rand Paul: They are fiscally irresponsible. Who are they? Republicans. Who are they? Democrats. Who are they? Virtually the whole body is careless and reckless with your money, so the money will not be offset by cuts anywhere. The money will be added to the debt and there will be a day of reckoning. What’s the day of reckoning? The day of reckoning may well be the collapse of the stock market. The day of reckoning may be the collapse of the dollar. When it comes, I can’t tell you exactly, but I can tell you it has happened repeatedly in history when countries ruin their currency.
Senator Paul recently underwent surgery to have part of his lung removed. It had been damaged as a result of a 2017 attack by a deranged neighbor that left him with six broken ribs. The injuries could have been fatal.
Yet the attacker, who had left a trail of social media postings calling for political violence, barely even got a slap on the wrist. A federal court sentenced him to a prison term of only 30 days.
Even as our criminal justice system often lets violent criminals get off easy, many politicians want to preemptively punish Americans who exercise their Second Amendment rights. Lawmakers are currently devising new gun control measures to be put up for a vote after they return to Washington in September.
Yes, the same Congress that can’t control its spending may soon move to control and restrict your access to firearms.
In theory, it would make all the sense in the world to disarm bad guys before they can carry out shooting rampages. In practice, heinous acts such as these are difficult to predict or prevent. Lone wolf perpetrators with no prior criminal histories can often pass background checks. And career criminals will always find ways to obtain guns illegally.
It’s predominantly the good guys, the law-abiding gun owners, who would get disarmed by new gun control laws.
Gun rights advocates are concerned that the political tide may be turning against them. The National Rifle Association is in disarray and no longer wields the influence on Capitol Hill that it once did.
If you’re a proud gun owner or Second Amendment advocate, you may be interested in adding some silver bullets to your investment portfolio. Yes, you can own silver bullion in the form of replica bullets and shells. They won’t actually fire, but they could become hot commodities as silver prices rise.
Money Metals Exchange now offers replica bullets, made of solid .999 pure silver in a variety of sizes, commemorating the Right to Keep and Bear Arms. The bullets also honor the timeless value of precious metals as real money. You can join both foundational values together by adding your choice of our beautiful “silver bullets” to your metals stash.
Our .999 fine silver bullets come in five popular sizes from one ounce up to 25 ounces each. Our 1-oz silver bullet is modeled after a .45 caliber round of the famed Colt 45. The 2-oz after a .308 rifle round. The 5-oz after a 12-gauge shotgun shell, while the 10-oz is modeled after a .50 caliber Browning Machine Gun. And the impressive 25-oz bullet is a replica of a 20mm cannon round.
A bullet represents the power to uphold justice, stop a threat, and protect your life and property. Owning silver can help you fight the injustice of the Federal Reserve System, mitigate the threat of inflation, and protect your personal wealth.
Collect them, display them, or use them to start a conversation about two vital American traditions – the right to keep and bear arms and honest money. Choose your favorite – or grab a few of each to add to your personal arsenal of precious metals.
Well now, without further delay, let’s get right to this week’s exclusive interview on the hot news topic of the moment, that being China, with a man who is as knowledgeable as anyone on the subject.
Mike Gleason: It is my privilege now to welcome back Gordon Chang, author, television pundit and columnist. Gordon is a frequent guest on Fox News, CNBC and CNN among others, and is one of the foremost experts on Asian economics and geopolitics, having written books on the subject, and it’s great to have them back on with us.
Gordon, it’s a real honor to have you on again and thanks so much for the time today. I know you’re a man in high demand these days given your expertise on Asia and China in particular and I really appreciate you coming on to talk to us. How are you?
Gordon Chang: I’m fine, and it’s a real honor for me to be on your podcast, so thank you very much, Mike.
Mike Gleason: Well, trade tensions with China have been one of the big stories in the financial press for the past year and a half. We’ve seen U.S. equity markets gyrate up and down. One day traders are euphoric on rumors that a deal with China will soon be reached. The next day, they’re depressed over news of escalating tariffs and some other negative developments. Most recently, we saw a big rally in the stock market on the announcement that some tariffs will be delayed by a few months, although with the further inversion of the yield curve here today, the day we’re talking, Wednesday, the stock market is giving pretty much all of that back. But that aside, I’d like to start by getting your assessment of the prospects for a trade deal here, Gordon. Do you think we’re going to see these tensions resolved in the next few months?
Gordon Chang: Certainly not. I don’t see a comprehensive trade deal until 2020, maybe 2021, maybe never. Problem is Xi Jinping, the Chinese ruler, doesn’t necessarily want a deal. He owns this trade war, quote-unquote, and if he makes significant compromises, he’s going to accept the political responsibility for that. You’ve got to remember that accumulating great power is of course an advantage, but it means he also accumulated great accountability. He can’t blame other people. So I think that the Chinese political system right now is pretty much frozen, and that means we’re not going to see a comprehensive deal. We’re probably not even going to see an interim arrangement, either.
Mike Gleason: President Trump has been confident that the U.S. has the upper hand in trade negotiations. He believes China needs the U.S. more than we need them. Frankly, we don’t know if the president’s assessment factors in America’s largest export to China, that being U.S. dollars. We export an awful lot of inflation to China and might be ignoring the vast quantities of U.S. treasury debt they hold. So, it appears as though China does have some leverage here. There is also some political leverage. They certainly know how eager the president is to avoid a recession between now and the 2020 election. On the other hand, it would be hard to overestimate how important exports to the U.S. are to the Chinese economy. What are your thoughts about who is holding the stronger hand here? All right, so who has the upper hand?
Gordon Chang: The United States has the upper hand. You look at all the metrics, and they point in our direction. So first of all, we’ve got the larger economy. Last year, we produced $20.5 trillion of gross domestic product. China claimed $13.82 trillion, but that number is probably exaggerated. Also, we don’t have a trade dependent economy. Everyone wants the U.S. market, and indeed, China is dependent on us. They’re the trade surplus country. And we know from history that it’s the trade surplus countries that get hurt in trade wars, and China is extraordinarily dependent on us.
Last year, China’s merchandise trade surplus with the U.S. accounted for 119.3% of their overall merchandise surplus. That gives us enormous leverage over Beijing. And by the way, Mike, we’ve got a robust economy. We grew 2.1% in the last quarter. China, who knows what they grew, but probably half of what we did at best. And they could have even been contracting the numbers from China, especially the last couple months. The underlying indicators look particularly gruesome. So overall metrics, we’ve got them.
The only issue is political will, and people think that Xi Jinping, the Chinese ruler, has got more of it than we do. President Trump is doing a pretty good imitation of someone who thinks he’s got political will. So, I think for the moment, we can say that the U.S. is going to be safe. There’s going to be a lot of squawking, but Trump doesn’t seem to care too much, and long term, we’re just in the position where we can push the Chinese around. All we have to do is realize that we can do it.
Mike Gleason: Certainly Trump has built up a lot of his credentials as a successful businessman, as a good negotiator, so obviously we do have to keep that in mind. Do you envision China continuing to devalue their currency or are starting to dump dollars to hurt the U.S. bond market? Do you see them pulling something like that or will they just talk about that and use that as a threat, as a negotiation tactic, but won’t actually follow through… what are your thoughts there?
Gordon Chang: I’m not particularly worried about China dumping U.S. treasury obligations to hurt us because we got to, first of all, remember they’ve only got, what, $2 trillion at most in a very big and liquid market, but also, just think about the way the dynamics of the markets work. 100% of our obligations are denominated in dollars. So, the Chinese are going to get dollars and then they’ve got to put them into other currencies in order to hurt us, euros, pounds, yen, whatever, which means that Brussels, London, and Tokyo have got to go out in the global markets to bring their currencies back down in value because they’re going to soar when the Chinese buy them. So, these central banks have got to rebalance their currencies and the only way they can do that is to buy dollars. The Chinese have been talking about the nuclear options since the middle of 2008 but they never do it. And the reason they never do it is because they know it won’t work.
Mike Gleason: Getting back to the Chinese economy, over the years, it has been really hard for U.S. investors to get an accurate picture of what is really happening. We’ve all heard about the massive economic growth there, but then there are conflicting stories. We hear that growth is artificial. Many ghost cities have been built, and China’s economy is a massive bubble which could pop any time. You’ve been one of the strongest voices warning of troubles ahead over there. Recently, you appeared on Fox News and noted the Chinese are doing, “Some things which smell desperate.” Can you share with our listeners what you’re seeing there?
Gordon Chang: Yeah, if you look at, for instance, the numbers from June and July, they show imports are consistently down month after month and that shows weak demand. Car sales, which are bellwether, they were off for 13 straight months in July. You’re starting to see, for instance, urban unemployment increase, and some of these numbers which are supposed to be strong aren’t.
So, for instance, the purchasing managers indices for the manufacturing sector had been flashing negative, both the official one and the unofficial one. Industrial output in July was very low, the lowest in about 17 years or so, something like that. So, we’re seeing an economy right now that is in trouble. You go back, for instance, to December of last year, you had a professor at Brandman University in Beijing. He created a sensation across China when he said, “Look, the economy in 2018 is going to grow no more than 1.67%. It may even contract.”
Now, Beijing reported 6.6% for the year, but they’re not acting as if they’ve got an economy growing that fast. And by the way, even if they were growing at 6.6%, they’re creating an amount of debt which is about five and a half times more than they’re producing nominal GDP. They can do that for a little while because they control borrowers, lenders, courts, everything. But they can’t do that for very much longer. So, I think that they realize they’re in trouble right now and they just don’t know how to get out of it. When their default position is to just sort of spend more government money, but with the debt accumulating the way it is, I don’t think that they can do that for too much longer.
Mike Gleason: We’ve recently seen demand rising for gold and silver, including physical bullion. There are a number of reasons, some good price performances helping, but some of the demand is coming from investors who are increasingly skeptical about the U.S. equity markets, the dollar and even bond prices. As we’ve discussed, the trade dispute with China is one of the wildcards. Another is the risk that the Chinese economy will falter. Back in the summer of 2015 when the Chinese market was plummeting, it was a very rough time for stock markets all over the world. So, we have some recent history to go on there as to how important the Chinese economy can be to the rest of the globe. So, let’s about that one. What do you think it will mean for the U.S. if the bubble in China finally does pop, Gordon?
Gordon Chang: I think people are going to be taken by surprise. I don’t think they should, but they will be because markets do believe that China is growing somewhere close to the reported numbers. But we’re starting to see a rush to safe havens, and especially the 10-year Treasury. People want it, and that’s a real sign that there are problems in the global economy. And of course, China is going to exacerbate that. So, I think long-term, I would imagine that there’s going to be a flight to safe haven and when the Chinese economy does hit the wall, it’s going to be very good to be in 10-year Treasuries, in gold and other safe haven assets.
Mike Gleason: Well, as we begin to close here, Gordon, any final comments that you want to leave us with today? And I didn’t ask you much about North Korea, so maybe give us your thoughts on the developments there and other geopolitical theater that you’re going to be watching over in Asia in the coming weeks and months that investors might want to be thinking about and keeping an eye on.
Gordon Chang: I think the most important thing in terms of geopolitical developments in Asia to watch in terms of effect on financial markets is going to be the situation in Hong Kong. Hong Kong is irreplaceable as a city, but we’re seeing a hardening of attitudes on both sides. You’ve got not only the pro-democracy kids, but you’ve got a big portion of the Hong Kong population, at least two thirds, maybe three quarters, that are supporting the kids because they believe that this is the last stand for autonomy. And because of that hardening of attitudes, I think you’re going to see both sides take positions that probably are going to end up shaking not only the Hong Kong markets, but global markets as well. North Korea, at least for the moment, is a side show. Hong Kong is where we really need to look to get our clues to where things are going.
Mike Gleason: Obviously, a lot of us have seen what happened there this week just on our TV sets about the riots in Hong Kong. Just lastly, what’s your take on that and do you think we’re going to see more of that sort of thing as the unrest grows?
Gordon Chang: Normally, you would think that demonstrations would just sort of lose their vigor and they sort of melt away, which is what happened in 2014 with the occupy protests. But these protests have been actually going on since April. We’re now in our 11th straight week, and they show no sign of stopping. And it’s because I think people believe that this is the last stand. So, there’s going to be difficulties ahead. I don’t think that the Beijing is going to deploy the People’s Armed Police or the People’s Liberation Army into Hong Kong at least until after October 1st, which is the 70th anniversary of the founding of the People’s Republic, but sometime after that, I’d be very worried that China is going to do exactly that.
And by the way, Mike, we have had video evidence suggesting that mainland police officers or mainland army soldiers are actually on the Hong Kong streets right now dressed in Hong Kong police uniforms. So, for instance, from about a week ago, there’s this video of a Hong Kong riot policemen, who’s obviously from Hong Kong cause he’s speaking colloquial Cantonese, but then he turns to other riot policemen near him and starts speaking to them in Mandarin, which wouldn’t happen if those other guys were from Hong Kong, and indeed, he addresses them as comrade. So, there’s suggestion, which I think is pretty solid, that China’s already deployed. And so this is a situation which is going to get extremely emotional and it’s going to last a long time.
Mike Gleason: Very interesting development. Good catch there. That’s going to be something to keep an eye on, and yeah, maybe we’re witnessing the last stand there. As you mentioned, this could be quite interesting.
Well, Gordon, it’s been another fascinating conversation and we can’t thank you enough for sharing with us your incredibly studied view on the state of things in China and in Asia. We’re very fortunate to have you fill us in and give us your perspective given what’s going on of late and your incredible expertise in that area. And we hope to check back with you again in the future as we learn more about how this will play out and get your comments again. But in the meantime, take care and enjoy the rest of your summer. Thanks, Gordon.
Gordon Chang: Thank you very much, Mike.
Mike Gleason: Well, that will do it for this week. Thanks again to Gordon Chang. You can follow him on Twitter @GordonGChang or check out his book The Coming Collapse of China.
Mike Gleason: And check back next Friday for the next Weekly Market Wrap Podcast. Until then, this has been Mike Gleason with Money Metals Exchange, thanks for listening and have a great weekend, everybody.
The Money Metals News Service provides market news and crisp commentary for investors following the precious metals markets.
Revenge trading is quite possibly the most counter-intuitive, self-destructive behavioral pattern a Forex trader could ever slip into. And yet, so many investors can often find themselves shackled by this seemingly unstoppable compulsion to keep placing trades, even in the depths of a never-ending losing streak.
So what is it within us that just can’t seem to stop this vicious cycle? Are there warning signs to watch out for to catch it before it starts? And what can we do to get out of that harmful headspace once we’re in it?
Why We Do It
The answer is simple: it’s pride, mixed with a hefty helping of stress. No matter how analytical forex traders claim their minds to be, at the end of the day, we must remember that we are all human.
A passionate trader who has opened a position has invested more than just their money. They’ve invested their time, research, and faith, both in themselves and in the markets. So a loss can have a significant impact on us, both psychologically and yes, even physiologically!
What Our Body Goes Through
Cortisol is our body’s stress hormone. And losses, especially sequential ones, can significantly stimulate our cortisol production. This almost instantly compromises our ability to make logical decisions.
Cortisol fuels our anxiety, catapulting us into a state of panic and clouding our judgment. Our brain goes into “fight or flight” mode, and the immediate priority becomes to undo the damage and regain our losses.
This prompts us to place impulsive trades that we have neither thought through nor considered in our larger risk management plan.
How It Keeps Us In
This is where pride comes in.
We can all relate to feeling like we’re failures because we’re “losing” as investors. After all, our business is to invest successfully. So, if we’re technically “failing” at it, it can be difficult not to take personally.
But that type of negativity nurtured by high levels of stress can very quickly snowball out of control, hijacking our entire mental process.
So what ends up happening?
We drown ourselves in shame and anger, refusing to accept our losses
We focus on the amount lost, making it our life’s mission to return (or avenge!) what’s gone
We convince ourselves that it MUST turn around at some point
We continue to desperately place more poorly thought out trades
Suddenly, we’ve found ourselves deeply inside a vicious cycle of revenge trading and we just can’t seem to stop.
But fear not, traders! There is a way out before you considerably damage your equity!
How to Get Out Once You’re In
Themost important thing to do when you’re in a cycle of revenge trading is to recognize that it is happening!
If you’ve experienced one too many losses in the Forex market recently, stop and write down the thoughts running through your head and the emotions you are feeling.
Are you feeling stressed, anxious or angry?
Do you feel panicked and itching for a quick win?
Are you questioning your abilities as an investor or jumping from one opportunity to the next?
What was the real strategic reason behind the placing of your last trade?
If you answer yes to any of the questions above, or have no logical answer for the last one, then you MUST step away.
Find activities that will pull you away from the computer IMMEDIATELY and reset your brain. Some investors get some exercise or go for a meal, others meditate or go for a drive.
Once you’ve calmed yourself, it’s time to think of a game plan. You can do any and all of the following:
Halt all trades until you reassess your trading strategy! This means doing more research, tweaking the strategy accordingly and perhaps testing it out on an MT4 demo account before re-investing your money.
Employ the use of wealth managers who will manage your money until you’ve sufficiently worked on achieving a healthy trading psychology.
Peruse around for a trader you vibe with to copy on a social trading platform or seek a good trading signal provider.
Remember that having an emotional response is not wrong. We aren’t robots! Embrace it, familiarize yourself with it and most importantly, swiftly recognize when it becomes a destructive emotional habit and respond to it correctly.
It’s been another solid week for the precious metal. Gold has broken higher into levels not seen since early 2013. However, there has been some volatility.
Earlier in the week, prices crashed lower from testing the long term 1522.75 level. This came as the US Treasury Dept issued a statement highlighting that some of the goods due to be under new the new 10% tariffs from September 1st, would now be exempt until December 15th. The news caught the market off guard, causing a wave of relief across asset markets. It also sent equities surging higher and safe havens tumbling lower.
However, the optimism around the announcement was short-lived. Equities soon returned to trading to the downside as the market focus shifted towards growing fears of a global recession.
Earlier in the week, data out of the eurozone showed German GDP contracting in Q2. This put the second-largest economy in the eurozone on the brink of recession for the first time in a decade. This comes on the back of a raft of weak sentiment data out of Germany recently, with Ifo readings suggesting the economy is already in recession.
Later in the week, focus shifted to the US where movements in Treasury yields raised red flags. The yield on 2Y USTs moved above the yield on 10Y USTs for the first time since 2007. This move historically tends to precede a recession in the US.
Fears over the health of the global economy are being fuelled by the ongoing trade war between the US and China. And the uncertainty over the implications of a no-deal Brexit is definitely adding to this. In light of this, the outlook remains positive for gold, with both the Fed and the ECB expected to announce further easing in the coming months.
The rally in gold this week has seen price breaking above the 1522.75 level. This is a major long term level in gold. It’s been the lows in 2012 and mid-2011 and has not been retested since it broke in 2013. Despite some initial selling, price is now holding above the level putting focus on a test of the 1566.15 level next. If we reverse lower from here, bulls will be looking to use a retest of the 1433.58 level as support.
Silver
Silver prices have been equally buoyant. Prices tracked the moves in gold this week to break to their highest levels since early 2018. Indeed, they came just short of testing the 2018 highs.
Weakness in the USD, in light of growing Fed easing expectations, is also helping keep the metals underpinned. Furthermore, despite this week’s announcement, the trade relations between the US and China remain incredibly volatile. Expectations are low for a deal in the near future which again, should keep metals supported via safe-haven inflows.
Silver prices surged further higher this week with the market breaking briefly above the 17.3336 level. However, price has backed down somewhat since testing the level. While above the 16.5877 level, focus remains on further upside, with the 2018 highs of 17.6936 the next key level to watch.
Commodity currencies have been in for a bit of a roller coaster lately. And there are some signs in the economic data that show it’s likely to continue!
For the Aussie and it’s Kiwi counterpart, there are quite a few indicators pointing to further weakness in the coming months. The question is, though, whether their exchange counterparts will offset the trend.
One of the more recent events that have put a damper on interest in commodity currencies was the official inversion of the bond yield curve on Wednesday.
We previously discussed what this means in terms of a recession, but how does that affect other currencies? For that, we have to analyze the influence of the trade war, and the recent dip in the Chinese currency.
The Trade War is Still On
A few days ago the Trump administration disclosed that planned tariffs on Chinese goods would be delayed, which the market interpreted as a cooling of the trade war. This came just a couple of days after the yuan fell below the psychologically important 7.00 level.
The White House interpreted this as a deliberate move by Chinese authorities to avoid the impact of the tariffs. China was put back on the currency manipulation list in response.
The thing is, the point of tariffs is to increase the cost of Chinese goods being sold in the US. This would put pressure on China to offer concessions to the US, primarily to change laws regarding intellectual property.
By weakening the currency, China could reduce some of the effects of the tariffs by making its exports cheaper. In the context of a threat of 25% tariffs, Deutsche Bank calculated that China could offset the price increase if the USDCNY dropped to 7.40.
Deliberate or Not?
China argues that the weakness in the yuan is not artificial, and is a natural consequence of the trade war. If the US buys less Chinese products, the logical consequence is that demand for yuan to pay for it will go down. In fact, as we pointed out a few months ago, the Chinese currency did fall with the imposition of tariffs and has been trending lower ever since.
While the US and China can argue over whether the weakness in the yuan is deliberate or not, from an analytical point of view, the effects on other currencies and markets are practically the same. This is what impacts the Australian dollar.
The Wider-Ranging Effects
A weaker yuan makes it more expensive for Chinese firms to buy raw materials to manufacture goods. One of the major imports is iron ore from Australia.
Iron ore has been climbing in price since the beginning of the year. This is due to supply issues after the collapse of the Vale Dam, one of the largest ore producers in Brazil. During that period, the price appreciated over 30%. On top of that, the yuan lost around 10% of value. That is a major increase in the cost of raw materials for Chinese firms, which were also struggling to sell their products in the context of the trade war.
At the end of July, Vale finally started to ramp up production of ore in Brazil (currently at 45% of capacity, planning to add an additional 20% by the end of the year). At the same time, Chinese officials took issue with the price of iron ore. There were concerns about other commodities, but they singled out iron ore as becoming too expensive. In the two weeks following, the price of ore has dropped a little over 15%.
Australia and the Yield Curve
Ore exports have been a key component of Australia’s recent record trade surpluses. These help support the strength of the Aussie dollar (and, by arbitrage, the Kiwi counterpart). However, with the price dropping, it’s likely to have an impact on the currency.
And with fears of a recession brewing due to the trajectory of the yield curve, the thought among a lot of investors would likely be to hold off on capital expenditure in case of a stronger economic downturn. That means buying less steel.
On the other hand, with the yield curve inversion, chances of further cuts by the Fed have increased quite a bit. The ECB also is likely to become more accommodative. But Australia has extra risk factors which just might put it ahead of the pack in the race to the bottom.
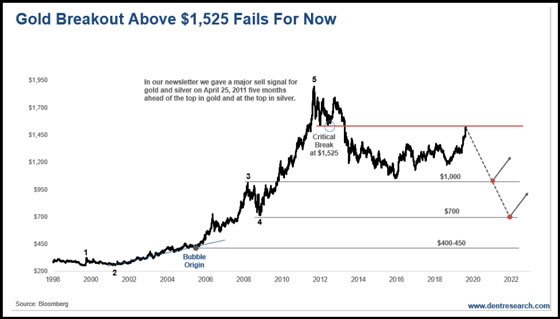
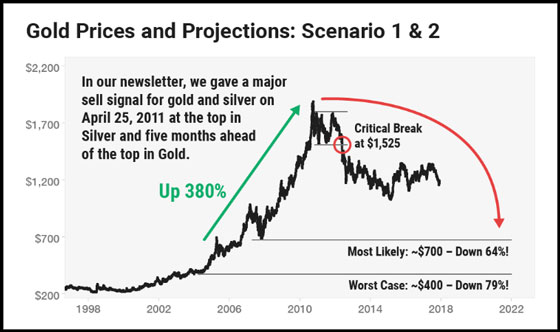
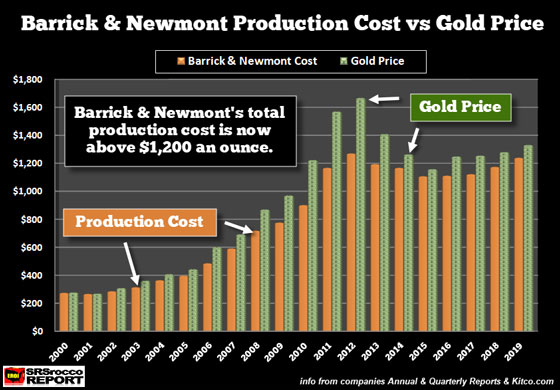
Harry Dent says gold is in a bubble, and according to his analysis, warns that it could go back down to $700. If the gold price were to crash lower to $700, as Dent forecasts, then 50+% of the gold mining industry would have to shut down. Why? Because the top gold miners total cost of production is now above $1,200 an ounce.
Of course, Harry Dent doesn’t take into consideration what it cost to produce gold as he pays no attention to the impact of ENERGY on the market. He, like many analysts, must believe that gold comes from the Tooth Fairy. And, maybe we can’t blame them as the world has taken energy for granted. Unfortunately, the overwhelming majority of economists and financial analysts do not incorporate energy into their forecasts. Thus, most of the market analysis today is seriously flawed.
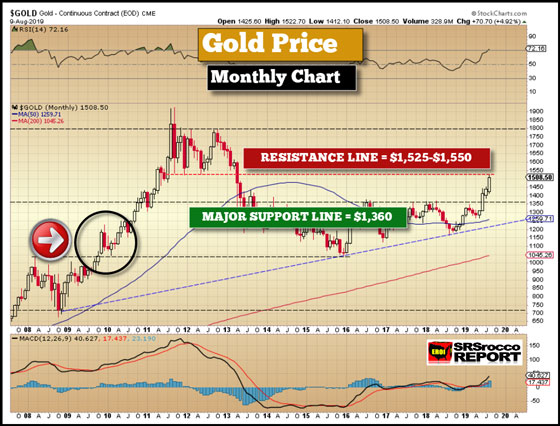
Peter Schiff – who is also living in Puerto Rico – emailed me recently and asked when I would turn more bullish on gold. My answer was $1,525. I have been eyeing that as the key resistance; if pierced, gold would have substantially higher targets –$1,600 to as high as $1,800.
But Tuesday’s news caused gold to fall sharply just as the futures markets showed gold breaking up to $1,540+… that would have been a clear breakout. Is this the end for gold for now, or is this news transitory? These two reversals in gold and stocks look convincing for now, and bullish for stocks.
Dent conveniently shows in his chart that gold hasn’t broken above the $1,525 level, but failed to acknowledge the huge $165 BREAKOUT above the key 5-year resistance level of $1,360:
While Dent criticizes gold for not breaking through the $1,525 level, nothing goes up in a straight line. The gold price shot above the 5-year $1,360 resistance level, which is now the new support level, by $165 in less than two months. This is an excellent sign. Of course, gold would hit some resistance at the next technical level of $1,525. Thus, the gold price may need to consolidate a bit before moving higher. Dent should know this, but he also seems to be conveniently overlooking the fact that stocks and commodities tend to correct lower after a large breakout.
Regardless, Dent has been playing the ANTI-GOLD CARD for as long as I remember. In his newest Gold E-Book, called The Great Gold Bust Ahead, Dent provides and an even lower worst-case level for gold of $400-450:
(chart from Dent’s The Great Gold Bust Ahead)
It seems that Dent is providing a “Worst Case” $400-$450 gold price because, that is where he suggests the “Gold Bubble” began. If we take a look at his most recent gold chart again, I would like to fill in some important MISSING KEY FACTORS that Dent is excluding from his analysis:
(chart from Dentresearch.com)
First, you will see in the chart at 2005; this is where Dent labels the gold “Bubble Origin.” And, if we just looked at paper charts for our analysis, then maybe Dent would be on to something. However, these charts represent what is taking place in the REAL WORLD. So, if we want to understand better what the charts are showing us, we have to look at the main factor that drives the gold price and market… and that is ENERGY.
Secondly, the gold production cost has been a reliable driver of the gold price. As we can see in my new updated chart below, including Barrick and Newmont’s total gold production cost for Q2 2019, there’s a good reason the gold price hasn’t fallen to $700:
The total cost of production for Barrick and Newmont has ranged between an average $1,100-$1,200 over the past six years. Furthermore, my analysis suggests that Barrick and Newmont’s total Adjusted Income Breakeven is now over $1,200 an ounce.
Okay, some skeptics who don’t believe that the gold production cost provides a floor in the gold price, let me present this chart:
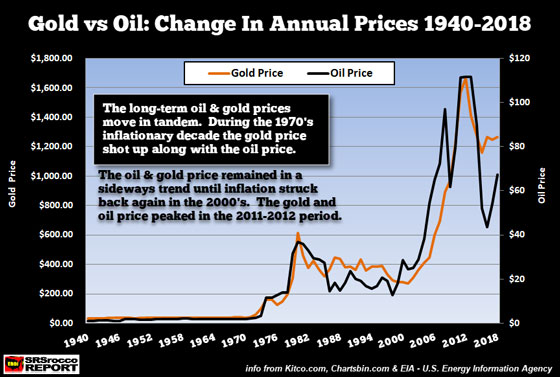
Some precious metals analysts suggest that “Supply & Demand” forces are the real drivers of the gold price. However, if we were to ignore all the supply and demand statistics, we can clearly see that the oil price has been the leading driver for the gold price since 1940, and beyond. Why? Because, the oil price dictates the cost it takes to produce an ounce of gold.
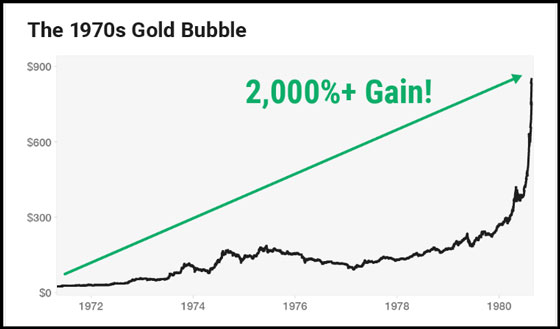
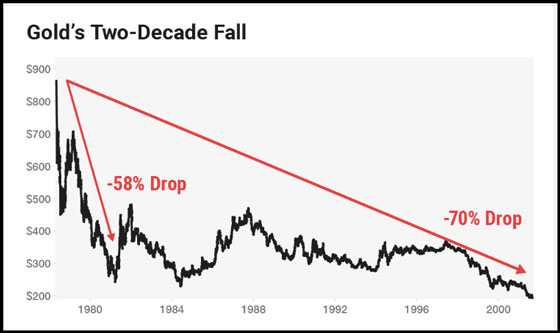
Sure, if there were no demand for gold on the entire planet, then, of course, the price would be zero, but that isn’t the argument here. Rather, Dent forecasts a lower gold price due to a coming recession, similar to what happened to the gold price during the 1980s. Dent also provides these two gold charts from his Gold E-Book promotional link:
(chart from Dent’s Gold E-Book Promo Link)
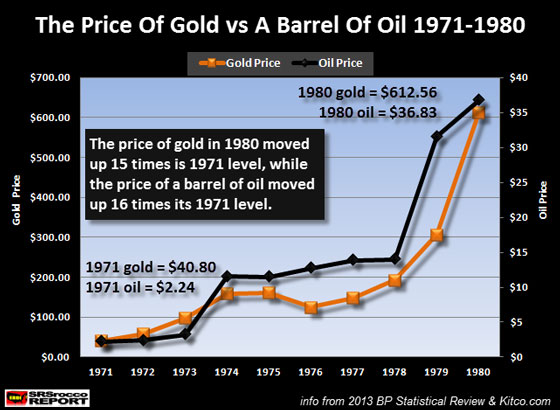
Harry shows the 1970’s big gold bubble where it gained 2,000%. However, Dent failed to show that the oil price, which is the foundation of the price of most goods and services in the market, went up more than 1,500% during the 1970s. Please look at the following Gold-Oil price chart:
The gold price wasn’t in a BUBBLE has Dent stated, rather it was doing exactly what it was supposed to, protect investors and the public from inflationary prices. If we go by an annual average gold and oil price, not the absolute Gold Peak that Dent used to get his 2,000% gain, we have the following:
Oil & Gold Annual Average Price Change 1970-1980
Oil Price = 1544% (15 times higher)
Gold Price = 1401% (14 times higher)
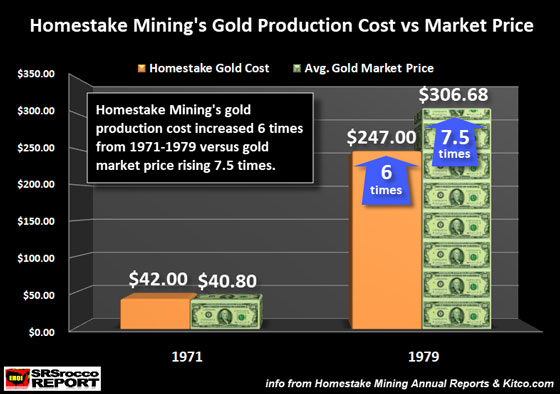
So, if investors wanted to buy gold, they were going to have to pay much more money for it in the late 1970s because its production cost had also skyrocketed. Here is my chart of Homestake Mining and its cost of production from 1971 to 1979 (sorry, I did not have Homestake’s Annual Report data for 1970 or 1980):
Homestake’s production cost increased six times by 1979 to $247 an ounce when the average annual market price for gold was $306. So, gold was clearly not in a bubble if we consider how the rising oil and energy prices impacted the production cost.
Now, it is true that gold fell from a peak annual price of $612 in 1980 to an average of $372 for the two decades 1981-2000, because the oil price had dropped to an average $21.77 for the same period. However, even though the gold price fell nearly 40% from its 1980 high to that $372 price level, it was still almost ten times higher than its price in 1970.
Harry Dent is making the same mistake with his analysis of gold today as he did for the 1970s. Gold fell to an average annual low of $1,160 in 2015, because the oil price had collapsed from over $100 down to $52. But, the reason gold continues to remain in the $1,200 range, even with lower oil prices, has to do with the fact that ore grades continue to decline in the industry and are now more than 20% less than they were in 2005. So, the gold mining industry has to extract and process 20+% more ore today to produce the same amount of gold. This takes a great deal more energy and money.
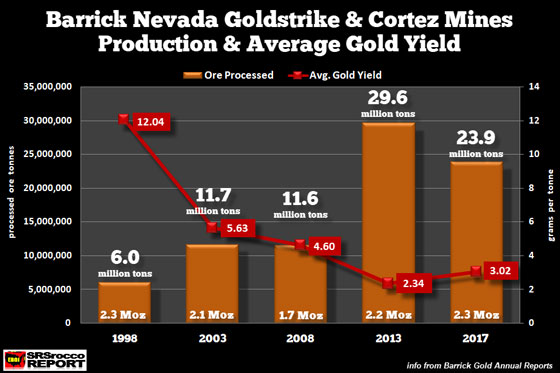
A perfect example of how falling ore grades impact the amount of ore extracted is Barrick’s largest gold mines in the United States. Barrick’s Goldstrike & Cortez Mines in Nevada have seen their average gold yield decline from 5.3 grams per ton (g/t) in 2003 to 3 g/t in 2017:
Barrick’s Goldstrike & Cortez Mines had to double their processed ore to nearly 24 million tons in 2017 to produce about the same amount of gold in 2003. Unfortunately, Dent and other analysts don’t pay attention to what is taking place in the gold mining industry.
Now, some mining analysts will disagree with the $1,200 total cost to produce gold. They will say that the ALL-IN-SUSTAINING-COST (AISC) is closer to $1,000 an ounce… according to data put out by MiningIntelligence.com. However, the AISC does not account for all costs and does not take into account the massive share dilution the mining companies have been forced to do to continue business as usual. The top five gold miners outstanding shares have increased from 1.3 billion shares in 2000 to 3.8 billion shares in 2018… nearly triple.
Yes, the gold mining industry could indeed continue to produce gold at $1,000, for a brief while. However, at $700 for an extended period, it would shut down 50+% of the industry.
While Harry Dent’s analysis on the changing U.S. and global demographics is quite interesting, he doesn’t consider the Energy or the Falling EROI – Energy Returned On Investment and how that will impact that value of most assets going forward. Harry seems to be guilty, as are many analysts, in believing in the ENERGY TOOTH FAIRY… abundant cheap energy forever.
The Money Metals News Service provides market news and crisp commentary for investors following the precious metals markets.
The monthly retail sales report from the United States showed another month of solid consumer spending at retail outlets. Official data showed that headline retail sales rose 0.2% on the month while core retail sales jumped 1.0%.
The data comes at a time when investors are concerned that the global economy, led by the US, could be slipping into a long due recession.
EUR Weakens as ECB Officials Hint Stimulus Measures
The euro posted strong declines on Thursday. This came as the key support level broke. The bearish momentum in the currency came on the back of ECB official comments regarding possible stimulus measures. Olli Rehn, a governing council member of the ECB, said that stimulus measures could overshoot market expectations. This sent the common currency plummeting on the day.
Will the Euro Weaken Further?
The breakdown in the currency pair after losing the support at 1.1140 could trigger further declines. However, the dynamic support off the lower trend line could come to the currency pair’s rescue. But it is unlikely that this support could hold much longer. A breakdown lower could see the euro testing the previous lows at 1.1030.
GBP Advances as Parties Move to Block No-Deal
The British pound posted gains on Thursday. This came on the back of news that cross-party government measures were being taken to avoid a no-deal Brexit. The sterling has been in a steady decline since PM Johnson took a hard stance on the Brexit. But, with the latest developments now looking to avoid a hard Brexit, the sterling managed to bounce on the news.
GBPUSD Has Likely Formed a Bottom
Price action in the currency pair has been relatively stable after trading near fresh historic lows. The GBPUSD broke out to the upside from the descending wedge pattern. However, the momentum remains rather weak. Further gains are required in order for the currency pair to maintain the momentum. There is also a risk that the GBPUSD could break the support area of 1.2082 – 1.2026 unless a higher low is formed.
Gold Posts Meager Gains as Momentum Eases
The precious metal traded close to the previous highs that were established earlier in the week. However, the momentum faded as investors digested the news of a possible slowdown in economic growth. With gold prices posting strong gains, it is likely that investors will be looking to book profits into the weekend.
XAUUSD to Consolidate Near Highs
The precious metal is consolidating near the highs. Thus, a sideways range could be formed above the support level of 1509. As long as the previous highs are not breached, gold could be looking to test the support. If the support gives way, then we anticipate a correction toward 1485 where the next main support level stands.
InMode Ltd. reported Q2/19 earnings and announced that international pop superstar Paula Abdul will be its brand ambassador sending shares “Straight Up” 15% as investors “Rush Rush” to purchase shares today.
InMode Ltd. (INMD:NAQDAQ), a global provider of innovative medical technologies that only a few days ago completed an initial public stock offering (IPO), reported second quarter earnings for the period ending June 30, 2019. The firm also gained a lot of attention as it issued a separate release announcing the appointment of pop icon Paula Abdul as a brand ambassador.
In the announcement, InMode reported record revenue of $38.8 million in Q2/19, an increase of 55% over Q2/18. Gross margins in Q2/19 improved to 87%, compared to 84% year-over-year. Operating margin for Q2/19 improved to 41%, compared to 31% in Q2/18, and the company reported net income of $15.8 million, or $0.45 per diluted share in Q2/19, compared to $7.6 million or $0.21 per diluted share in Q2/18.
The company reported a total cash position of $82.8 million, including cash and cash equivalents, marketable securities and deposits. This amount excludes the $70 million proceeds raised in InMode’s initial public offering.
Moshe Mizrahy, the firm’s CEO and chairman stated, “We are pleased with our second quarter results, which are consistent with both our reported expectations and the positive trends we are continuing to see in our business.”
The Q2/19 earnings report comes only a few days after the company announced the closing of its initial public offering on August 12, 2019, of 5,000,000 ordinary shares at an initial public offering price of $14.00 per ordinary share. The aggregate gross proceeds, before deducting underwriting discounts and commissions and other offering expenses, to InMode from the offering were approximately $70.0 million. The shares began trading on the Nasdaq Global Select Market on August 8, 2019, under the symbol INMD.
Yesterday, the company proudly announced that Paula Abdul has agreed to serve as a brand ambassador for InMode in order to share her positive experience with the company’s BodyTite, FaceTite and Morpheus8 technologies. Paula Abdul is an international pop icon who made her mark in the entertainment industry as an award-winning dancer and choreographer, singer, actress and television personality with six number-one singles on the Billboard Hot 100, Emmy and Grammy awards, and numerous other accolades.
InMode states that its business is a leading global provider of innovative medical technologies. The firm develops, manufactures and markets devices harnessing novel radio-frequency (RF) technology, leveraging its medically accepted, minimally invasive RF technologies to offer a comprehensive line of products across several categories for plastic surgery, gynecology, dermatology, otolaryngology and ophthalmology. Within the global aesthetics market, the company indicates that its products and solutions are primarily designed to address three energy-based treatment categories: face and body contouring, medical aesthetics and women’s health.
InMode’s shares opened this morning at $17.42 (+$3.42, +24.43%) over yesterday’s close of $14.00. Today, shares have traded as high as $17.50 and are currently trading at $16.24 (+$2.24, +16.00%), while the broader market is seeing major losses.
Disclosure: 1) Stephen Hytha compiled this article for Streetwise Reports LLC and provides services to Streetwise Reports as an independent contractor. He or members of his household own securities of the following companies mentioned in the article: None. He or members of his household are paid by the following companies mentioned in this article: None. 2) The following companies mentioned in this article are billboard sponsors of Streetwise Reports: None. Click here for important disclosures about sponsor fees. 3) Comments and opinions expressed are those of the specific experts and not of Streetwise Reports or its officers. The information provided above is for informational purposes only and is not a recommendation to buy or sell any security. 4) The article does not constitute investment advice. Each reader is encouraged to consult with his or her individual financial professional and any action a reader takes as a result of information presented here is his or her own responsibility. By opening this page, each reader accepts and agrees to Streetwise Reports’ terms of use and full legal disclaimer. This article is not a solicitation for investment. Streetwise Reports does not render general or specific investment advice and the information on Streetwise Reports should not be considered a recommendation to buy or sell any security. Streetwise Reports does not endorse or recommend the business, products, services or securities of any company mentioned on Streetwise Reports. 5) From time to time, Streetwise Reports LLC and its directors, officers, employees or members of their families, as well as persons interviewed for articles and interviews on the site, may have a long or short position in securities mentioned. Directors, officers, employees or members of their immediate families are prohibited from making purchases and/or sales of those securities in the open market or otherwise from the time of the interview or the decision to write an article until three business days after the publication of the interview or article. The foregoing prohibition does not apply to articles that in substance only restate previously published company releases.
Euro-zone economy slowed in second quarter. Will the EU50 decline continue?
Euro-zone economic data have been negative recently: economic growth in euro area slowed in the second quarter, with German economy contracting. Economic data released on Wednesday showed euro zone GDP grew by just 0.2% quarter-on-quarter, after 0.4% growth reported in the first three months of the year. At the same time Germany’s gross domestic product shrank by 0.1% between April and June. And against the background of uncertain prospects of global growth the continuing US-China trade dispute and the increasing likelihood of a no-deal Brexit are additional downside risks for euro-zone economy.
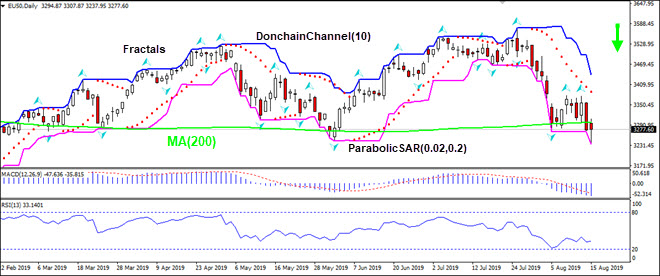
On the daily timeframe EU50: D1 has closed below 200-day moving average MA(200).
The Donchian channel indicates downtrend: it is tilted down.
The MACD indicator is below the signal line with the gap widening. This is a bearish signal.
The RSI oscillator is rising but has not reached the overbought zone.
We believe the bearish momentum will continue after the price breaches below the lower Donchian boundary at 3234.01. This level can be used as an entry point for placing a pending order to sell. The stop loss can be placed above the fractal high at 3375.08. After placing the pending order the stop loss is to be moved every day to the next fractal high, following Parabolic signals. Thus, we are changing the expected profit/loss ratio to the breakeven point. If the price meets the stop-loss level (3375.08) without reaching the order (3234.01) we recommend cancelling the order: the market sustains internal changes which were not taken into account.