By Hussein Sayed, Chief Market Strategist (Gulf & MENA), ForexTime
Stocks higher amid hopes of central banks stimulus
All eyes on Jackson Hole as central bankers meet on Thursday
Equity markets in Asia kicked off the week in green territory as US bond yields edged higher following a positive close to Wall Street on Friday. The rally in global stocks comes despite the fear of an economic slowdown and increasing risk of recession after the US 2-10 yield curve inverted for the first time since 2007.
With sentiment deteriorating, volatility soaring, and investors operating in an environment where global growth has been severely hit by the trade war, it’s time for central bankers to get the money printing machines back to work.
Investors are counting on central banks to save the global economy and equity markets from further turbulence. Traditionally, monetary policymakers respond to economic weakness by cutting interest rates, but given the low bar they can start from, a fresh round of quantitative easing may come into play.
This week, minutes from the latest policy meetings at the Federal Reserve, European Central Bank, and Reserve Bank of Australia will all provide an update on where central banks stand. However, Thursday’s annual meeting at Wyoming where leaders from major central banks gather is what matters the most to investors.
The key questions are can central banks still prevent us from the next downturn? Will they save the bull market? And what tools are they going to use?
Of course, monetary policy isn’t the cure to all problems. They cannot put an end to trade disputes, Brexit, or Hong Kong’s dilemma. All they can do is deliver the forward guidance markets want to hear.
If central banks prove they’re ready to act by delivering interest rate cuts and new quantitative easing programs, expect equity markets to resume their rally after their recent plunge. Otherwise, expect more money to pour into Gold, and other safe havens such as the Japanese Yen and Swiss Franc.
Disclaimer: The content in this article comprises personal opinions and should not be construed as containing personal and/or other investment advice and/or an offer of and/or solicitation for any transactions in financial instruments and/or a guarantee and/or prediction of future performance. ForexTime (FXTM), its affiliates, agents, directors, officers or employees do not guarantee the accuracy, validity, timeliness or completeness, of any information or data made available and assume no liability as to any loss arising from any investment based on the same.
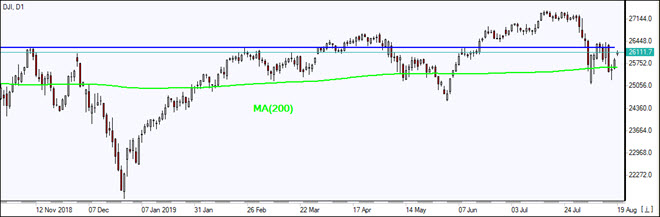
US stock indexes rebounded on Friday as longer term bond yields held above short term debt yields, easing recession fears. The S&P 500 rose 1.4% to 2888.68, falling 1.0% for the week. Dow Jones industrial gained 1.2% to 25886.01. The Nasdaq rallied 1.7% to 7895.99. The dollar strengthening halted as US housing starts fell 4% on month in July while building permits rose 8.4%. The live dollar index data show the ICE US Dollar index, a measure of the dollar’s strength against a basket of six rival currencies, slipped less than 0.1% to 98.16 but is higher currently. Stock index futures point to higher market openings today
DAX leads European indexes movement
European stocks recovered on Friday led by pharmaceutical and bank shares. GBP/USD accelerated its climb while EUR/USD slowed declining on Friday with both pairs reversing their directions currently. The Stoxx Europe 600 Index rose 1.1% Friday. The DAX 30 rallied 1.3% to 11562.74. France’s CAC 40 rose 1.2% and UK’s FTSE 100 gained 0.7% to 7117.15.
Shanghai Composite leads Asian indexes gains
Asian stock indices are rising today as traders closely watch developments in US-Chin trade dispute after president Trump said Sunday he was ‘not ready’ for China trade deal. Nikkei extended gains 0.7% to 20563.16 as yen slowed its slide against the dollar. China’s markets are sharply higher after the central bank announced it is altering the way it sets a key interest rate benchmark to reduce borrowing costs for companies: the Shanghai Composite Index is up 2.1% while Hong Kong’s Hang Seng Index is 2% higher. Australia’s All Ordinaries Index extended gains 1% despite the Australian dollar accelerating its climb against the greenback.
Brent futures prices are extending gains today after a weekend attack on a Saudi oil facility by Yemenis. Prices rose on Friday: Brent for October settlement ended 0.7% higher at $58.64 a barrel Friday.
Note: This overview has an informative and tutorial character and is published for free. All the data, included in the overview, are received from public sources, recognized as more or less reliable. Moreover, there is no guarantee that the indicated information is full and precise. Overviews are not updated. The whole information in each overview, including opinion, indicators, charts and anything else, is provided only for familiarization purposes and is not financial advice or а recommendation. The whole text and its any part, as well as the charts cannot be considered as an offer to make a deal with any asset. IFC Markets and its employees under any circumstances are not liable for any action taken by someone else during or after reading the overview.
Canadian Solar, which operates a portfolio of utility-scale solar operated power plants, reported higher Q2 earnings.
This morning one of the world’s largest solar power companies, Canadian Solar Inc. (CSIQ:NASDAQ), announced financial results for the second quarter ended June 30, 2019.
In the release the firm reported significantly higher net revenue in Q2/19 of $1,036.3 million compared to $484.7 million in Q1/19, and $650.6 million in Q2/18. The company advised that the sequential increase was primarily due to higher solar module shipments and higher revenue from the sale of solar power plants. Total solar module shipments in Q2/19 were 2,143 MW, compared to 1,575 MW in Q1/19 and prior Q2/19 guidance provided of 1.952.05 GW.
Gross profit in Q2/19 was $182.6 million, compared to $107.4 million in Q1/19 and $159.4 million in Q2/18. Income from operations in Q2/19 was $60.7 million, compared to $6.6 million in Q1/19, and $53.9 million in Q2/18. Net income in Q2/19 was $62.7 million, or $1.04 per diluted share, compared to a net loss of $17.2 million, or $0.29 per diluted share in Q1/19 and net income of $15.6 million, or $0.26 per diluted share in Q2/18. As of June 30, 2019, the company had $981.0 million of cash, cash equivalents and restricted cash on its balance sheet, compared to $912.3 million on March 31, 2019.
Q2/19 accounts receivable turnover in Q2/19 improved to 41 days, compared to 91 days in Q1/19, and inventory turnover in Q2/19 was 40 days, compared to 81 days in Q1/19.
Dr. Shawn Qu, chairman and CEO of Canadian Solar, commented, “The company’s strong Q2/19 financial performance is principally due to the resiliency of our business model and our team’s solid execution of the business plan. Our focus on achieving improved operating efficiencies with reduced manufacturing costs across global operations, while continuing to invest in R&D to ensure long-term success, puts us in the most competitive position in the Company’s history. Overall, we are incrementally more positive in the outlook for H2/19 based on the improved visibility, healthy demand levels in key markets, more stable average selling prices and higher capacity utilization levels.”
Dr. Huifeng Chang, SVP and CFO, added, “Our solid execution resulted in the better than expected profitability for Q2/19. We improved the gross margin to 17.6% and delivered a net income of $1.04 per diluted share on a GAAP basis, compared to a loss of $0.29 per diluted share in Q1/19…Importantly, we generated $225.8 million in cash from operations, which allowed us to further reduce total debt and strengthen the balance sheet.”
As of July 31, 2019, the company’s late-stage, utility-scale solar project pipeline, including those in construction, totaled approximately 3.6 GWp, with 1,565 MWp in the U.S., 508.2 MWp in Brazil, 368 MWp in Mexico, 311.8 MWp in Japan, 385 MWp in China and additional 465.2 MWp in total in Australia, Canada, Israel, Taiwan, the Philippines, Malaysia, Italy and South Korea. In the report the company cautioned that some late-stage projects may not reach completion due to such factors as failure to secure permits and grid connection, and changes of political and economic conditions in host countries, among others.
The firm also updated its business outlook. For the full year 2019, the company raised its guidance for total module shipments to the range of approximately 8.48.5 GW from the previous guidance of 7.47.8 GW. Total revenue for the year is expected to be in the range of $3.53.8 billion.
Canadian Solar is a global energy provider based in Ontario, Canada, with subsidiaries in 19 countries on six continents. The company states that it is both a global leading manufacturer of solar photovoltaic modules (PV) and a provider of solar energy solutions. The firm indicates that it has over 13,000 employees globally, and operates state-of-the-art manufacturing facilities in Canada, China, Brazil and Southeast Asian countries. The firm has module manufacturing capacity and has delivered more than 36 GW of premium quality solar modules to customers in over 150 countries in the past 18 years.
The firm’s (CSIQ) shares opened today at $21.35 (+$0.75, +3.64%) versus the prior day’s close of $20.60. Today, the stock has traded between $21.1224.25 and at present is priced at $23.19 (+$2.59, +12.57%).
Disclosure: 1) Stephen Hytha compiled this article for Streetwise Reports LLC and provides services to Streetwise Reports as an independent contractor. He or members of his household own securities of the following companies mentioned in the article: None. He or members of his household are paid by the following companies mentioned in this article: None. 2) The following companies mentioned in this article are billboard sponsors of Streetwise Reports: None. Click here for important disclosures about sponsor fees. 3) Comments and opinions expressed are those of the specific experts and not of Streetwise Reports or its officers. The information provided above is for informational purposes only and is not a recommendation to buy or sell any security. 4) The article does not constitute investment advice. Each reader is encouraged to consult with his or her individual financial professional and any action a reader takes as a result of information presented here is his or her own responsibility. By opening this page, each reader accepts and agrees to Streetwise Reports’ terms of use and full legal disclaimer. This article is not a solicitation for investment. Streetwise Reports does not render general or specific investment advice and the information on Streetwise Reports should not be considered a recommendation to buy or sell any security. Streetwise Reports does not endorse or recommend the business, products, services or securities of any company mentioned on Streetwise Reports. 5) From time to time, Streetwise Reports LLC and its directors, officers, employees or members of their families, as well as persons interviewed for articles and interviews on the site, may have a long or short position in securities mentioned. Directors, officers, employees or members of their immediate families are prohibited from making purchases and/or sales of those securities in the open market or otherwise from the time of the interview or the decision to write an article until three business days after the publication of the interview or article. The foregoing prohibition does not apply to articles that in substance only restate previously published company releases.
An update on this company’s valuation is provided in a Raymond James report.
In an Aug. 13 research note, analyst Pavel Molchanov reported that Raymond James boosted its rating on Chart Industries Inc. (GTLS:NASDAQ) to Outperform from Market Perform, “taking a positive stance for the first time since December 2016.”
The stock, currently trading near a 52-week low, “is no longer in priced-for-perfection territory,” Molchanov indicated. The stock was trading at $58.67 when the report was released and is currently at $59.36; Raymond James’ target price is $72 per share; when.
Molchanov highlighted that Chart management’s anticipated 2020 upside, equivalent to an earnings per share of about $8.008.75, is not only uncertain but also likely unattainable. The upside is based on the company landing large liquefied natural gas (LNG) contracts, thereby generating revenue of $300370 million.
Yes, Chart will most probably land at least one of the expected contracts, acknowledged Molchanov. Yet the “U.S.-China trade war (and resulting tariff on U.S. LNG) is a headwind that will likely delay certain final investment decisions, above and beyond the macro LNG market uncertainty.”
However, Chart no longer needs to attain that upside “for the stock to work,” Molchanov pointed out. This is due to its revenue mix and expected future oil prices. About 60% of the company’s revenue is linked to the energy sector and the remaining roughly 40% to non-energy industrials. Oil prices forecasted for 2020 by Raymond James at $92.50 West Texas Intermediate and $100 Brent translate to “positive readthrough for Chart’s base energy revenue, (i.e.) everything other than large LNG projects.”
Also, because the market’s previous excitement around large LNG projects is no longer attached to Chart’s stock, the LNG “opportunity is an essentially free option at the current entry point,” added Molchanov.
He concluded, “Chart is a one-of-a-kind company with no direct public comps.” What differentiates it from specialty industrials is its high sensitivity to commodities. Thus, “the higher the commodity, the more room for upside surprises.”
Disclosure: 1) Doresa Banning compiled this article for Streetwise Reports LLC and provides services to Streetwise Reports as an independent contractor. She or members of her household own securities of the following companies mentioned in the article: None. She or members of her household are paid by the following companies mentioned in this article: None. 2) The following companies mentioned in this article are billboard sponsors of Streetwise Reports: None. Click here for important disclosures about sponsor fees. 3) Comments and opinions expressed are those of the specific experts and not of Streetwise Reports or its officers. The information provided above is for informational purposes only and is not a recommendation to buy or sell any security. 4) The article does not constitute investment advice. Each reader is encouraged to consult with his or her individual financial professional and any action a reader takes as a result of information presented here is his or her own responsibility. By opening this page, each reader accepts and agrees to Streetwise Reports’ terms of use and full legal disclaimer. This article is not a solicitation for investment. Streetwise Reports does not render general or specific investment advice and the information on Streetwise Reports should not be considered a recommendation to buy or sell any security. Streetwise Reports does not endorse or recommend the business, products, services or securities of any company mentioned on Streetwise Reports. 5) From time to time, Streetwise Reports LLC and its directors, officers, employees or members of their families, as well as persons interviewed for articles and interviews on the site, may have a long or short position in securities mentioned. Directors, officers, employees or members of their immediate families are prohibited from making purchases and/or sales of those securities in the open market or otherwise from the time of the interview or the decision to write an article until three business days after the publication of the interview or article. The foregoing prohibition does not apply to articles that in substance only restate previously published company releases.
Disclosures from Raymond James, Chart Industries Inc., August 13, 2019
ANALYST INFORMATION
Analysts Holdings and Compensation: Equity analysts and their staffs at Raymond James are compensated based on a salary and bonus system. Several factors enter into the bonus determination, including quality and performance of research product, the analyst’s success in rating stocks versus an industry index, and support effectiveness to trading and the retail and institutional sales forces. Other factors may include but are not limited to: overall ratings from internal (other than investment banking) or external parties and the general productivity and revenue generated in covered stocks.
The analyst Pavel Molchanov, primarily responsible for the preparation of this research report, attests to the following: (1) that the views and opinions rendered in this research report reflect his or her personal views about the subject companies or issuers and (2) that no part of the research analyst’s compensation was, is, or will be directly or indirectly related to the specific recommendations or views in this research report. In addition, said analyst(s) has not received compensation from any subject company in the last 12 months.
RAYMOND JAMES RELATIONSHIP DISCLOSURES Certain affiliates of the RJ Group expect to receive or intend to seek compensation for investment banking services from all companies under research coverage within the next three months.
Raymond James & Associates, Inc. makes a market in the shares of Chart Industries, Inc.
Additional Risk and Disclosure information, as well as more information on the Raymond James rating system and suitability categories, is available here.
A Mackie Research Capital Corp. report provided the reasons why the cheap price of this company’s stock is unwarranted.
In an Aug. 9 research note, Bill Newman, an analyst with Mackie Research Capital Corp., reported that after having a “solid” Q2/19, Prairie Provident Resources Inc.’s (PPR:TSX) stock is still “incredibly cheap.”
Mackie has a target price on Prairie Provident of CA$0.70 per share, which reflects a potential eight-fold gain as the company’s current share price is around CA$0.08.
Newman reviewed the energy firm’s highlights from Q2/19. Quarterly production was a record high, averaging 6,386 barrels of oil equivalent per day (6,386 boe/day). It also was 24% higher than Q2/18 production of 5,146 boe/day. In terms of average production for 2019, management reiterated its guidance, between 6,100 and 6,500 boe/day.
Also noteworthy, indicated Newman, was that Prairie Provident’s adjusted funds flow in Q2/19 was about $6.6 million, which exceeded Mackie’s estimate of $5.9 million. It also was more than double the Q2/19 capital expenditures of $3.2 million, which means the oil & gas company is “living within cash flow.”
Given its current status and near-term developments, Prairie Provident should be valued higher, Newman purported. For one, it is generating free cash flow. Two, its most recently drilled well at Princess is “highly economic” and could pay out in under 10 months’ time. Three, the company is likely to drill two more wells this year. Four, it could have a “cash windfall from the Quebec asset arbitration process,” added the analyst.
Mackie maintains its Buy recommendation, Newman wrote, “on the company’s long-term growth potential from its large inventory of development oil locations and expanding waterflood programs.”
Disclosure: 1) Doresa Banning compiled this article for Streetwise Reports LLC and provides services to Streetwise Reports as an independent contractor. She or members of her household own securities of the following companies mentioned in the article: None. She or members of her household are paid by the following companies mentioned in this article: None. 2) The following companies mentioned in this article are billboard sponsors of Streetwise Reports: None. Click here for important disclosures about sponsor fees. 3) Comments and opinions expressed are those of the specific experts and not of Streetwise Reports or its officers. The information provided above is for informational purposes only and is not a recommendation to buy or sell any security. 4) The article does not constitute investment advice. Each reader is encouraged to consult with his or her individual financial professional and any action a reader takes as a result of information presented here is his or her own responsibility. By opening this page, each reader accepts and agrees to Streetwise Reports’ terms of use and full legal disclaimer. This article is not a solicitation for investment. Streetwise Reports does not render general or specific investment advice and the information on Streetwise Reports should not be considered a recommendation to buy or sell any security. Streetwise Reports does not endorse or recommend the business, products, services or securities of any company mentioned on Streetwise Reports. 5) From time to time, Streetwise Reports LLC and its directors, officers, employees or members of their families, as well as persons interviewed for articles and interviews on the site, may have a long or short position in securities mentioned. Directors, officers, employees or members of their immediate families are prohibited from making purchases and/or sales of those securities in the open market or otherwise from the time of the interview or the decision to write an article until three business days after the publication of the interview or article. The foregoing prohibition does not apply to articles that in substance only restate previously published company releases.
Disclosures from Mackie Research, Prairie Provident Resources Inc., August 9, 2019
RELEVANT DISCLOSURES APPLICABLE TO COMPANIES UNDER COVERAGE Relevant disclosures required under Rule 3400 applicable to companies under coverage discussed in this research report are available on our web site at www.mackieresearch.com.
ANALYST CERTIFICATION Each analyst of Mackie Research Capital Corporation whose name appears in this report hereby certifies that (i) the recommendations and opinions expressed in this research report accurately reflect the analyst’s personal views and (ii) no part of the research analyst’s compensation was or will be directly or indirectly related to the specific conclusions or recommendations expressed in this research report.
Mackie Research Capital Corporation, its directors, officers and other employees may, from time to time, have positions in the securities mentioned herein.
Bill Newman: I, or members of my immediate household or family, own shares of the following companies mentioned in this article: None. Within the last two years, Mackie Research Capital has managed or comanaged an offering of securities for, and received compensation for investment banking and related services from Prairie Provident Resources Inc. Bill Newman has research coverage on Prairie Provident Resources Inc.
Here are the latest links to our coverage of the Commitment of Traders data changes.
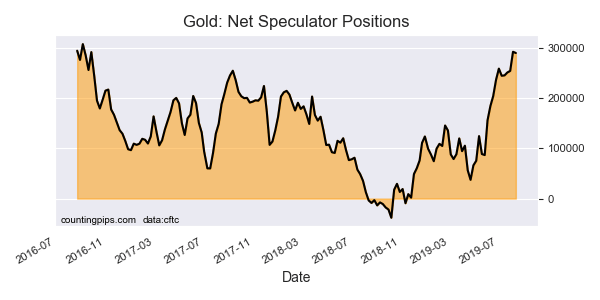
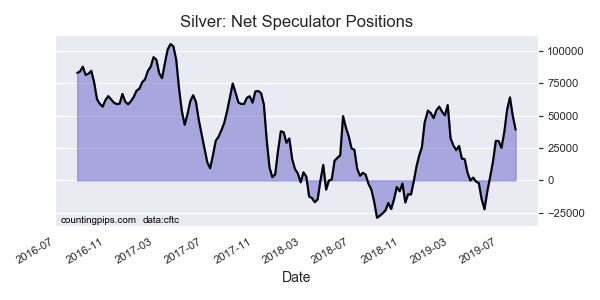
This week in the COT data, precious metals speculators cut back on their Gold and Silver positions after both have had very strong gains in the past few months. Gold speculators edged their bullish bets lower while Silver speculators sharply reduced their bullish bets for a 2nd week.
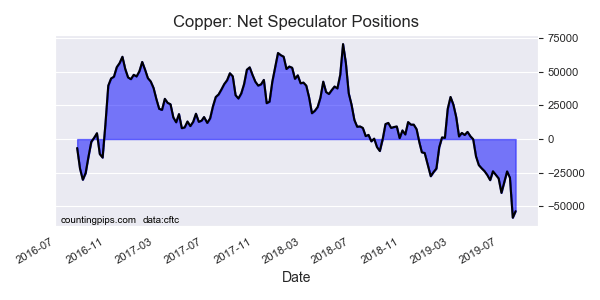
Copper speculators, meanwhile, pulled back on their bearish bets this week. Last week, Copper bearish positions had risen by the most on record for one week (-29,694 contracts) to a new all-time record high bearish position of -58,449 contracts.
In currencies, the USD Index speculators trimmed their bullish bets for the first time in seven weeks. Japanese yenbets improved for a 4th week and rose by over +14,000 net contracts for a second straight week.
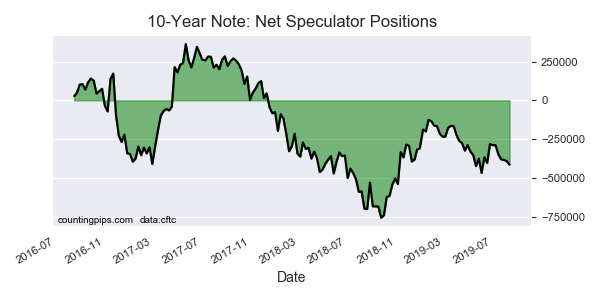
The 10-Year Bond speculators continued to push their bearish bets higher for a fifth straight week. Despite the speculative bearishness, the 10-Year Note price has continued to rise sharply higher while the 10-year yield has fallen to all the way down to 1.55 percent.
Finally, the WTI Crude Oil speculators added to their bullish bets this week after positions had fallen in the previous three straight weeks.
Large currency speculators reduced their net positions in the US Dollar Index futures markets this week, according to the latest Commitment of Traders (COT) data released by the Commodity Futures Trading Commission (CFTC) on Friday. See full article.
The large speculator contracts of WTI crude futures totaled a net position of 382,144 contracts, according to the latest data this week. This was a change of 6,503 contracts from the previous weekly total. See full article.
Large speculator contracts of the 10-Year Bond futures totaled a net position of -414,346 contracts, according to the latest data this week. This was a change of -23,460 contracts from the previous weekly total. See full article.
Large precious metals speculator contracts of the Gold futures totaled a net position of 290,090 contracts, according to the latest data this week. This was a change of -2,455 contracts from the previous weekly total. See full article.
Large precious metals speculator contracts of the silver futures totaled a net position of 39,269 contracts, according to the latest data this week. This was a change of -10,563 contracts from the previous weekly total. See full article.
Metals speculator contracts of the copper futures totaled a net position of -53,600 contracts, according to the latest data this week. This was a change of 4,849 contracts from the previous weekly total. See full article.
*COT Report: The COT data, released weekly to the public each Friday, is updated through the most recent Tuesday (data is 3 days old) and shows a quick view of how large speculators or non-commercials (for-profit traders) were positioned in the futures markets.
The CFTC categorizes trader positions according to commercial hedgers (traders who use futures contracts for hedging as part of the business), non-commercials (large traders who speculate to realize trading profits) and nonreportable traders (usually small traders/speculators).
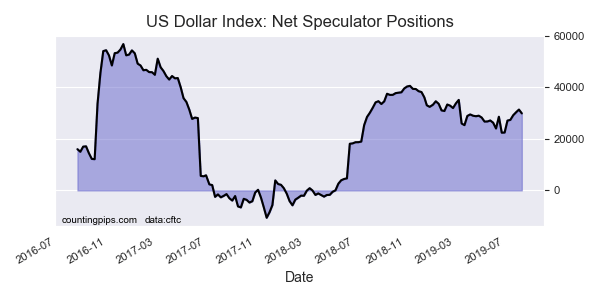
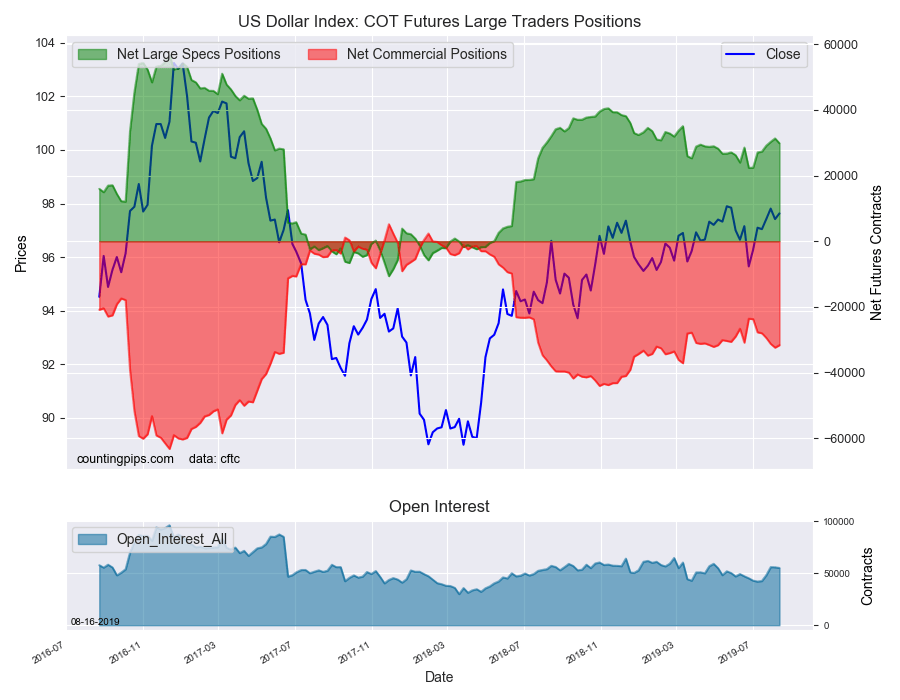
Large currency speculators cut back on their bullish bets in the US Dollar Index futures markets this week, according to the latest Commitment of Traders (COT) data released by the Commodity Futures Trading Commission (CFTC) on Friday.
The non-commercial futures contracts of US Dollar Index futures, traded by large speculators and hedge funds, totaled a net position of 29,842 contracts in the data reported through Tuesday August 13th. This was a weekly lowering of -1,487 contracts from the previous week which had a total of 31,329 net contracts.
This week’s net position was the result of the gross bullish position (longs) falling by -1,457 contracts (to a weekly total of 47,874 contracts) compared to the gross bearish position (shorts) which rose by 30 contracts on the week (to a total of 18,032 contracts).
Large speculators cooled off on their bullish bets for the USD Index this week following six straight weeks of gains. The current speculative position remains strongly bullish but has fallen below the +30,000 net contract level for the first time in three weeks.
Individual Currencies Data this week:
In the other major currency contracts data, we saw just one substantial change (+ or – 10,000 contracts) in the speculators category this week.
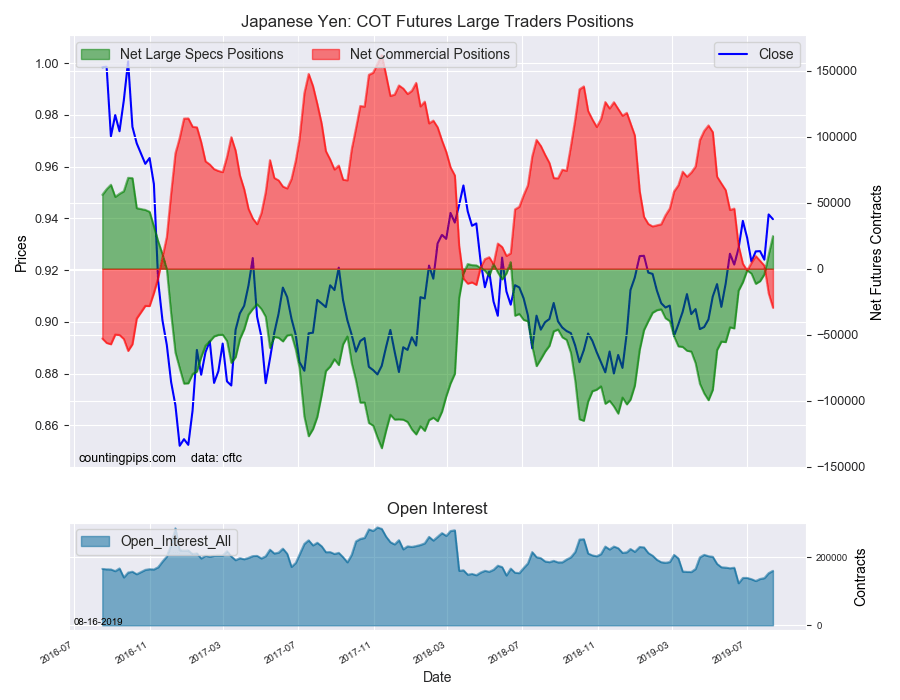
Japanese yen positions rose for a fourth straight week and by over +14,000 net contracts for a second straight week. Yen positions turned from overall bearish to bullish just last week and are now at the most bullish level since November 8th of 2016 (a span of 144 weeks).
Overall, the major currencies that saw improving speculator positions this week were the British pound sterling (6,882 contracts), Japanese yen (14,181 contracts) and the Swiss franc (3,479 contracts).
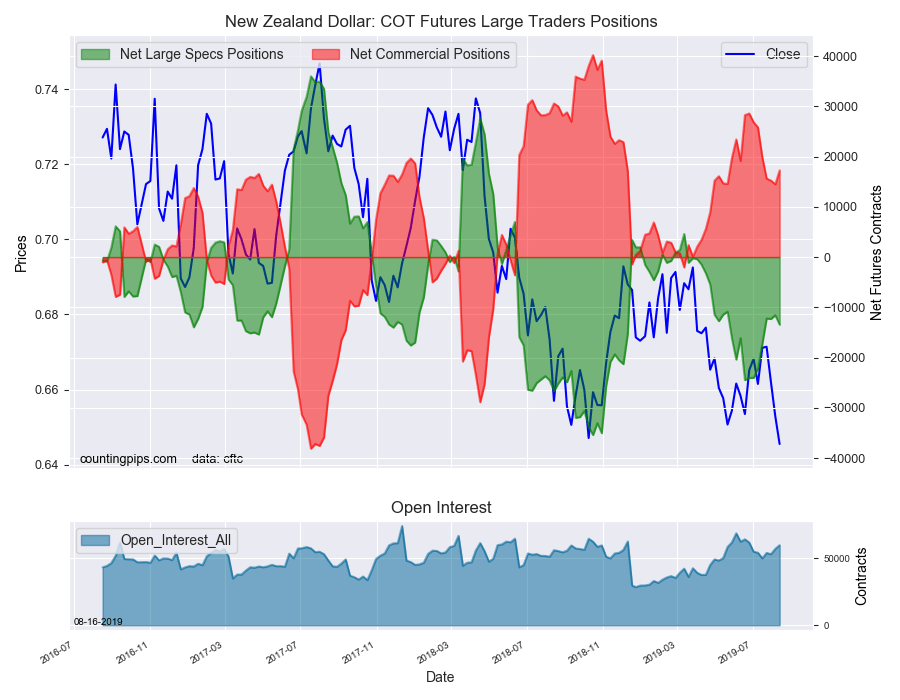
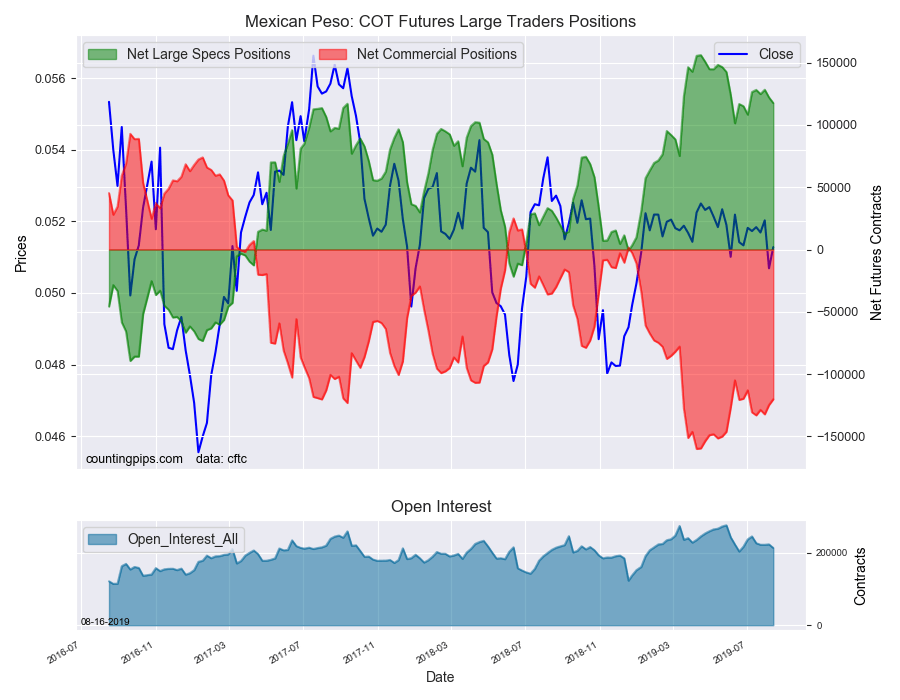
The currencies whose speculative bets declined this week were the US dollar index (-1,487 weekly change in contracts), euro (-2,639 weekly change in contracts), Canadian dollar (-9,966 contracts), Australian dollar (-7,401 contracts), New Zealand dollar (-1,883 contracts) and the Mexican peso (-4,507 contracts).
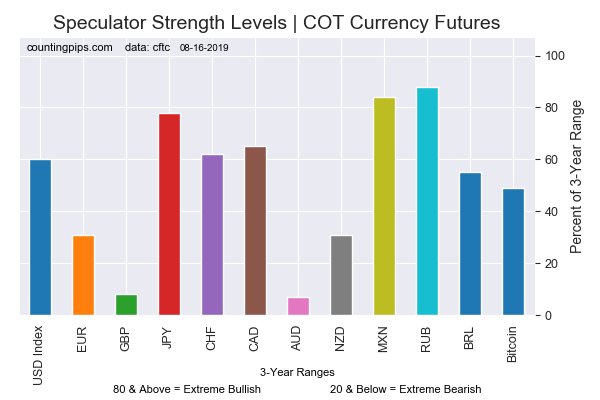
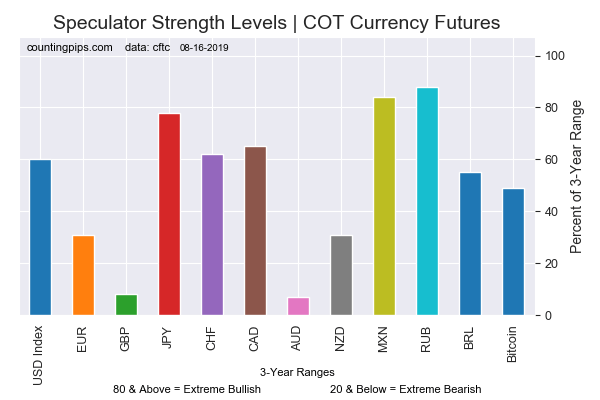
Chart: Current Strength of Each Currency compared to their 3-Year Range
See the table and individual currency charts below.
Table of Large Speculator Levels & Weekly Changes:
Currency
Net Speculator Position
Specs Weekly Change
USD Index
29,842
-1,487
EuroFx
-46,649
-2,639
GBP
-95,820
6,882
JPY
24,742
14,181
CHF
-12,952
3,479
CAD
14,200
-9,966
AUD
-62,912
-7,401
NZD
-13,447
-1,883
MXN
117,562
-4,507
This latest COT data is through Tuesday and shows a quick view of how large speculators or non-commercials (for-profit traders) were positioned in the futures markets. All currency positions are in direct relation to the US dollar where, for example, a bet for the euro is a bet that the euro will rise versus the dollar while a bet against the euro will be a bet that the dollar will gain versus the euro.
Weekly Charts: Large Trader Weekly Positions vs Price
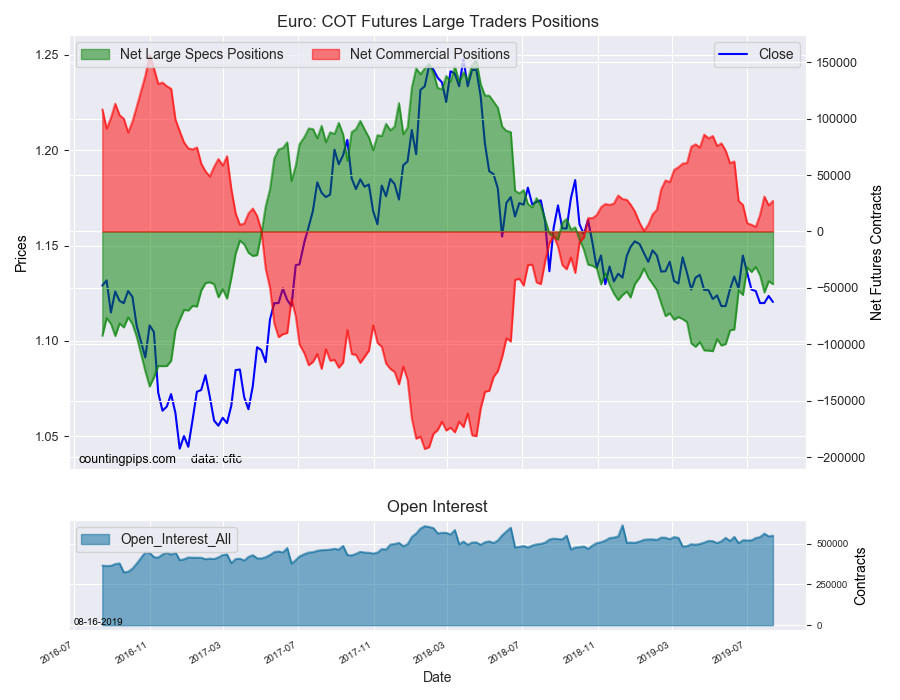
EuroFX:
The Euro large speculator standing this week reached a net position of -46,649 contracts in the data reported through Tuesday. This was a weekly lowering of -2,639 contracts from the previous week which had a total of -44,010 net contracts.
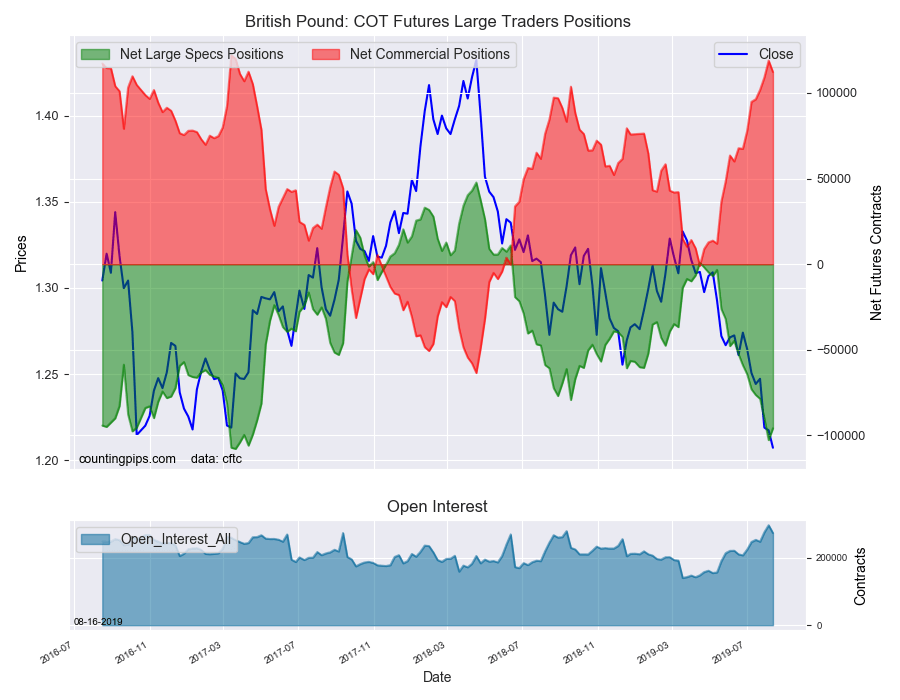
British Pound Sterling:
The large British pound sterling speculator level totaled a net position of -95,820 contracts in the data reported this week. This was a weekly gain of 6,882 contracts from the previous week which had a total of -102,702 net contracts.
Japanese Yen:
Large Japanese yen speculators reached a net position of 24,742 contracts in this week’s data. This was a weekly increase of 14,181 contracts from the previous week which had a total of 10,561 net contracts.
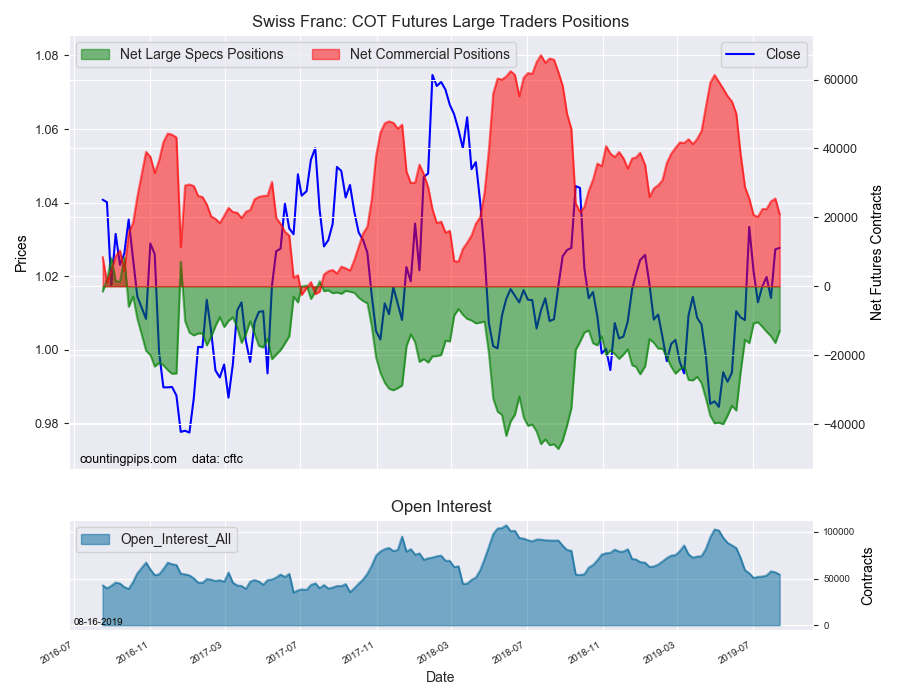
Swiss Franc:
The Swiss franc speculator standing this week was a net position of -12,952 contracts in the data through Tuesday. This was a weekly increase of 3,479 contracts from the previous week which had a total of -16,431 net contracts.
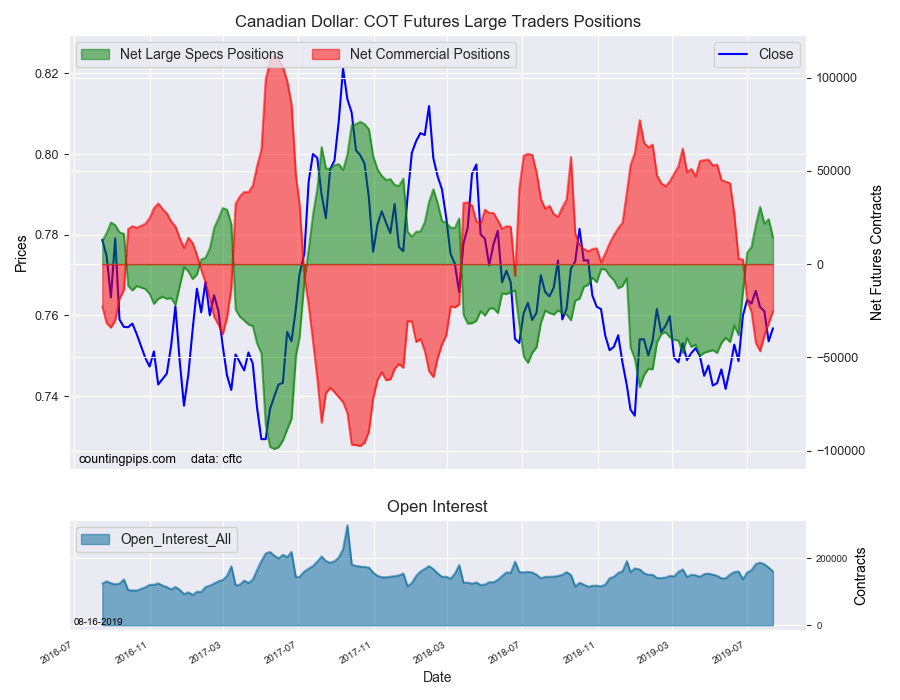
Canadian Dollar:
Canadian dollar speculators equaled a net position of 14,200 contracts this week. This was a decrease of -9,966 contracts from the previous week which had a total of 24,166 net contracts.
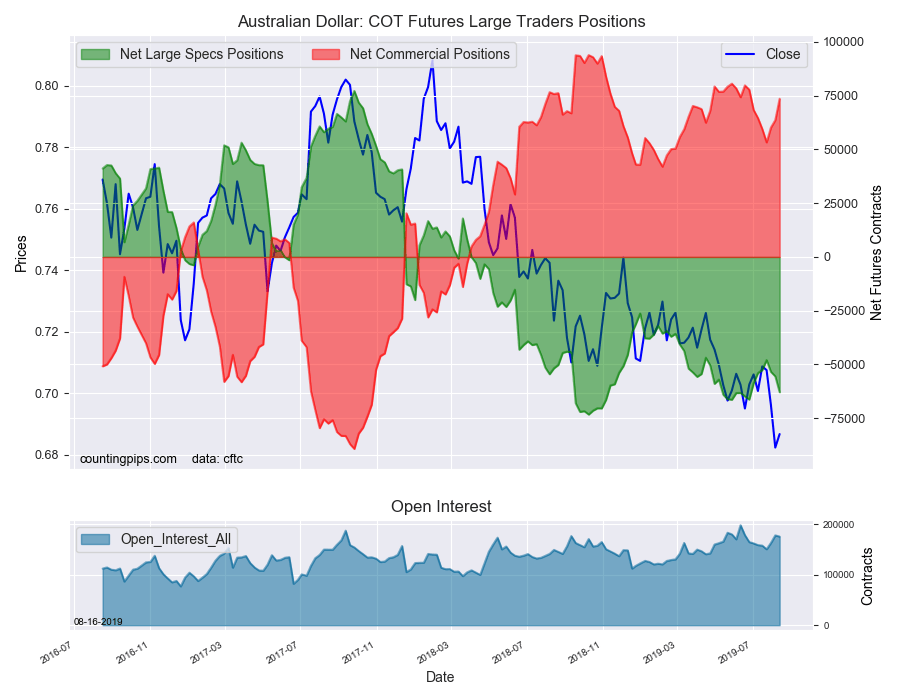
Australian Dollar:
The large speculator positions in Australian dollar futures reached a net position of -62,912 contracts this week in the data ending Tuesday. This was a weekly decrease of -7,401 contracts from the previous week which had a total of -55,511 net contracts.
New Zealand Dollar:
The New Zealand dollar speculative standing reached a net position of -13,447 contracts this week in the latest COT data. This was a weekly fall of -1,883 contracts from the previous week which had a total of -11,564 net contracts.
Mexican Peso:
Mexican peso speculators reached a net position of 117,562 contracts this week. This was a weekly fall of -4,507 contracts from the previous week which had a total of 122,069 net contracts.
*COT Report: The COT data, released weekly to the public each Friday, is updated through the most recent Tuesday (data is 3 days old) and shows a quick view of how large speculators or non-commercials (for-profit traders) were positioned in the futures markets.
The CFTC categorizes trader positions according to commercial hedgers (traders who use futures contracts for hedging as part of the business), non-commercials (large traders who speculate to realize trading profits) and nonreportable traders (usually small traders/speculators).
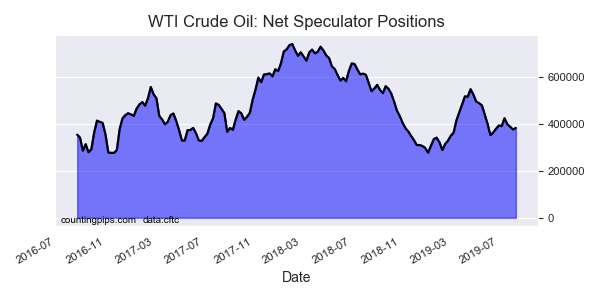
Large energy speculators lifted their bullish net positions in the WTI Crude Oil futures markets this week, according to the latest Commitment of Traders (COT) data released by the Commodity Futures Trading Commission (CFTC) on Friday.
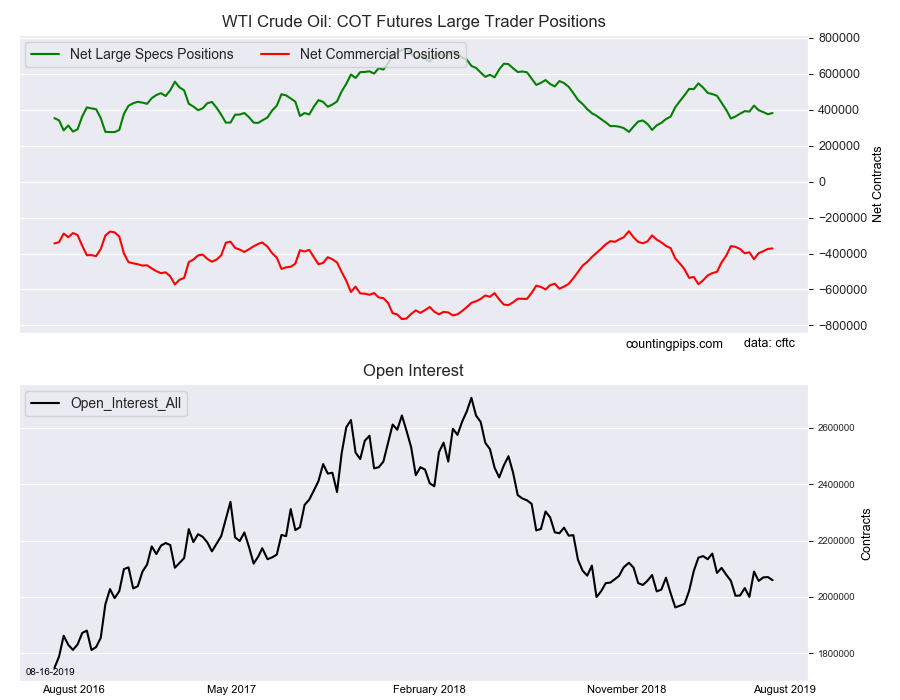
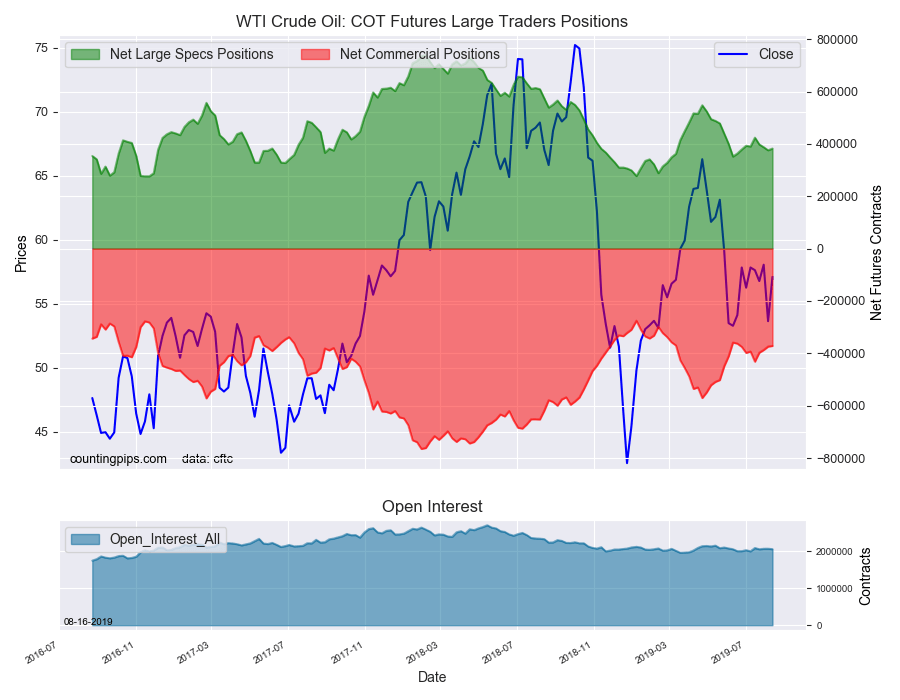
The non-commercial futures contracts of WTI Crude Oil futures, traded by large speculators and hedge funds, totaled a net position of 382,144 contracts in the data reported through Tuesday August 13th. This was a weekly rise of 6,503 net contracts from the previous week which had a total of 375,641 net contracts.
The week’s net position was the result of the gross bullish position (longs) advancing by 6,116 contracts (to a weekly total of 547,040 contracts) while the gross bearish position (shorts) fell by -387 contracts for the week (to a total of 164,896 contracts).
The large speculators had trimmed their bullish positions in the previous three weeks before this week’s turnaround. The current position, although bullish, remains under the +400,000 net contract level for a fourth straight week.
WTI Crude Oil Commercial Positions:
The commercial traders position, hedgers or traders engaged in buying and selling for business purposes, totaled a net position of -371,534 contracts on the week. This was a weekly boost of 2,555 contracts from the total net of -374,089 contracts reported the previous week.
WTI Crude Oil Futures:
Over the same weekly reporting time-frame, from Tuesday to Tuesday, the WTI Crude Oil Futures (Front Month) closed at approximately $57.10 which was a rise of $3.47 from the previous close of $53.63, according to unofficial market data.
*COT Report: The COT data, released weekly to the public each Friday, is updated through the most recent Tuesday (data is 3 days old) and shows a quick view of how large speculators or non-commercials (for-profit traders) as well as the commercial traders (hedgers & traders for business purposes) were positioned in the futures markets.
The CFTC categorizes trader positions according to commercial hedgers (traders who use futures contracts for hedging as part of the business), non-commercials (large traders who speculate to realize trading profits) and nonreportable traders (usually small traders/speculators).
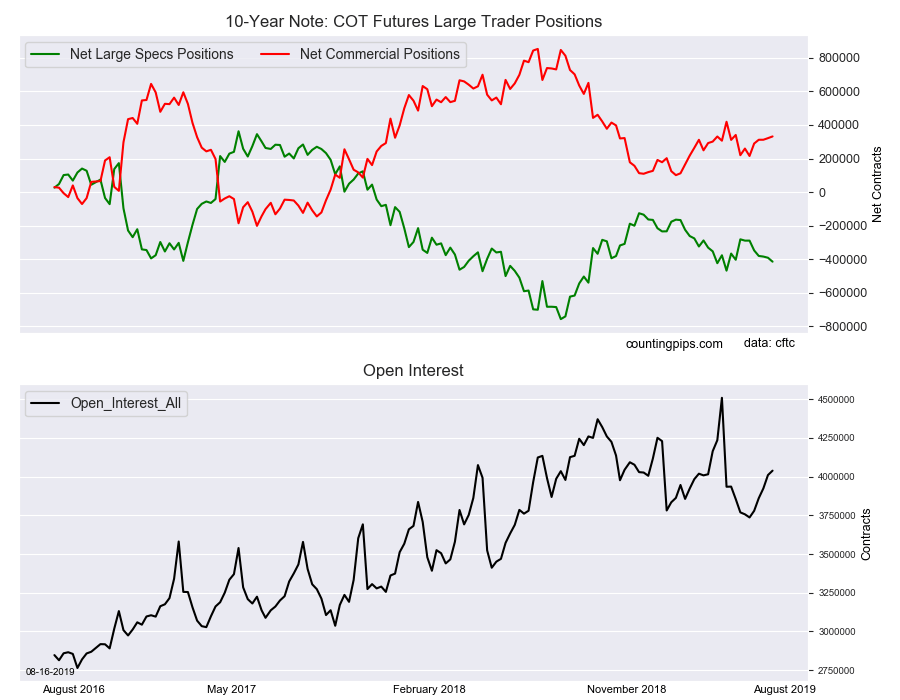
Large bond speculators once again increased their bearish net positions in the 10-Year Note futures markets this week, according to the latest Commitment of Traders (COT) data released by the Commodity Futures Trading Commission (CFTC) on Friday.
The non-commercial futures contracts of 10-Year Note futures, traded by large speculators and hedge funds, totaled a net position of -414,346 contracts in the data reported through Tuesday August 13th. This was a weekly change of -23,460 net contracts from the previous week which had a total of -390,886 net contracts.
The week’s net position was the result of the gross bullish position (longs) lowering by -23,062 contracts (to a weekly total of 635,384 contracts) while the gross bearish position (shorts) increased by just 398 contracts for the week (to a total of 1,049,730 contracts).
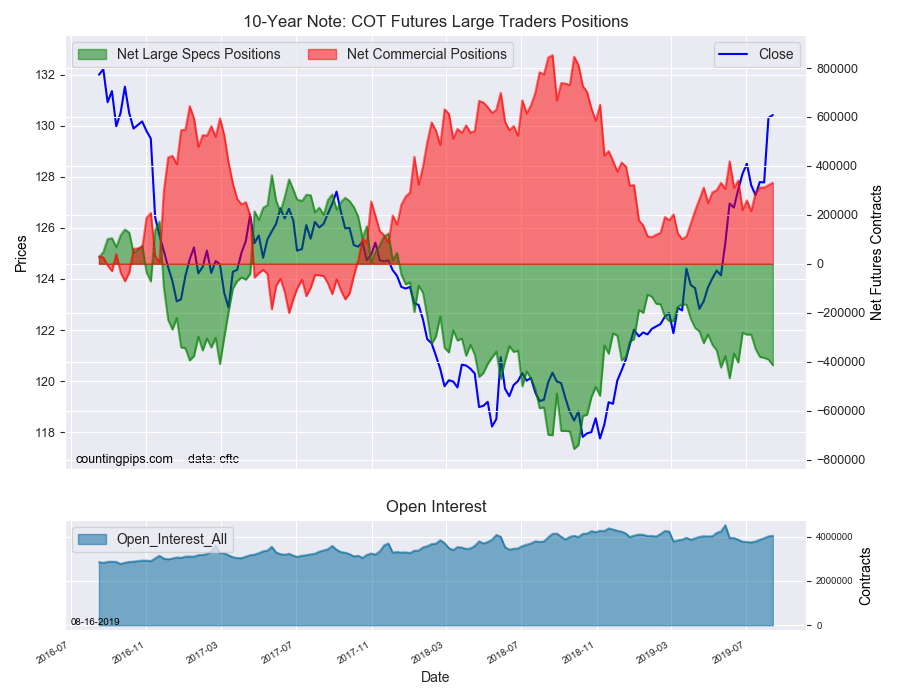
The large speculators kept on raising their bearish bets for a fifth straight week this week and by a total of -125,510 contracts over that time-frame. Speculators have been consistently bearish on the 10-year note all year and continue to bet against the price trend of the 10-year note. The price has sharply risen higher since November while the 10-year yield has fallen to approximately 1.55 percent.
10-Year Note Commercial Positions:
The commercial traders position, hedgers or traders engaged in buying and selling for business purposes, totaled a net position of 331,680 contracts on the week. This was a weekly increase of 10,267 contracts from the total net of 321,413 contracts reported the previous week.
10-Year Note Futures:
Over the same weekly reporting time-frame, from Tuesday to Tuesday, the 10-Year Note Futures (Front Month) closed at approximately $130.42 which was an increase of $0.10 from the previous close of $130.31, according to unofficial market data.
*COT Report: The COT data, released weekly to the public each Friday, is updated through the most recent Tuesday (data is 3 days old) and shows a quick view of how large speculators or non-commercials (for-profit traders) as well as the commercial traders (hedgers & traders for business purposes) were positioned in the futures markets.
The CFTC categorizes trader positions according to commercial hedgers (traders who use futures contracts for hedging as part of the business), non-commercials (large traders who speculate to realize trading profits) and nonreportable traders (usually small traders/speculators).
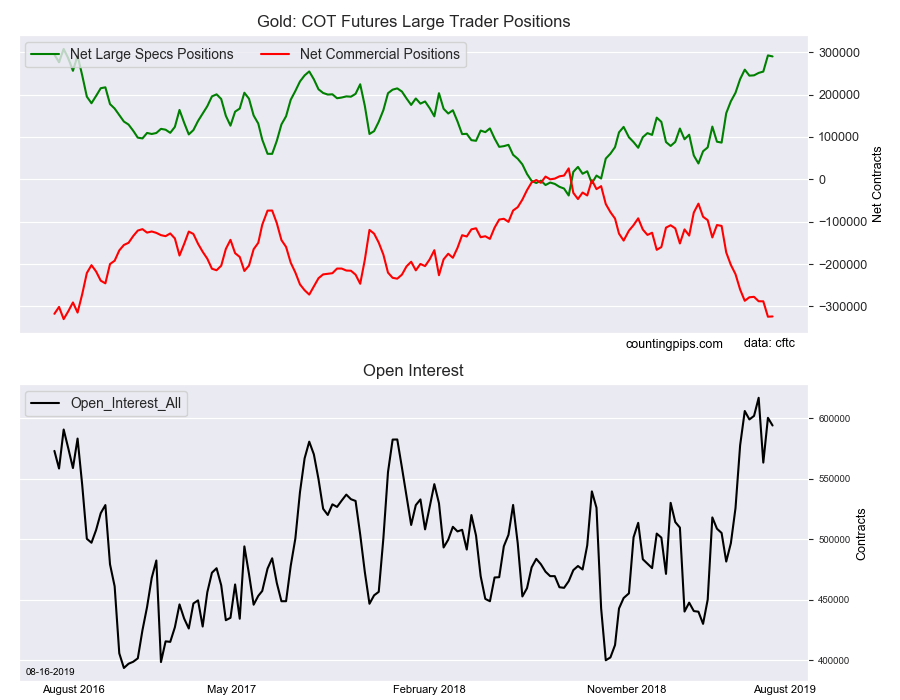
Large precious metals speculators slightly lowered their bullish net positions in the Gold futures markets this week after a streak of strong gains, according to the latest Commitment of Traders (COT) data released by the Commodity Futures Trading Commission (CFTC) on Friday.
The non-commercial futures contracts of Gold futures, traded by large speculators and hedge funds, totaled a net position of 290,090 contracts in the data reported through Tuesday August 13th. This was a weekly decrease of -2,455 net contracts from the previous week which had a total of 292,545 net contracts.
The week’s net position was the result of the gross bullish position (longs) sliding by -4,335 contracts (to a weekly total of 346,223 contracts) while the gross bearish position (shorts) declined by -1,880 contracts for the week (to a total of 56,133 contracts).
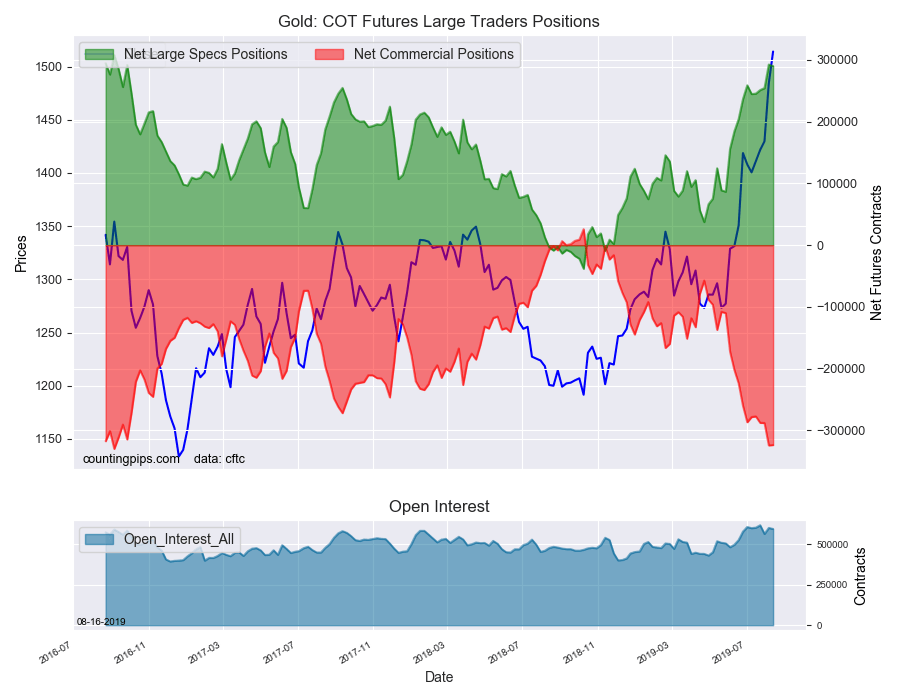
Gold speculators took their foot off the gas pedal this week after having risen for nine out of the previous ten weeks and by a total of +205,857 contracts over that period. Overall, the speculator bets continue to be in a very strong bullish position and just below the +300,000 net contract level which has not been reached since June of 2016.
Gold Commercial Positions:
The commercial traders position, hedgers or traders engaged in buying and selling for business purposes, totaled a net position of -323,727 contracts on the week. This was a weekly uptick of 598 contracts from the total net of -324,325 contracts reported the previous week.
Gold Futures:
Over the same weekly reporting time-frame, from Tuesday to Tuesday, the Gold Futures (Front Month) closed at approximately $1514.10 which was a rise of $29.9 from the previous close of $1484.20, according to unofficial market data.
*COT Report: The COT data, released weekly to the public each Friday, is updated through the most recent Tuesday (data is 3 days old) and shows a quick view of how large speculators or non-commercials (for-profit traders) as well as the commercial traders (hedgers & traders for business purposes) were positioned in the futures markets.
The CFTC categorizes trader positions according to commercial hedgers (traders who use futures contracts for hedging as part of the business), non-commercials (large traders who speculate to realize trading profits) and nonreportable traders (usually small traders/speculators).
 Article by ForexTime