USD has been a little higher this morning, although moves have been limited. The market is expecting a quiet session this week as mid-summer trading lulls kick in. On the data front, there’s little to note, aside from Fed chairman Powell due to speak at the Jackson Hole Symposium on Friday. USD index trades 98.08 last.
Euro Fighting to Get Higher
EURUSD has been slightly firmer against USD so far today. This is following a strong sell-off into the end of last week which saw price breaking down below the 1.1112 level. Price is currently still below this level, and given the concerns around the health of the eurozone and the expectations for further easing from the ECB, further downside is likely in the near term.
GBP Down on Brexit Document
GBPUSD has come under pressure once again today as the market reacts to the latest Brexit fears. The leaked Yellowhammer document highlights the government’s concern over the potential impact of a no-deal Brexit which could cause huge disruption according to the projections made. GBPUSD trades 1.2118 last, with price sitting near channel lows still.
Risk Assets Rally
Risk assets have started the week on a better footing. Following Trump’s comments on the solid progress being made in US/China trade negotiations, the SPX500 has traded up off last week’s lows to reclaim the 2908.55 level. Price trades 1915.93 last.
Safe Havens Down as Risk Recovers
Safe havens have been a little lower over the European session so far on Monday, given the better risk tone at the start of the week. Both JPY and gold have traded lower against USD as the market once again attaches optimism to the ongoing trade negotiations. USDJPY trades 106.55 last with price still capped by the 106.77 resistance for now. XAUUSD trades 1498.72 last, as price continues the sell-off from the rejection at the 1522.75 level.
Crude Supported
Oil prices have traded higher over the session so far also, though flows have been light. The recent volatility around the US/China trade story has calmed down for now and if we can see further positive headlines around negotiations, this could be good for oil. Crude trades 55.26 last with price sitting just off recent lows following the rejection at the latest test of the bearish trend line from July highs.
High Betas Bounce Back
USDCAD has come under pressure today. Despite a higher USD, it seems that better risk appetite in light of supportive comments around the US/China trade story is keeping CAD supported. USDCAD trades 1.3258 last with price having broken back beneath the 1.33 level.
AUDUSD is trading on a better footing today also, albeit only slightly. The consolidation around the .6758 level continues with price managing to remain above the level for now. Better risk appetite around the trade story is keeping AUD supported though the sell-off in gold is offsetting some of the positive impacts.
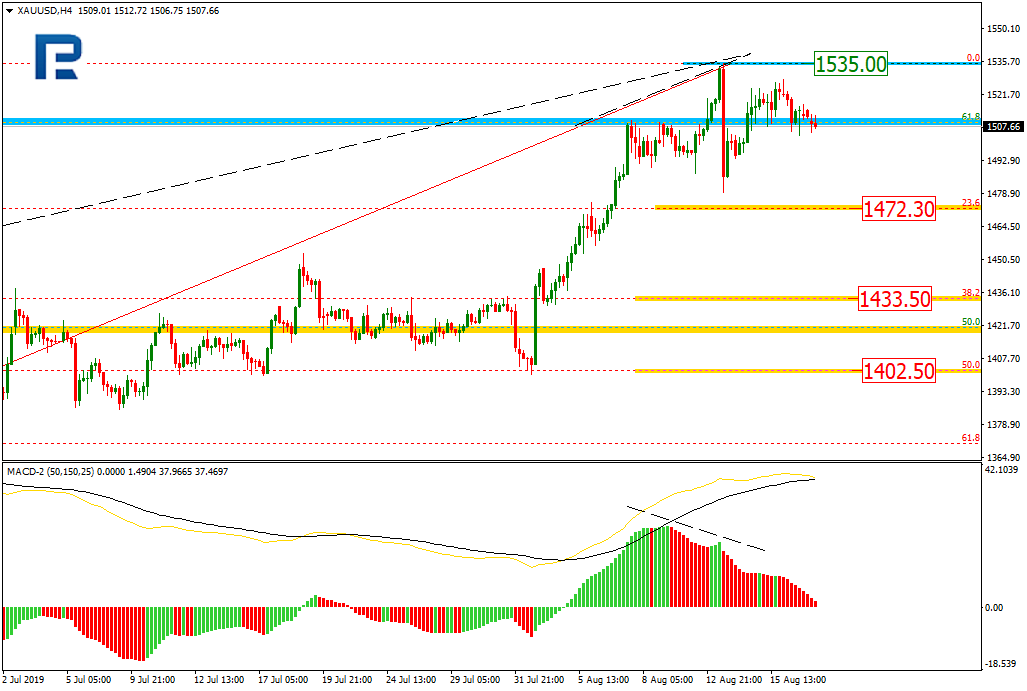
On H4, the instrument has formed two divergences upon reaching the long-term level of 61.8%: a long-term divergence and a short-term one. A stable decline to the levels of 23.6% (1472.30), 38.2% (1433.50) and 50.0% (1402.50) may follow, judging by the situation. The resistance is at the maximum of 1535.00.
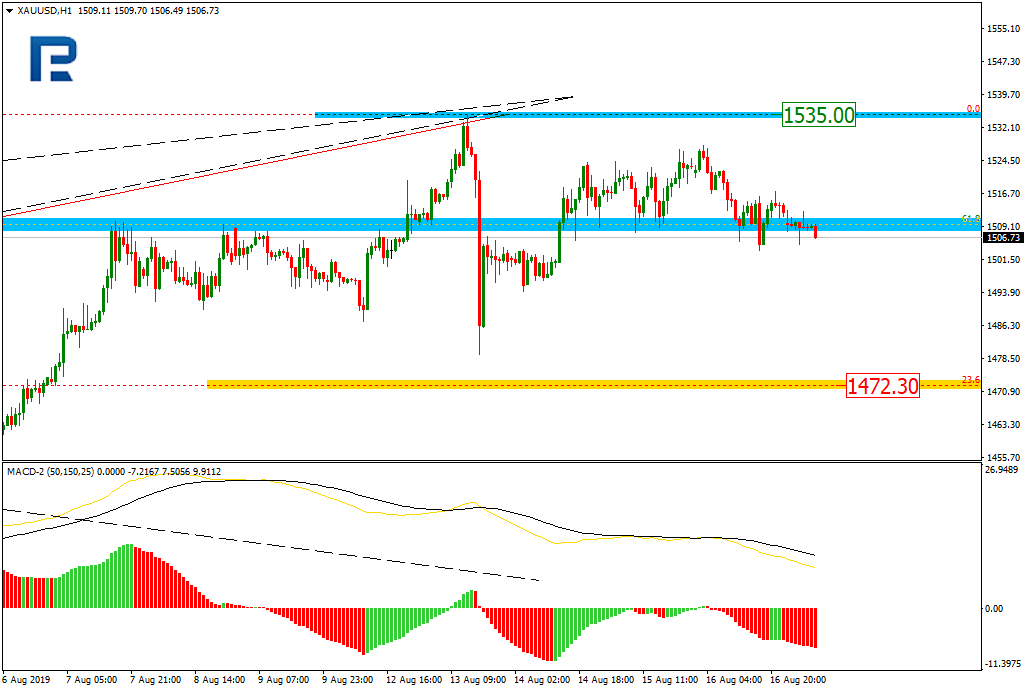
On H1, the quotations return to the long-term level of 61.8% Fibo after a swift impuse of descending. The closest aim of the new impulse may be at 23.6% (1472.30) Fibo.
USDCHF
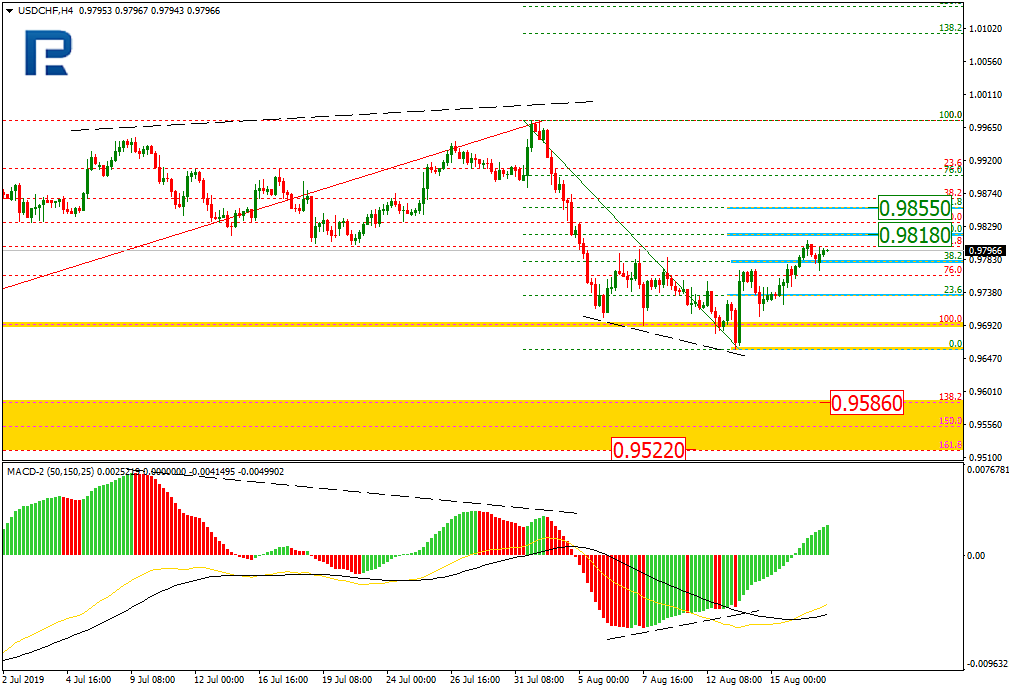
On H4, the instrument is developing a correction phase after testing the significant minimum, and a convergence. The correction has reached 38.2% Fibo by now. Further growth may aim at 50.0% (0.9818) and 61.8% (0.9855). A breakaway of the local minimum may be followed by a decline to a post-correctional extension of 138.2-161.8% (0.9586-0.9522).
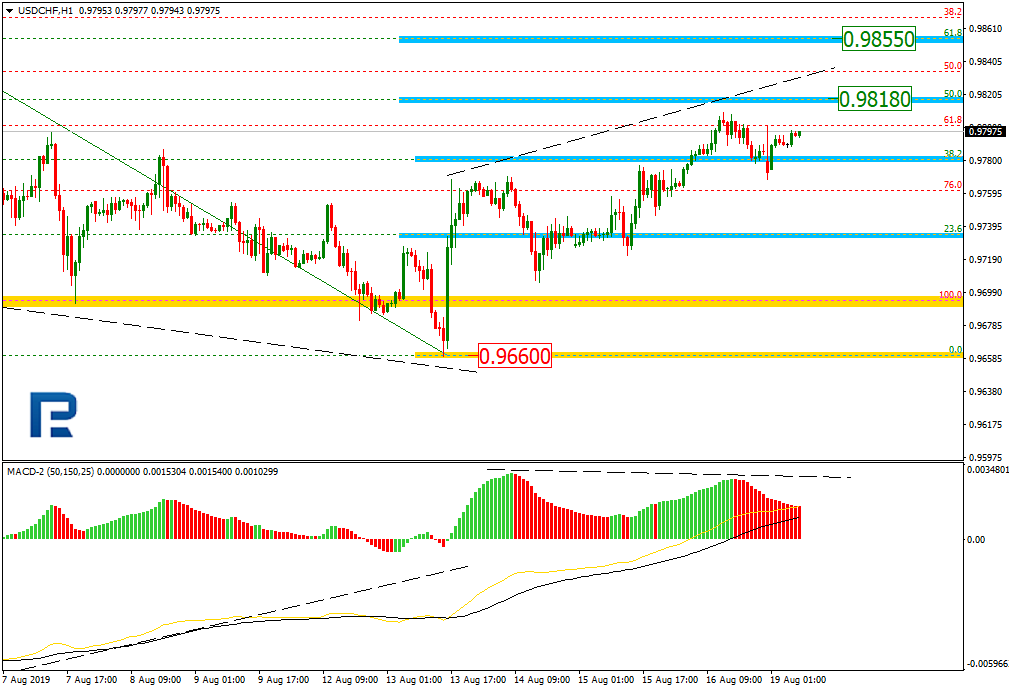
On H1 the pair is demonstrating an uptrend inside the previous declining wave. The growth is aiming at 50.0% (0.9818) Fibo; at the same time, a local divergence is forming, hinting on a potential for a reversal.
Attention! Forecasts presented in this section only reflect the author’s private opinion and should not be considered as guidance for trading. RoboForex LP bears no responsibility for trading results based on trading recommendations described in these analytical reviews.
As you can probably imagine, we’ve received a ton of emails and questions about our recent predictions for precious metals and the August 19 breakdown date in the global markets. It seems everyone is reading our research posts and is curious about how to prepare for these moves and how we came up with these predictions months in advance. In this second part of our metals & Aug 19 update post, we’ll try to highlight our expectations going into the weekend prior to the Aug 19 breakdown date (Monday).
In the first part of this research post, we highlighted what we believe is the imminent completion of the MID Leg 1 upside move in precious metals. Our research continues to suggest that we are still setting up a major LEG 1 upside move which should be considered a larger Elliot Wave structure. Within this Wave (Leg) 1 formation, a typical 5 wave structure is likely to continue forming. Currently, we are creating the Wave 3 of the total of 5 waves that will complete a finished upside Wave (Leg 1).
If our analysis is correct, the peak that ends Wave 1 could be well above $2000 for Gold and well above $24 to $28 for Silver. Then, of course, we’ll set up for a corrective Wave #2 before another, BIGGER, upside wave #3 sets up in precious metals.
Taking a look at this Weekly Silver chart, you may be able to see the waves as we see them..
_ The upside price move from Dec 14, 2015, to July 4, 2016 sets up the initial upside Wave 1 leg.
_ The low in November 2018 sets up the end of corrective wave B from the initial bottom on December 14, 2015.
_ This setup suggests we are currently starting a Wave 3 upside move which is usually 1.5x larger (or more) than Wave 1.
_ Keep in mind that we believe all of these “minor wave” formations are part of a much larger 5 wave structure that is setting up.
As you look at the Fibonacci diagram, above, remember that within each of those waves (1 through 5), a typical complex price wave formation (1, 3, 5, or other more complex wave formation) will set up to complete the broader wave formation. Therefore, as you review the chart below, keep in mind that we believe everything originating from the bottom on December 14, 2015, till now is still part of the WAVE 1 formation on that Elliot Wave chart. We are just getting started with this move, folks.
Silver Weekly Chart with Wave 1
The YELLOW arrows we’ve drawn on this Silver chart are our expectations for Silver over the next 6+ weeks and will potentially complete the initial upside minor wave 3 formation/ Leg 1. We do understand that Elliot Wave counting can be difficult to understand, but please allow use to preface this research by suggesting that every larger wave consists of smaller waves. And those smaller waves, consist of sets of even smaller waves. And so it continues all the way down to sub-one-minute charts. The point we’re trying to make is that the $21 endpoint on this chart is very likely just the end of Wave 1, subwave 3, impulse move C which may target a total of D moves before reaching the end of subwave 3. To put it in more simple terms, we are only about 20% into this upside move right now based on our expectations.
Why is the move in precious metals so important for our August 19 breakdown date prediction? Because we would expect precious metals to begin a massive price rally if the global stock markets were expecting some type of major downside rotational event. A more into metals is a safety play for global investors. If something is happening in the markets and fear becomes more evident, then precious metals should start to rally. This sets up an expectation that some type of price revaluation event is likely to take place in the near future.
Thus, the upside price moves in Gold and Silver align perfectly with our August 19 breakdown expectation. The key to this, in our opinion, is that Silver has really started to skyrocket on large volume. This creates “confluence” in the metals group that fear is now driving investors into the lesser Silver market in preparation for a price reversion move soon.
Weekly Transportation Index chart
This Transportation Index chart highlights the fact that investors believe the future 3 to 6 months in the global economy will be moderately slower and that transportation activity and revenues will likely continue to diminish. The Transportation Index is an excellent measure of future global economic expectations that can be used as a “general market indicator” for future expectations.
Dow Jones Weekly Chart
This YM Weekly chart highlights the key Fibonacci price trigger level that has setup near $26,170. This is the critical price level for the YM to actually generate a confirmed Bearish price trend (end of week closing bar price level) which may be the initial downside price trigger. As of the creation of this chart, the YM price was above this Fibonacci trigger level. But as of right now, the YM price is already below the Fibonacci trigger level and if the YM closes the week below this level, then we would have a new confirmed Bearish Fibonacci price trend.
CONCLUDING THOUGHTS:
The interesting fact behind all of this is that these predictions were made by our research team months before today. Our Gold prediction was initiated near October 5, 2018. Our August 19 breakdown date was initiated near May 2019 (originally as a July Topping pattern expectation and later revised to the August 19 breakdown date). All of these predictions were created using our proprietary price modeling, predictive analysis tools, and advanced cycle analysis tools.
We find it absolutely incredible that we are able to make these types of predictions many months into the future and watch the markets do exactly what we suggested would happen. Obviously, we hope you are finding value in our research posts and modeling systems as well?
If you have not already prepared for the August 19 breakdown date prediction, we would suggest that you consider how you would want to protect any open long positions at this time (headed into the weekend) and set up your portfolio for a broader market rotation and upside move in precious metals over the next 3+ months. It is not too late to take action to protect your assets – even weeks past August 19, you can still act to take advantage of these bigger price moves. We are simply urging you to plan and prepare for these moves as you read our research posts.
FORECASTED MOVES FOR GOLD, SILVER, MINERS, AND STOCK INDEXES
In early June I posted a detailed video explaining in showing the bottoming formation and gold and where to spot the breakout level, I also talked about crude oil reaching it upside target after a double bottom, and I called short term top in the SP 500 index. This was one of my premarket videos for members it gives you a good taste of what you can expect each and every morning before the Opening Bell. Watch Video Here.
I then posted a detailed report talking about where the next bull and bear markets are and how to identify them. This report focused mainly on the SP 500 index and the gold miners index. My charts compared the 2008 market top and bear market along with the 2019 market prices today. See Comparison Charts Here.
On June 26th I posted that silver was likely to pause for a week or two before it took another run up on June 26. This played out perfectly as well and silver is now head up to our first key price target of $17. See Silver Price Cycle and Analysis.
More recently on July 16th, I warned that the next financial crisis (bear market) was scary close, possibly just a couple weeks away. The charts I posted will make you really start to worry. See Scary Bear Market Setup Charts.
The EUR/USD currency pair had become stable after a rather significant fall last week. The trading instrument is currently consolidating. A unidirectional trend is not observed. Investors expect additional drivers. The local support and resistance levels are 1.10700 and 1.11000, respectively. Today we expect important statistics on the Eurozone’s economy. Positions should be opened from key levels.
The News Feed on 19.08.2019:
– Consumer price index in the Eurozone at 12:00 (GMT+3:00).
Indicators point to the power of sellers: the price has fixed below 50 MA and 100 MA.
The MACD histogram is in the negative zone, but above the signal line, which gives a weak signal to sell EUR/USD.
Stochastic Oscillator is in the neutral zone, the %K line is above the %D line, which indicates the bullish sentiment.
Trading recommendations
Support levels: 1.10700, 1.10500
Resistance levels: 1.11000, 1.11300, 1.11650
If the price fixes below 1.10700, a further fall in the EUR/USD quotes is expected. The movement is tending to 1.10500-1.10200.
An alternative could be the growth of the EUR/USD currency pair to 1.11300-1.11500.
The GBP/USD currency pair
Technical indicators of the currency pair:
Prev Open: 1.20819
Open: 1.21500
% chg. over the last day: +0.53
Day’s range: 1.21401 – 1.21725
52 wk range: 1.2015 – 1.3385
The bullish sentiment prevails on the GBP/USD currency pair. The British pound is currently testing key highs. The local support and resistance levels are 1.21400 and 1.21750, respectively. A trading instrument has the potential for further recovery after a continuous fall. Financial market participants continue to monitor the situation concerning Brexit. Positions should be opened from key levels.
Today, the publication of important economic releases from the UK is not planned.
Indicators point to the power of buyers: the price has fixed above 50 MA and 100 MA.
The MACD histogram is in the positive zone and continues to rise, which signals the bullish sentiment.
Stochastic Oscillator is near the overbought zone, the %K line is above the %D line, which gives a weak signal to buy GBP/USD.
Trading recommendations
Support levels: 1.21400, 1.21000, 1.20750
Resistance levels: 1.21750, 1.22100
If the price fixes above 1.21750, further correction of the GBP/USD quotes is expected. The movement is tending to 1.22000-1.22300.
An alternative could be a decrease in the GBP/USD currency pair to a round level of 1.21000.
The USD/CAD currency pair
Technical indicators of the currency pair:
Prev Open: 1.33122
Open: 1.32694
% chg. over the last day: -0.29
Day’s range: 1.32602 – 1.33770
52 wk range: 1.2727 – 1.3664
On Friday, the USD/CAD currency pair moved away from local highs. The fall in quotes exceeded 45 points. The loonie is currently consolidating. The key range is 1.32600-1.32900. The positive dynamics of oil quotes support the Canadian dollar. At the same time, we do not exclude the further growth of USD/CAD quotes. Today, the news feed is calm enough. We recommend opening positions from key levels.
The publication of important economic reports from Canada is not planned.
Indicators do not give accurate signals: the price has crossed 100 MA.
The MACD histogram is in the negative zone, but above the signal line, which gives a weak signal to sell USD/CAD.
Stochastic Oscillator is in the overbought zone, the %K line has crossed the %D line. There are no signals at the moment.
Trading recommendations
Support levels: 1.32600, 1.32150, 1.31850
Resistance levels: 1.32900, 1.33250, 1.33450
If the price fixes above the level of 1.32900, further growth of the USD/CAD currency pair is expected. The movement is tending to 1.33200-1.33500.
An alternative could be a fall in the USD/CAD quotes to 1.32300-1.32150.
The USD/JPY currency pair
Technical indicators of the currency pair:
Prev Open: 106.056
Open: 106.250
% chg. over the last day: +0.25
Day’s range: 106.241 – 106.473
52 wk range: 104.97 – 114.56
The technical pattern is still ambiguous on the USD/JPY currency pair. A trading instrument is consolidating. At the moment, USD/JPY quotes are testing the resistance level of 106.500. The 106.100 mark is the nearest support. The USD/JPY currency pair has the potential for further growth. We recommend paying attention to the dynamics of the US government bonds yield. Positions should be opened from key levels.
During the Asian trading session, mixed data on Japan’s trade balance have been published.
Indicators point to the power of buyers: the price has fixed above 50 MA and 100 MA.
The MACD histogram is in the positive zone, but below the signal line, which gives a weak signal to buy USD/JPY.
Stochastic Oscillator is in the neutral zone, the %K line is above the %D line, which indicates the bullish sentiment.
Trading recommendations
Support levels: 106.100, 105.750, 105.500
Resistance levels: 106.500, 107.000
If the price fixes above 106.500, further growth of the USD/JPY currency pair is expected. The movement is tending to the round level of 107.000.
An alternative could be a fall in the USD/JPY quotes to 105.750-105.500.
The economic calendar for the week ahead is expected to remain sparse due to the summer lull. Yet, despite the quiet period ahead, a few economic events will be of interest for market participants.
Key events stand out over the week including the meeting minutes from the Federal Reserve and the RBA. The annual Jackson Hole Symposium is also due which will, no doubt, generate some interest.
This comes on the back of various central banks moving to an easing cycle and the main trade war narrative. This week also hosts the G7 summit happening in France.
Japan’s Data Under Scrutiny
Last week, Japan posted a strong GDP number for the second quarter, rather surprisingly. Investors will be looking to key economic indicators such as the trade balance, inflation data, and manufacturing sectors. The data will likely provide more information on how the economy is faring and whether the second-quarter strength in GDP will spill into the third quarter as well.
July Trade Figures to Show Falling Exports
Economists polled expect the trade figures due on Monday to fall 2.2% on the year. This is later followed by the flash manufacturing PMI for August. Manufacturing, as per the current trend, is expected to remain weak.
Inflation Expected to Remain Unchanged in July
The economic data from Japan ends with the inflation figures due on Friday. Japan’s core CPI, which excludes the volatile food and energy prices, is expected to remain unchanged in July.
In the previous month, the core CPI fell to a two-year low of 0.6% in June. The stubbornly low inflation gives the BoJ officials an impetus to ramp up its stimulus program. But, so far, officials have been skeptical about increasing the QE program.
ECB Minutes & Flash PMIs to Set Tone for Euro
After the European Central Bank dropped ample clues about potential easing, it followed through by officially confirming this at the July ECB meeting.
Draghi said that the central bank was looking to lower interest rates further and even restart the QE program. However, the decision for this is likely to come at the September monetary policy meeting. In the run-up to this big-ticket event, data from the eurozone will be closely watched.
The Italian prime minister will also be facing a vote of no confidence this week on August 20th.
Flash PMI & Inflation Figures to Give Broad Economic Picture
The week is relatively quiet with no top tier data coming out. However, the final inflation figures for the eurozone are due this week. Headline CPI rose by 1.1% on the year ending July, while core CPI rose to a pace of just 0.9% during the same period.
The final inflation figures will likely confirm the view that inflation remains weak for the eurozone. This will likely raise the prospects of some action from the ECB this week.
ECB Minutes Could Give More Clarity to Investors
This week, the central bank will be releasing its monetary policy meeting minutes. The minutes will likely show the deliberations behind the scenes. The plan to restart QE is once again raising some opposing views from within the governing council. The main question from investors is how far the central bank will go in regards to building a sizeable stimulus program.
Jackson Hole Symposium to Overshadow Quiet Week
Not much is happening on the US front as far as the economic calendar is concerned. The Jackson Hole symposium will start this week, with the G7 meeting following a few days later. Trade war disputes and the central bank monetary policy course will be the main topics of discussions during these events.
Symposium Focuses on Monetary Policy Challenges
The annual Jackson Hold symposium is entitled “Challenges for Monetary policy.” The theme comes as various central banks have turned dovish, with some even moving to an easing cycle. Fed Chair, Jerome Powell will be speaking on August 23.
Fed Meeting Minutes to Give More Clarity on Fed
On Wednesday, the Federal Reserve will be releasing its monetary policy meeting minutes. The minutes cover the July FOMC meeting where the central bank lowered interest rates by a quarter basis point. However, the rate cut was not unanimous. There were two dissenting voters during the meeting.
The central bank chief also made it very clear that the rate cut was only an adjustment rather than the start of the easing cycle. The FOMC meeting and the Jackson Hole symposium are back to back and this could see some volatility for the USD.
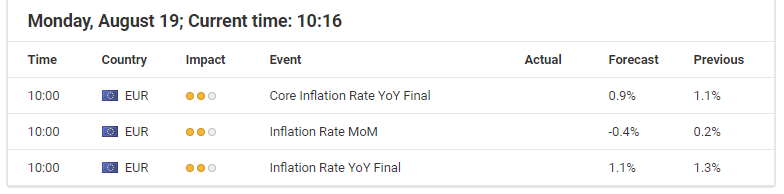
As we start the trading week, we want to focus on the DAX30 CFD. While the economic docket is quite thin, and the main focus among market participants certainly lies with the intensifying trade dispute between the USA and China, the eurozone’s inflation will at least taken with elevated interest.
This is especially true after the latest comments from Finnish ECB member Rehn ,who said in an interview with the Wallstreet Journal last Thursday that “it is important that we (the ECB) come up with a significant and impactful policy package in September”.
With that in mind, any print which comes in below expectations could result in a bullish stint, at least short-term, since market participants could consider such a low inflation reading as an intensifying sign of the ECB delivering such a significant stimulus package (and surely vice versa: a higher than expected print could trigger bearish impulses in the DAX30 CFD).
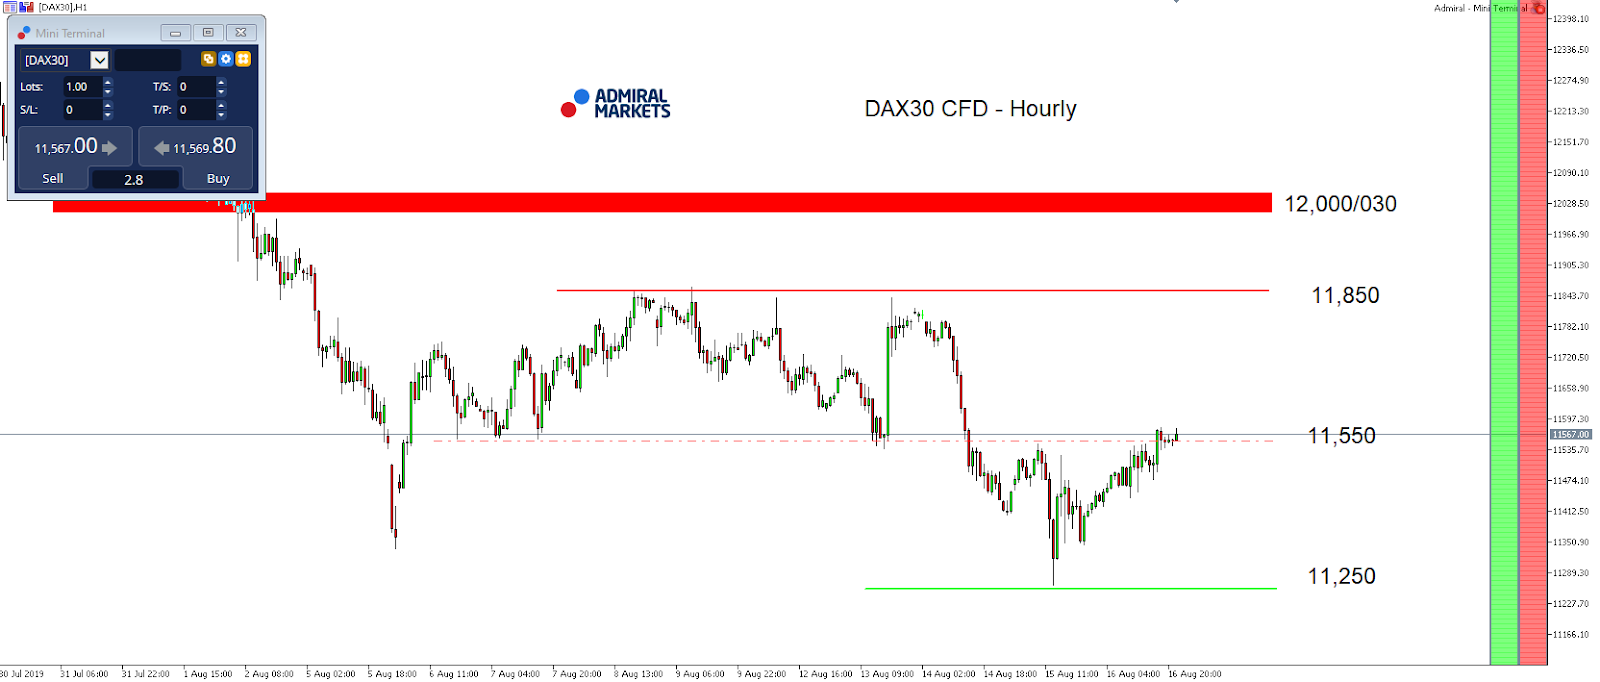
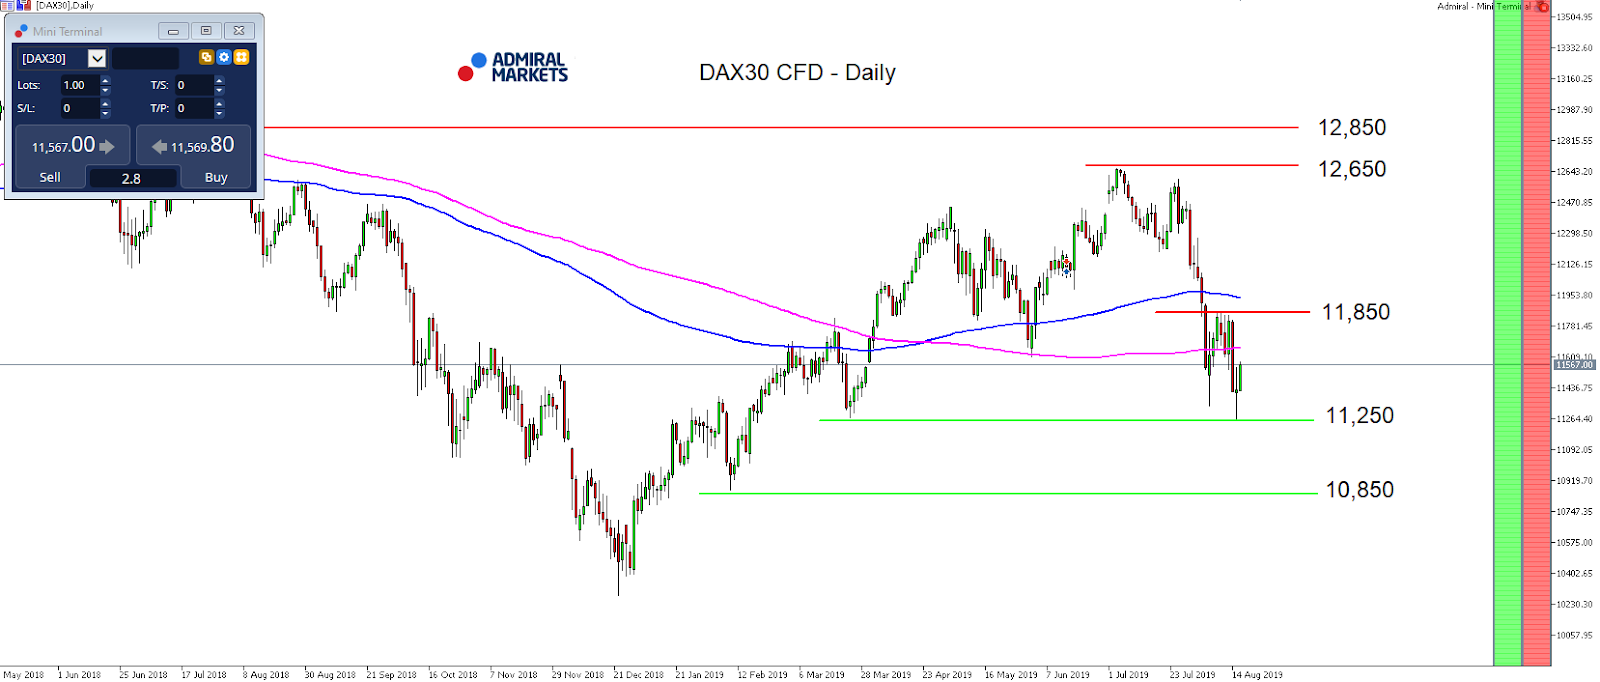
Technically, the main focus in the DAX30 CFD can be found around 11,550 points on the upside where a break higher would trigger further bullish respectively corrective momentum, activating 11,850 points as a potential target.
On the other hand, failing to recapture 11,550 could trigger another bearish stint down to the pre-weekly lows around 11,250 points, especially if we drop back below 11,400 points:
Source: Admiral Markets MT5 with MT5-SE Add-on DAX30 CFD Hourly chart (between July 30, 2019, to August 16, 2019). Accessed: August 16, 2019, at 10:00pm GMT
Source: Admiral Markets MT5 with MT5-SE Add-on DAX30 CFD Daily chart (between May 18, 2018, to August 16, 2019). Accessed: August 16, 2019, at 10:00pm GMT – Please note: Past performance is not a reliable indicator of future results, or future performance.
In 2014, the value of the DAX30 CFD increased by 2.65%, in 2015, it increased by 9.56%, in 2016, it increased by 6.87%, in 2017, it increased by 12.51%, in 2018, it fell by 18.26%, meaning that after five years, it was up by 10.5%.
Discover the world’s #1 multi-asset platform
Admiral Markets offers professional traders the ability to trade with a custom, upgraded version of MetaTrader 5, allowing you to experience trading at a significantly higher, more rewarding level. Experience benefits such as the addition of the Market Heat Map, so you can compare various currency pairs to see which ones might be lucrative investments, access real-time trading data, and so much more. Click the banner below to start your FREE download of MT5 Supreme Edition!
Disclaimer: The given data provides additional information regarding all analysis, estimates, prognosis, forecasts or other similar assessments or information (hereinafter “Analysis”) published on the website of Admiral Markets. Before making any investment decisions please pay close attention to the following:
This is a marketing communication. The analysis is published for informative purposes only and are in no way to be construed as investment advice or recommendation. It has not been prepared in accordance with legal requirements designed to promote the independence of investment research, and that it is not subject to any prohibition on dealing ahead of the dissemination of investment research.
Any investment decision is made by each client alone whereas Admiral Markets shall not be responsible for any loss or damage arising from any such decision, whether or not based on the Analysis.
Each of the Analysis is prepared by an independent analyst (Jens Klatt, Professional Trader and Analyst, hereinafter “Author”) based on the Author’s personal estimations.
To ensure that the interests of the clients would be protected and objectivity of the Analysis would not be damaged Admiral Markets has established relevant internal procedures for prevention and management of conflicts of interest.
Whilst every reasonable effort is taken to ensure that all sources of the Analysis are reliable and that all information is presented, as much as possible, in an understandable, timely, precise and complete manner, Admiral Markets does not guarantee the accuracy or completeness of any information contained within the Analysis. The presented figures refer that refer to any past performance is not a reliable indicator of future results.
The contents of the Analysis should not be construed as an express or implied promise, guarantee or implication by Admiral Markets that the client shall profit from the strategies therein or that losses in connection therewith may or shall be limited.
Any kind of previous or modeled performance of financial instruments indicated within the Publication should not be construed as an express or implied promise, guarantee or implication by Admiral Markets for any future performance. The value of the financial instrument may both increase and decrease and the preservation of the asset value is not guaranteed.
The projections included in the Analysis may be subject to additional fees, taxes or other charges, depending on the subject of the Publication. The price list applicable to the services provided by Admiral Markets is publicly available from the website of Admiral Markets.
Leveraged products (including contracts for difference) are speculative in nature and may result in losses or profit. Before you start trading, you should make sure that you understand all the risks.
The US dollar is changing slightly against a basket of major currencies. Today, on August 19, licenses for US companies for business cooperation with Huawei expire. However, US President Donald Trump has not yet decided whether to renew the license or not. US-China trade relations are still tense. On Friday, The National Development and Reform Commission of the People’s Republic of China said that China would implement a program to stimulate incomings growth in order to avoid a slowdown in economic growth. The US dollar index (#DX) closed the trading session with a slight increase (+0.19%).
Also, optimistic economic data from the US were published on Friday. So, the number of building permits issued in the US rose to 1,336M in July, while experts expected 1,270M. The US currency was supported by the fact that the 10-year US government bonds yield finally moved away from local lows on Friday.
The euro is still under pressure after weak economic reports published last week. Today, we expect the publication of the consumer price index in the Eurozone.
The “black gold” prices show positive dynamics. At the moment, futures for the WTI crude oil futures are testing the $55.25 mark per barrel.
Market Indicators
On Friday, the bullish sentiment was observed in the US stock markets: #SPY (+1.48%), #DIA (+0.98%), #QQQ (+1.61%).
The 10-year US government bonds yield has been growing. At the moment, the indicator is at the level of 1.60-1.61%.
The news feed for 2019.08.19:
– Consumer price index in the Eurozone at 12:00 (GMT+3:00).
Most of the majors declined against the US dollar last week. The biggest loser was the euro. The only currency to gain ground was the pound. Movements on the EURGBP cross favoured the pound, giving us a divergence between some pairs with a positive correlation.
On Friday the 16th of August, the EURUSD pair dropped to 1.1065. Following disappointing US data, the pair recovered to 1.1107. At the latest reading, the Michigan consumer sentiment index in August dropped to 92.1 points, against the final revised value of 98.4 for July (forecast: 98.5).
Minneapolis Fed President Kashkari also made his mark on the dollar when he said that the regulator would most likely have to lower interest rates to combat the economic slowdown.
Day’s news (GMT+3):
11:00 Eurozone: current account (Jun).
12:00 Eurozone: CPI (Jul).
Current situation:
Trading in today’s Asian session has been relatively quiet if we discount oil prices. Brent oil has jumped 1.4% to 59.35 USD per barrel. The increased appetite for risk was triggered by comments by Donald Trump and Larry Kudlow that they don’t believe the US economy will go into recession. China’s national bank has announced measures designed to allow free-floating exchange rates through regulating interest rates.
The euro has recovered to 1.1105. We expect the pair to rise to the 45th degree drawn from the 1.1065 low. The euro came under pressure on Friday after a drop on the EURGBP cross. The drop was halted by the 135th degree. Now it would be good to see a rise on the euro. Following the price drop within a complex wave structure, the minimum target for the euro now is the 67th degree.
Traders will now be turning their attention towards the FOMC minutes on Wednesday and commentary coming from the Jackson Hole symposium on Thursday and Friday.
This week – August 18 through August 24 – central banks from 5 countries or jurisdictions are scheduled to decide on monetary policy: Zambia, Paraguay, Indonesia, Egypt and Sri Lanka.
Many central bankers, economists and academics will also be in the small U.S. city of Jackson Hole, Wyoming, to attend the Kansas City Fed’s annual economic symposium from Aug. 22 to Aug. 24. The theme of this year’s symposium, a decade after the global financial crises, is “Challenges for Monetary Policy,” with Federal Reserve Chairman Jerome Powell scheduled to speak on Aug. 23.
Following table includes the name of the country, the date of the next policy decision, the current policy rate, the result of the last policy decision, the change in the policy rate year to date, and the rate one year ago.
The table is updated when the latest decisions are announced and can always accessed by clicking on This Week.
The European currency got under more significant pressure last week and reminded market players that European problems may be much more complicated than meets the eye.
Right now, the major currency pair is trading close to three weeks’ lows but may test the bottom at 1.1025 reached on August 1st.
The Euro might have plunged ever more, but was surprisingly “saved” by Der Spiegel, a German weekly news magazine, which wrote that the German government was ready to settle for the budget deficit if the country’s economy started falling into a recession. This was pretty unexpected and unusual because Angela Merkel and the German Federal Ministry of Finance have been famous for their tough stance against any economic incentives related to budget and tax policies. Market players were really surprised, thus helping the European currency to recover a little bit.
Before that, Germany reported on the GDP, which lost 0.1% q/q in the second quarter of 2019. This was quite negative for the GDP of the Euro Area, which added only 0.2% q/q over the same period of time after being much better in the quarter before.
On H4 EURUSD has formed a figure of the downtrend continuation. The centre of the structure is explicit around 1.1130. The minimum of the figure at 1.1090 is broken away. There is a potential for the continuation of the third declining wave to 1.1010. The goal is local. After that, a correction to 1.1070 may happen, followed by a decline to 1.0980.
Technically, the scenario is confirmed by the MACD oscillator. Its signal line is trading below 0, strictly for a decline, remaining in the histogram zone, all this suggesting a further downtrend.
On H1, EURUSD is trading in the second half of the third wave of decline. At the moment, the market has completed an impulse downwards and its correction. It may then decline to 1.1070. Upon breaking this level top-down, there will appear a potential for reaching 1.1033. After that a correction to 1.1070, followed by a decline to 1.0980, is not excluded. The goal is main.
The scenario is confirmed by the Stochastic. Its signal line is trading strictly for a decline. Upon a breakaway of 50 the trend may become stronger.
Disclaimer
Any predictions contained herein are based on the authors’ particular opinion. This analysis shall not be treated as trading advice. RoboForex shall not be held liable for the results of the trades arising from relying upon trading recommendations and reviews contained herein.