This event, its implications and near-term catalysts are discussed in a Pareto Securities report.
In an Aug. 14, 2019 research note, Pareto Securities analyst Tom Erik Kristiansen reported that Eco Atlantic Oil & Gas Ltd. (EOG:TSX.V; ECAOF:OTCMKTS; ECO:LSE) discovered its first oil at Jethro-1 on the Orinduik block in offshore Guyana and as such, Pareto increased its target price on the company to GBp170 per share from GBp120 (Eco Atlantic’s current share price is about GBp117).
Kristiansen pointed out the benefits of the Jethro-1 success, which he described as a “company making event.” For one, the discovery further derisks any subsequent targets on the block, including Joe, which is expected to spud soon and has “a relatively high geological chance of success,” he wrote. Two, it makes Eco Atlantic an attractive acquisition target.
Also positive for the oil/gas company is its “substantial exploration resource inventory,” highlighted Kristiansen. Unrisked gross recoverable resources for Orinduik’s tertiary fairway are an estimated 740 million barrels (740 MMbbl) and from the deeper Cretaceous targets, about 2.8 billion. These represent an aggregate resource base net to Eco of about 530 MMbbl with its 15% working interest.
Further, the company looks forward to yet another potential stock moving event later this year, in addition to Joe, Kristiansen noted. That is drilling of the Carapa-1 well on a nearby block, targeting the Cretaceous section.
Disclosure: 1) Doresa Banning compiled this article for Streetwise Reports LLC and provides services to Streetwise Reports as an independent contractor. She or members of her household own securities of the following companies mentioned in the article: None. She or members of her household are paid by the following companies mentioned in this article: None. 2) The following companies mentioned in this article are billboard sponsors of Streetwise Reports: None. Click here for important disclosures about sponsor fees. 3) Comments and opinions expressed are those of the specific experts and not of Streetwise Reports or its officers. The information provided above is for informational purposes only and is not a recommendation to buy or sell any security. 4) The article does not constitute investment advice. Each reader is encouraged to consult with his or her individual financial professional and any action a reader takes as a result of information presented here is his or her own responsibility. By opening this page, each reader accepts and agrees to Streetwise Reports’ terms of use and full legal disclaimer. This article is not a solicitation for investment. Streetwise Reports does not render general or specific investment advice and the information on Streetwise Reports should not be considered a recommendation to buy or sell any security. Streetwise Reports does not endorse or recommend the business, products, services or securities of any company mentioned on Streetwise Reports. 5) From time to time, Streetwise Reports LLC and its directors, officers, employees or members of their families, as well as persons interviewed for articles and interviews on the site, may have a long or short position in securities mentioned. Directors, officers, employees or members of their immediate families are prohibited from making purchases and/or sales of those securities in the open market or otherwise from the time of the interview or the decision to write an article until three business days after the publication of the interview or article. The foregoing prohibition does not apply to articles that in substance only restate previously published company releases.
Disclosures from Pareto Securities AS, Eco Atlantic Oil & Gas, August 14, 2019
This publication or report has been prepared solely by Pareto Securities Research.
Opinions or suggestions from Pareto Securities Research may deviate from recommendations or opinions presented by other departments or companies in the Pareto Securities Group. The reason may typically be the result of differing time horizons, methodologies, contexts or other factors.
Analysts Certification The research analyst(s) whose name(s) appear on research reports prepared by Pareto Securities Research certify that: (i) all of the views expressed in the research report accurately reflect their personal views about the subject security or issuer, and (ii) no part of the research analysts compensation was, is, or will be directly or indirectly related to the specific recommendations or views expressed by the research analysts in research reports that are prepared by Pareto Securities Research.
The research analysts whose names appears on research reports prepared by Pareto Securities Research received compensation that is based upon various factors including Pareto Securities total revenues, a portion of which are generated by Pareto Securities investment banking activities.
Conflicts of interest
Companies in the Pareto Securities Group, affiliates or staff of companies in the Pareto Securities Group, may perform services for, solicit business from, make a market in, hold long or short positions in, or otherwise be interested in the investments (including derivatives) of any company mentioned in the publication or report.
In addition Pareto Securities Group, or affiliates, may from time to time have a broking, advisory or other relationship with a company which is the subject of or referred to in the relevant Research, including acting as that companys official or sponsoring broker and providing corporate finance or other financial services. It is the policy of Pareto to seek to act as corporate adviser or broker to some of the companies which are covered by Pareto Securities Research. Accordingly companies covered in any Research may be the subject of marketing initiatives by the Corporate Finance Department.
To limit possible conflicts of interest and counter the abuse of inside knowledge, the analysts of Pareto Securities Research are subject to internal rules on sound ethical conduct, the management of inside information, handling of unpublished research material, contact with other units of the Group Companies and personal account dealing. The internal rules have been prepared in accordance with applicable legislation and relevant industry standards. The object of the internal rules is for example to ensure that no analyst will abuse or cause others to abuse confidential information. It is the policy of Pareto Securities Research that no link exists between revenues from capital markets activities and individual analyst remuneration. The Group Companies are members of national stockbrokers associations in each of the countries in which the Group Companies have their head offices. Internal rules have been developed in accordance with recommendations issued by the stockbrokers associations.
This material has been prepared following the Pareto Securities Conflict of Interest Policy. The guidelines in the policy include rules and measures aimed at achieving a sufficient degree of independence between various departments, business areas and sub-business areas within the Pareto Securities Group in order to, as far as possible, avoid conflicts of interest from arising between such departments, business areas and sub-business areas as well as their customers. One purpose of such measures is to restrict the flow of information between certain business areas and sub-business areas within the Pareto Securities Group, where conflicts of interest may arise and to safeguard the impartialness of the employees. For example, the Corporate Finance departments and certain other departments included in the Pareto Securities Group are surrounded by arrangements, so-called Chinese Walls, to restrict the flows of sensitive information from such departments. The internal guidelines also include, without limitation, rules aimed at securing the impartialness of, e.g., analysts working in the Pareto Securities Research departments, restrictions with regard to the remuneration paid to such analysts, requirements with respect to the independence of analysts from other departments within the Pareto Securities Group rules concerning contacts with covered companies and rules concerning personal account trading carried out by analysts.
Pareto Securities AS may have prepared or distributed investment recommendation, where Pareto Securities AS has been lead manager/co-lead manager or have rendered publicly known not immaterial investment banking services over the previous 12 months: Eco Atlantic Oil & Gas.
Pareto Securities AS may hold financial instruments in companies where a recommendation has been produced or distributed by Pareto Securities AS in connection with rendering investment services, including Market Making.
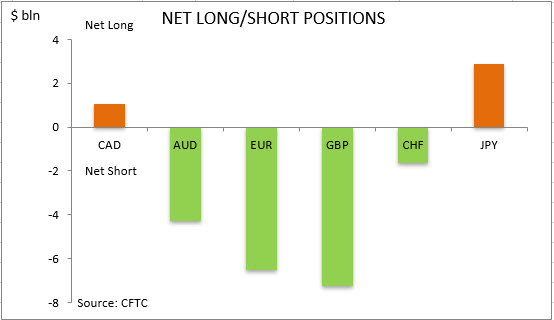
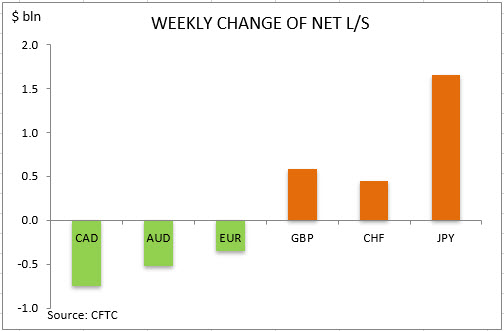
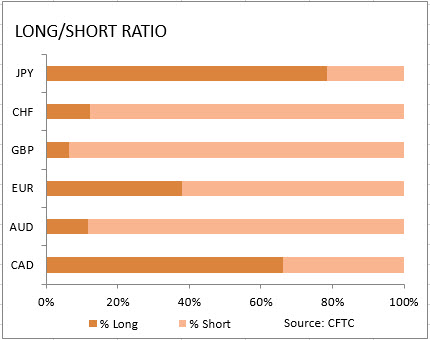
US dollar bullish bets declined to $15.70 billion from $16.77 billion against the major currencies during the one week period, according to the report of the Commodity Futures Trading Commission (CFTC) covering data up to August 13 and released on Friday August 16. The dollar strengthening continued as inflation in July over the past 12 months climbed to 1.8% from 1.6% in June, and US Trade Representative announced delays for 10% tariffs earlier announced by President Trump on August 1 on Chinese goods worth $152 billion until mid-December.
Note: This overview has an informative and tutorial character and is published for free. All the data, included in the overview, are received from public sources, recognized as more or less reliable. Moreover, there is no guarantee that the indicated information is full and precise. Overviews are not updated. The whole information in each overview, including opinion, indicators, charts and anything else, is provided only for familiarization purposes and is not financial advice or а recommendation. The whole text and its any part, as well as the charts cannot be considered as an offer to make a deal with any asset. IFC Markets and its employees under any circumstances are not liable for any action taken by someone else during or after reading the overview.
Our August 19 breakdown prediction from months ago has really taken root with many of our followers and readers. We’ve been getting emails and messages from hundreds of our followers asking for updates regarding this prediction. Well, here is the last update before the August 19th date (tomorrow) and we hope you have been taking our research to heart.
First, we believe the August 19 breakdown date will be the start of something that could last for more than 5 to 12+ months. So, please understand that our predicted date is not a make-or-break type of scenario for traders. It means that we believe this date, based on our cycle research, will become a critical inflection point in price that may lead to bigger price swings, more volatility and some type of market breakdown event. Thus, if you have already prepared for this event – perfect. If this is the first time you are reading about our August 19 breakdown prediction, then we suggest you take a bit of time to review the following research posts.
Originally, our research team identified July 2019 as a market top potential back in April/May 2019. Later, our research team updated our analysis to include the August 19 breakdown date prediction based on our advanced predictive modeling tools and cycle analysis tools. This became a critical event in the minds of our research team because it aligned with much of our other predictive research and aligned perfectly with what we were seeing in the charts as we neared the Summer.
The top prediction for July 2019 by our research team became true as we entered early August. This confirmation of our research and prediction back in April/May helped to solidify our belief that our August 19th breakdown prediction would likely become valid as well. Whenever we make a prediction many months in advance, one has to understand that we are using our predictive analysis tools to suggest what price “wants” to try to do in the future. External events can alter the price level by many factors to create what we call a “price anomaly”. When the external events and price predictive outcomes align as they have been doing over the past 4+ months, it lends quite a bit of credibility to our earlier predictive research.
In other words, we couldn’t be happier that our research team has been able to deliver incredible insight and analysis regarding the global markets and how the price will react over the past 4+ months. This is something no other investment research firm on the planet is capable of doing with any degree of accuracy right now. In fact, it is amazing to us that we’ll read some research post by a multi-national investment firm that may suggest something now that we’ve alerted our followers to 90 days earlier.
Now, onto some new details about the August 19th breakdown event…
First, be very cautious about investing in Cryptos throughout this event. The initial move, if our research continues to play out, maybe an upside rally in BitCoin based on fear as the global markets start a breakdown process. But we believe this move in Cryptos will be very short-lived as our current research suggests central banks, governments, and other institutions are getting ready to pounce on unregulated Crypto Currencies. It is our belief that the breakdown event will possibly push Bitcoin higher on a “move to safety” rotation. But once Bitcoin investors understand that governments and institutions are targeting these digital currency exchanges as criminal enterprises that threaten central banks and that there is no real safety in putting capital into a digital enterprise that can be shut down in minutes, we believe a rush to the exits will begin to take place.
We believe the shift to real physical assets will take place as a shift in asset valuations continues to take place. We believe the downside risk in Bitcoin is currently at least 30 to 40% from current values. Our initial downside target is a level near $5570 for Bitcoin with potential for price support near $7900.
Daily Bitcoin Chart
This Daily Bitcoin chart highlights arrows that we drew in mid-July based on our expectations for future price rotation. You can see that price, for the most part, followed our expectations and stayed within the Fibonacci price channel, near the lower price levels, while navigating the MAGENTA Fibonacci price amplitude arc (across the tops in price) as it moved towards our August 19th breakdown date. It is critical to understand that price will attempt to either establish new price highs or new price lows based on Fibonacci price theory. It is our belief that an upside rally towards the $11,300 level will be the “last rally” before a breakdown price trend pushes Bitcoin much lower. This is likely the reaction of the “flight to safety” that we suggested earlier.
Weekly Bitcoin Chart
This Weekly Bitcoin chart provides a broader picture of the same event and how it will likely play out in the near future. Remember, initially, global investors will attempt to pike into anything that is quick, easy and efficient to protect against perceived capital risks. We are certain that some investors will attempt to pile into Cryptos as the breakdown event starts. The question is, will this transition of capital stay safe long enough for investors to capitalize on the move? We don’t believe so based on our research.
If the price of Cryptos breaks through that Magenta Fibonacci price amplitude arc and initiates a move to new higher highs, then we’ll have to rethink our analysis. But for right now, we are sticking to our belief that Cryptos will see an impulse rally that will quickly be followed by a breakdown event (likely the result of some government intervention or broader risk event).
Weekly S&P 500 Chart
This Weekly S&P 500 chart highlights what we believe is the most likely immediate price trend related to the October 2018 price decline. If a downside price move does initiate as we expect because of the August 19 breakdown inflection point, we believe the S&P will target immediate support above $2400. If you’ve followed any of our research, you already understand we believe the move dynamic economies on the planet are uniquely situated to actually benefit from this downside price event. Therefore, we must understand that a “price exploration event”, like this, is a mechanism for investors to seek out true value levels for global assets. All major price corrections are, in essence, a process of seeking out price levels where investors believe “true value” exists.
NASDAQ Weekly Transportation Index
The NASDAQ Transportation Index paints a very clear picture for our research team. In fact, we find the TRAN particularly useful in our research of the global and US markets. Even though we follow dozens of symbols and instruments, one of our key objectives is to attempt to validate our analysis across multiple instruments/charts and to attempt to identify faults in our expected outcomes.
The recent downside price move in the TRAN aligns perfectly with our August 19 breakdown expectation. It is very likely that some news or pricing event over the next 7+ days pushes the TRAN below the RED price channel and downward towards the middle Standard Deviation level near $3900. Once the TRAN breaks the RED support level, you should expect the US and global markets to also begin a broader move lower.
Ideally, the $3500 level should operate as a moderately hard price floor for this downside move. $3900 would be considered the initial target of the downside price move whereas $3500 would be considered the initial “hard floor” support level. Given these expectations, we have to consider the potential for a -15% to -25% initial downside price move in TRAN which would translate into a -18% to -35% downside price move in the S&P or NASDAQ.
CONCLUDING THOUGHTS:
In closing, August 19th is tomorrow (Monday). This is where we’ll find out if our prediction will be viewed in the future as accurate or not. The one thing about making public predictions for many months in advance is that you can’t go back and try to lie to your followers/readers. Either it works out as we suggested or it does not. We believe in the skills of our research team and predictive modeling systems. We’ve seen how accurate they have been in the past and we believe we’ve delivered top-tier analysis to all of our followers and readers. In fact, we know you can’t find anything like this type of research from other investment or research firms.
Over the next 10 to 30+ days, we’ll be able to look back at our August 19th prediction and say “we were right” or “we were wrong” – that is part of trading, folks. You use your best tools to make an educated assessment of current and future expectations, then act on it (if you want). We’ll follow up on the other side of August 19th with all of you.
Stay fluid as this event plays out, and most importantly, know that we don’t blindly trade on predictions, we use our short-term technical analysis and current market trends to enter and exit trades. The reality is, no matter if the markets roll over and crash or rocket higher, we will follow and trade with the market. The best thing about being technical traders is we don’t care which way the markets go. We just analyze and trade with the current market trend and make money in both directions and at the drop of a hat!.
If you want to trade and invest without the stress of a pending market collapse or missing out on another extended rally to new highs then join my Wealth Building Newsletter today and copy my proven technical trading setups and trade with me!
Fears over the impact of a “no-deal” Brexit have risen again following the leaked “Yellowhammer” document which details government concerns around the potential fallout of a no-deal Brexit. Here are the top ten takeaways from the report.
Leaving Date
The report details that the current October 31st (Halloween) leaving date is “not to our advantage”.
The date falls on a Thursday. This means that the bank would have to implement changes overnight, instead of being able to do it over a weekend. Furthermore, as the next day is the end of the UK half term, it means that many families will be returning from abroad, creating extra traffic at borders.
Channel Ports
The document projects that major disruption at channel ports could last as long as 90 days following the Brexit date. It showed that up to 85% of lorries “may not be ready” for French customs. The report also states that in a “reasonable worst-case scenario”, the disruption could cause delays of up to 2.5 days for heavy goods vehicles which could have a significant impact on perishable goods. France has confirmed that it will apply mandatory EU controls immediately following Brexit.
Medicines
Yellowhammer suggests that the supply of medicines to the UK could be heavily impacted. Thereport stated that it won’t “be practical to stockpile products to cover the expected delays of up to six months”. Additionally, the report shows that it could be more difficult “to prevent and control disease outbreak”.
Financial Services
The report notes that “some UK cross-border financial services will be disrupted”. It claimed that banks and other institutions will need to switch to new systems for reporting transactions midweek. Additionally, the risk of a large drop in GBP could also impact main financial services firms.
Petrol Supplies
Yellowhammer outlines that two UK oil refineries might be “inadvertently” put out of government. This is due to government plans to set the majority of import tariffs at 0% following a no-deal Brexit. Such an outcome could results in a loss of around 2000 jobs, raising the risk of protests and strikes which could impact supply in some areas.
Northern Ireland
The report also notes concerns over the border issue with Northern Ireland. It claims that measures to avoid a hard border are likely “unsustainable”. The document says that measures to “avoid an immediate risk of a return to a hard border on the UK side” are “likely to prove unsustainable because of significant economic, legal and biosecurity risks and no effective mitigations to address this will be available”.
Energy costs
Furthermore, the report notes that the people of Northern Ireland face “significant” energy price increases. This is due to a severe “split” in the single electricity market which was put in place following the Good Friday Agreement.
Riots
Worryingly, the report also highlights the potential for mass protests and the threat of riots as a result of “the shock of a no-deal departure”. Police chiefs have been in months of consultation, preparing plans on how to deal with “a rise in public disorder and community tensions” in the event of a no-deal Brexit.
Social Care
The Yellowhammer report says that the country’s social care system which is already “fragile”, could be hit hard by increased costs. The report notes that a jump in inflation could see some providers going bankrupt by soon as New Year 2020.
Gibraltar
The leaked document highlights that the supply of goods such as foods and medicines to, as well as shipments of waste from, the UK controlled Gibraltar, could be impacted by Spanish customs checks at the border. Around 15,000 workers cross the border between Spain and Gibraltar each day. They could face massive delays of up to four hours for up to a “few months” which could “adversely impact Gibraltar’s economy”.
Technical Perspective
With Brexit uncertainty keeping investor sentiment subdued, GBPUSD is back under pressure today. Price is still hugging the lower line of the bearish channel which has framed price action over the year. For now, GBPUSD is still above the 1.20 lows though while below the 1.2382 level, focus is on further losses.
There is a very common and frustrating phenomenon when a budding trader switches from trading a demo to a live account. Their carefully planned trades and tactics suddenly don’t appear to work!
Or at least not work as well as they had been with the demo. It’s possible that your trading improves when moving from a demo to a live account. However, this is rare, and usually isn’t something that leads new traders to scour the internet in search of an explanation for.
When moving from a demo to a live account produces worse results, many traders will often blame the broker and think they are being cheated. While that might be the case for disreputable brokers, this phenomenon is incredibly common and happens with the most known and trusted brokers as well. So let’s take a look at the “why”!
Why Does it Happen?
There are a lot of small factors, but broadly speaking, two major issues cause a difference in the results between a demo (or backtesting) and a live account. Both have their own difficulties to fix.
The first is probably one you don’t like to think about: it has to do with the way you think.
When you are trading in a demo, you feel a lot more confident because no real money is on the line. If your strategy doesn’t work out, you just develop a new one.
But, with live trading, not only is money on the line but so is the time, research and work you’ve poured into your strategy. This makes traders more hesitant to open trades, and more unwilling to close losing trades. Over time, this adds up enough so an otherwise winning trading strategy no longer works.
It’s Fixable, Of Course
The first step to fixing an issue is to acknowledge that a problem exists. And, often traders are unwilling to accept that they are thinking differently when there is real money on the line.
One of the ways to “prove” this to yourself is to set aside a certain amount of money you are perfectly willing to “lose” while trading. If your trading improves once you’ve lost the worry about having bad trades, then your psychology was getting in the way.
Another way to do this is to try trading with smaller lots for a day or week, and see if your trading results improve. Smaller trade size implies less of a risk, which helps overcome some of the need-to-succeed pressure in trading.
The Fix?
Time is often the best way to build confidence in your trading. Spend more time on your demo account, or adjust your trade sizes so that you trade in line with your strategy. Or, develop a strategy that implies less risk, but is ultimately more profitable because you are more comfortable sticking to the strategy.
Keeping a record of your trading, both in demo accounts and in a live account, can help you find differences in your forex trading habits, then correct for them.
When you were trading with a demo account, did you trade more often? Or now that you have a live account, are you entering more trades to “win back” the trades that didn’t work out? Is “revenge trading” part of your strategy? No? Then you should probably stick to your strategy…
But What If it’s Not Trading Psychology?
There are also properties of the trading environment that result in differences between a backtesting session and live trading. It should be noted, though, that often, people will focus on other factors in an effort to not have to address the psychology of trading issue. This is because it can be quite uncomfortable to think about.
Thing is, if you put two robots (EAs) to trade a demo account in parallel with a live account, they’ll come out with different results. The same goes for if you had an EA trade for a while, and then have the exact same EA backtest the exact same time period.
How Does This Happen?
There are several technical factors that can fill a medium-size book. But, in general, there is “noise” in the market. At any given time there can be tens of thousands to millions of trades being executed in a single second. This leads to a certain amount of randomness in trade matching, and that’s what leads to “slippage”.
The thing is, generally when the slippage is in our favor, we don’t notice it. But when it’s not? That’s a different story. This leads to a bias in perception that trading is “worse” in a live account, instead of seeing trading as “better” in the demo account.
The “fix” here really isn’t in changing platforms, but in designing your trading around the core idea that profitability in the markets is due more to probability than precision. When you backtest, you’re not trying to find out exactly how many pips it will produce, but whether it will produce more or less winning trades. Your aim as a trader isn’t to achieve a precise number of pips, but to develop a strategy that statistically leads to an increased probability of profit.
Hopefully, with these two concepts, you can tweak your trading in live accounts to be a lot more profitable.
The increase in US natural gas reserves over the week was less than expected. Will the NATGAS quotations grow?
According to U.S. Energy Information Administration (EIA), gas reserves for the week increased by 49 billion cubic feet with a forecast of 58 billion. As a result, gas reserves amounted to 2.738 trillion cubic feet, which is 3.9% lower than their average over the past 5 years. According to the EIA, over the past 12 months, total US gas supply has increased by 6% and total demand by 4.6%. The discrepancy is not very large, but at the same time, natural gas quotes are now a quarter lower than last year. They are near multi-year lows. Gas demand may increase amid large-scale plans to increase US exports of liquefied natural gas (LNG). Compared to last year, LNG deliveries abroad have already increased by 11%. US natural gas production is now at a historic high, but there is a risk of its decline. According to Baker Hughes, the number of operating drilling rigs in gas production in the United States has declined to a minimum since 2017 and amounted to 165 units.
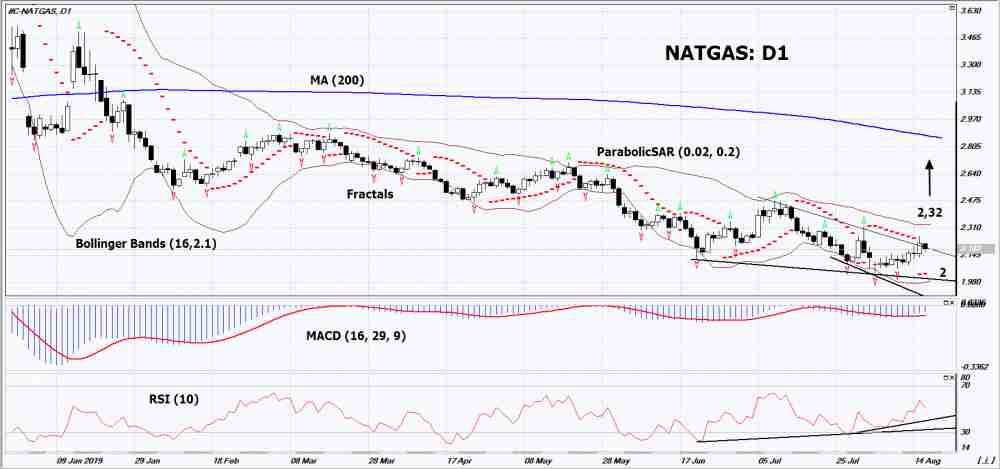
On the daily timeframe Natgas: D1 has broken up the resistance line of the downtrend and is adjusted up. Various technical analysis indicators have generated signals to increase. Further growth of quotations is possible in case of increased demand in the US and the massive closure of short positions.
The Parabolic indicator demonstrates a signal to increase.
The Bolinger bands narrowed, indicating a volatility decrease. Both Bollinger Lines Slope Up.
The RSI indicator is above the 50 mark. It has formed a divergence to increase.
The bullish momentum may develop if Natgas exceeds its last upper fractal and the upper Bollinger line: 2.32. This level can be used as an entry point. The initial stop lose may be placed below the last two lower fractals, the lower Bollinger line, the minimum since April 2016 and the Parabolic signal: 2. After opening a pending order, the stop shall be moved following the Bollinger and Parabolic signals to the next fractal minimum. Thus, we are changing the potential profit/loss to the breakeven point. More risk-averse traders may switch to the 4-hour chart after the trade and place a stop loss moving it in the direction of the trade. If the price meets the stop level (2) without reaching the order (2,32), we recommend to cancel the order: the market sustains internal changes that were not taken into account.
Bob Moriarty of 321 Gold makes available the first two chapters of his most recent book that delve into the current state of the economy.
After being bugged unmercifully by a couple of my so-called friends, I finally sat down in early January to write a tome about investing in resource stocks. It took me sixteen days to write. And another four weeks to get the cover and layout right. I had some important charts in it that couldn’t be shrunk and still understood.
A couple of days ago I was reaching for a quote that I thought I remembered from the book so I picked up one of my test copies.
I read through the first two chapters and thought to myself, “Damn, this guy got it exactly right.” That was before I realized I was the person who wrote it eight months ago.
One of the great advantages of getting old, other than just getting old, after all the alternative is far worse One of the benefits of getting old is that you get to hide your own Easter eggs. That is if you can still remember when Easter is.
I never did find the quote. But I did realize that what I wrote in January could have been written twenty minutes ago and not be more timely. So I thought it would be a nice idea to share it with you. This isn’t a sale pitch. If you have read the book you, too, will have already read it but have forgotten. If you haven’t and think it might be worth finishing, you are just going to have to figure out how to buy it by yourself.
These two chapters can be read in ten to fifteen minutes. This could be the most important thing you read this year. Or any.
Chapter 1: State of the Financial Union
ON AUGUST 15, 1971, President Richard Nixon broke gold’s last tie to the world’s financial system. The dollar went from being as good as gold to being as good as paper, literally overnight. Since that time governments of all sorts have engaged in a frenzy of printing and spending money they didn’t have. It was as if Nixon granted the world an unlimited supply of paper and ink and told them it was possible to print wealth out of thin air.
To spend now reduces our ability to make future purchases. Borrowing in order to spend now does nothing more than bring consumption forward and lays a burden of debt on future generations. True prosperity never comes from consumption but rather from saving for an unknowable future. When you have already spent your own future, it’s foolish. When you have spent the futures of your children and grandchildren, it’s criminal. Thomas Jefferson said, “It is incumbent on every generation to pay its own debts as it goes.”
In the developed world today, when children are born the government handcuffs them with a debt burden they may never shed. Governments of all sizes and colors are forcing investors into making an important decision about their future. Each of us must decide. Do you want to be rich or do you want to be poor?
Stable civilizations are best measured by the size of their middle class. Every society has had rich and has had poor. That has been true forever, no matter where the country was located, or when. But as overall wealth grew, primarily due to the benefit of easy use of money and eventually nearly free energy, civilization grew and spread. But it remains accurate to say some will always be poor and others will always be wealthy. What matters most is the stability of government, and that mostly depends on the size of the middle class.
When governments declare war on the middle class, they are declaring war on themselves. Eventually the newly poor begin to envy the newly rich, and a revolution begins.
In any normal, rational time, investing in resource stocks would be the act of a gambler who hones his skills on the craps tables in Vegas and buys a handful of cheap lottery tickets on the way home from the bar in the faint hope of collecting a multimillion-dollar payoff.
It’s been my experience that resource companies are often run by idiots pretending to be managers who live the good life while sucking the financial blood out of the veins of helpless investors. It’s a dangerous business, where failure is the norm. Share prices run up and down faster than a bride’s nightie. I’ve run into charlatans, con men and fools. I’ve visited hundreds of mining properties and I’ve been lied to on almost every trip.
I find that wonderful, being lied to maybe 75 percent of the time. I used to be in the computer business. There I got lied to 100 percent of the time. So the liars in mining are at best amateurs in comparison.
But these are not rational or normal times, and investing in resource shares may be the only logical investment for those looking to hedge other potentially more dangerous alternatives. Remember, it was only a little over a year ago that every punter and his grandmother were tossing pesos into what I call the Bitcon pool. I passed on the whole madness, seeing it as nothing more than a variation of an electronic Beanie Baby.
At one point in late 2017 the total value of the 1,300 varieties of Bitcon amounted to over $800 billion. As of January 2019 the number of Bitcon look-alikes is up to 2,533 but the combined net worth of all of them is down to $136,368,981,000, roughly.
That means $663 billion flew off to Bitcon heaven. We were told to buy Bitcon in all its varieties because it was limited in supply. Nothing with 2,533 variations is limited or rare.
The United States Federal Government is adding to the national debt at a rate unparalleled in history. One day very soon those 2,533 variations of Bitcon may well seem a lot more logical than the debt of the US government.
When you look up and see what seems to be a layer of dark and foreboding clouds, it may well be nothing more than a bevy or wedge of black swans. No one can say just which black swan will land first, but it’s an easy prediction that with so many black swans circling, at least one is bound to be wheels-down soon. When that happens, The Great Reset begins.
Chapter 2: The Great Reset
I READ THAT the total debt in the world today is in the neighborhood of $250 trillion. To me, and I suspect to most readers, the number is so large as to be meaningless. To put it in better perspective, we could perhaps compare it to the world’s yearly production of goods and services, estimated to be in the vicinity of $90 trillion. Now those two figures do not provide a complete picture, only a relative number.
Let’s use two smaller numbers, but with the same ratio. If you owe $35,000 but have an income of $12,600 a year, you have a debt problem. Now multiply that by every person on earth: young, old, infirm, all of the 7.7 billion breathing today. The level of debt in many countries is higher than at any point in history. We know that countries go broke regularly and always have done.
That’s in an environment of zero or negative interest rates. Now that becomes insane. If corporations and governments can’t maintain a reasonable balance between income and outgo with negative interest rates, just how do they expect to cope with normal historic interest rates?
When I was going to college in the early 1970s, I majored in economics. I was at both Columbia in New York City and Iona College in New Rochelle. I worked all day and attended night school. Being in and around New York City, both schools attracted top-notch economics professors from Wall Street. I learned a lot mostly to ignore conventional economics and Keynesian theory.
If I would have submitted a paper even suggesting the possibility of negative interest rates, I not only would have flunked the course, I would have been ejected from the classroom.
“Negative interest rates, you say? Have you lost your cotton-picking mind? Out!”
“Now! Out! Get out of my classroom, you moron.”
Today you can read every day about what a great idea it is to loan money to governments that guarantee you will receive less in return. That’s quite goofy.
If you get nothing else from this book, learn at least one important element. It will justify the couple of bucks you may have plunked down for the sucker.
All debts get paid.
I will repeat myself because it’s such a vital element to understanding finance and investing.
ALL DEBTS GET PAID.
They are paid either by the borrower or by the lender.
I remember loaning a fellow some money while we were playing craps in the O-Club in Meridian, Mississippi, one Friday night happy hour in 1966. That’s already one serious mistake on my part, you are no doubt thinking.
Playing craps wasn’t a mistake. I have made a heap of money over the years shooting dice, starting on my first night in boot camp in San Diego in 1964, using a set of dice made from chalk. I suspect our young men and women undergoing the same rite of passage today probably forgo shooting dice, and that’s a pity. In combat and in investing, understanding the odds of every roll is vital.
In short, if you want to know how to invest at a profit, knowing the odds helps a lot.
Back to the O-Club in Meridian. My first loan ever was never repaid by the borrower. Eventually it sunk in that if he wasn’t going to pay, then what I believed to be an asset wasn’t. So I ended up paying, to my great surprise.
All debts get paid. If not by the borrower, then by the lender. Alas, we are told that if the US government goes into debt to the tune of over $1 trillion a year, most of it is owed to ourselves so it really doesn’t matter. It’s not as if we owe it to another country.
That’s really dumb thinking.
Here’s why.
The US Treasury releases a financial statement each year. The 2016 statement showed that the US government’s 75-year unfunded liability just for Social Security and Medicare totaled $46.7 trillion. That’s money that we “owe to ourselves,” so a lot of writers suggest we ignore it. It’s not as if it’s a real debt.
Well, if you are planning on collecting Social Security or using Medicare 25 years from now, the government not paying its debts means no money for you. So if the government doesn’t pay its debt, you get to pay it instead, by forgoing Social Security or Medicare.
Have fun in your retirement years without the income or insurance that you were promised. Do let me know how you feel about debts to you not being paid, and if you think it’s important or not.
Professor Laurence Kotlikoff from Boston University suggests the total unfunded liability of the United States government is really more like $210 trillion. He came up with that number in 2015. It’s a lot higher today.
The fact is that virtually every government in the world today is functionally insolvent as a result of buying votes from the populace by making a series of financial promises that it cannot possibly keep.
That’s what the Yellow Vests revolution in France is all about. That has spread to Taiwan, Israel, Jordan, Lebanon, the Netherlands, Egypt, China, and even Brussels, home to Europe’s greatest stupidity in government.
It’s something I predicted in a book I published three years ago, titled The Art of Peace. In the book I suggested that all empires end when they begin to engage in military adventurism. That is to say, wars that you don’t need to fight. You just feel like showing off your strength, like a 14-year-old boy riding a bicycle on one wheel to impress a 14-year-old girl. It may look cool but you don’t really need to do it.
Anyone who has thought at all about it can see that of the various wars the US has engaged in since September 11, 2001, none of them has accomplished anything.
Anything worth doing is worth doing right. Anything not worth doing is not worth doing.
They have cost a lot of money, as yet unpaid, and have destroyed any good opinion the rest of the world may have had of the US as the home of the brave and land of the free. How about the land of the enslaved and hopelessly bankrupt?
I said in my book that the world was awash in debt that could never be repaid. The result would be the first worldwide revolution.
Rumblings from the masses have been going on for almost a year but became visible only when protesters in France, wearing the yellow vests or gilets jaunes that are required to be kept in every vehicle, began to demonstrate all over France in November of 2018.
I’ll say more on the Yellow Vests in a later chapter since they are so important to what is happening today.
No one ever wants to address the real issue. Just who is going to pay for the cradle-to-grave benefits all these governments have promised? The arithmetic doesn’t work.
Those folks in France know how to run a revolution about as well as they understand how a guillotine functions.
Just as a small matter of interest, one of the causes of the French Revolution of 1789 was the government getting involved in the American Revolution and bankrupting itself in the process, fighting a war that did nothing for France. Those running governments around the world today should think about how their heads would look on the end of a pike. It’s happened before.
I read a piece just today about a survey recently taken in Ireland by the European Broadcasting Union’s Generation What? research group. Questions were asked of 20,000 people about their attitudes toward various groups. A full 36 percent of them viewed politicians as corrupt and an additional 40 per cent believed they were partly corrupt.
In the 1834 age group an incredible 54 per cent added that they would take part in a “large scale uprising against the generation in power if it happened in the next days or months.”
By and large, the Gilets Jaunes protests have been a mishmash of calm protesters angry at a system that ignores their problems and needs. There are no leaders. There is no single agenda. It’s just a mix of protesters spread over the whole of France. Almost all the violence comes from the police.
I spent a couple of months in Switzerland writing my last two books. When you ask the Swiss how their government works, they tend to get that “deer in the headlights” look. They know what you are asking; they just don’t know how to answer.
The government in Switzerland works by working. The president of the country has an entirely titular position, his biggest role being to preside over the Swiss Guards who aren’t in Switzerland anyway, as they guard the Pope in Rome.
If you reside in Switzerland and you have a really great idea, or even a really daft idea, if you can convince eight cantons or 50,000 voters to support your concept, the country will hold a binding referendum on the matter.
A couple of years ago someone wanted to test the concept of a guaranteed basic income. Now that sounds at first like a wonderful idea: no working, free money. They got the signatures, a referendum was held, and the idea was promptly killed. It was Switzerland after all, and they know a daft idea when they hear it.
I sense that throughout the world, ordinary people feel hopeless in the face of big government. Major organizations have undertaken studies and concluded that in the US, voting doesn’t change anything. It’s a waste of time, a sop thrown to the masses to make them feel they have a voice. But people aren’t stupid and they know they don’t have a voice. For years, most Americans have supported withdrawal from Iraq and Afghanistan but no one in Washington listens.
With the coming of the Internet, people begin to realize we don’t really need big government. Politicians have always been prostitutes. They sell their souls for votes, but once in power all they do is line their own pockets and the pockets of those special interest groups who launched them into office.
Governance in the world today simply and clearly doesn’t work. It doesn’t represent the will of ordinary people and it needs changing. We are entering what I believe will be the time of the greatest financial disaster in world history. As we do, ordinary people across the entire world are beginning to demand both change and representation. The Gilets Jaunes movement is merely the opening round, not the end. It’s not only not the end, it’s not even the end of the beginning.
The banking system went on life support back in September of 2008. As bad as banks have been historically, since 2008 they have resembled nothing less than casinos run by the Mafia. Some banks, such as Wells Fargo, have been smacked with billions of dollars in fines for clearly stealing from their customers. In reality the fines are nothing more than a tax on fraud on the part of the US federal government. Certainly the customers who were defrauded by Wells Fargo didn’t get one cent of their money back.
The perennial bad boy of European banking, Deutsche Bank, maintains a notional derivatives book of $46 trillion, or 12 percent of the entire world’s derivatives exposure. We are told the figure is meaningless because the net exposure is far less than the notional value, but those saying that have skipped an important part of the issue.
The magic behind derivatives is a theory that you reduce risk by spreading it out. Actually you do the opposite; you multiply risk because you have introduced counter-party risk. Here’s how I explain counter-party risk, and why it increases at a geometric rate as size increases.
Imagine yourself as someone controlling trillions in oil wealth. You control a seemingly endless flow of cash and if someone pisses you off, you can whack them and expect to get away with it.
You walk into any casino in Vegas and go up to the craps table. You ask the dealer if you can make a million-dollar bet on one roll of the dice. He agrees. When you make the bet, one of two things will happen. You either win and get $1 million, or you lose and fork over a lot of $100 bills. You are so rich that you really don’t care.
But you like action, so you go to the biggest-grossing casino in the world, in Macau. But now you want to make a billion-dollar bet. That’s a big bet, so the floor boss has to check with the main office, but he takes the bet with a smile. Once again, at that point you can either win or lose. If the dice favor you, you walk out with a check for a billion dollars. If they don’t, you hand over another, far bigger pile of $100 bills.
Since that worked out so well, you ask the casino manager if he can make one more bet, this time for $1 trillion. This time the manager just smiles a broad smile and nods. He doesn’t have to ask anyone for permission. He really likes this bet.
At that point only one thing can happen.
You can only lose.
It doesn’t matter a rat’s ass what the dice do; there isn’t a casino in the entire world that can cover a trillion-dollar loss. The casino manager knew it the whole time and didn’t care. If you crap out, the casino is rich beyond their wildest imagination. If you roll a seven or an eleven on the first roll, the casino can’t pay anyway so they don’t care.
It wasn’t the nature of the bet that made it a good or bad bet; it was the size. And at some point as derivatives increase in size, you are no longer just incurring a financial risk but adding counter-party risk.
With Deutsche Bank holding $46 trillion in derivatives, when a systemic crash begins, the meaningless notional exposure may well become a very real net exposure. Let me give you another example, because frankly I suspect there are only three people in the entire world who actually fully understand derivatives and two of them are a bit confused.
You look at Deutsche Bank and read that its stock price has dropped by 80 percent in the last five years. Due to loan losses and built-in losses in its derivatives book, the bank is headed for the rubbish pile. If and when Deutsche Bank collapses, that particular rolling snowball is going to become the mother of all avalanches by the time it reaches the valley floor, sweeping every other bank in the world along with it.
You realize that’s a really bad thing to happen. The Dow and S&P might drop 20 percent in a day and gold might go up by $500 an ounce in a day. The S&P is trading at 2570 and gold is at $1,285. You buy puts on the S&P at 2100 because they sell for pennies. That way, should you be right and the entire system blows up, you have incredible leverage. Likewise, you buy calls on gold at $1,600 for exactly the same reason. They too sell for pennies.
Sounds like a good deal, right? Let’s say the unthinkable then happens and the stock market does plummet, taking the S&P to 1800. Gold goes to $2,000 an ounce as it is the last man standing.
At this point you need to think about how rich you just became. I can actually work it out in my head, it is so easy. You just lost everything you put into the puts and calls.
Those gold calls that sold for pennies are in theory worth $40,000 apiece. The S&P puts work out to $30,000 each. But your counter-party, no matter who it was, is broke. Counter-party risk kicked in as a result of the size of the movement in prices. And no one is going to bail them out this time. There isn’t enough money in the world unless the US goes into the Monopoly money business. Which is certainly an option.
The world’s financial system came within hours of collapse in September of 2008 because of what seemed to be some relatively meaningless derivatives. But when notional value morphs into actual value, the game is over. 2008 was just the opening round of the collapse of the world’s financial system. We are moving rapidly into the most dangerous part of the crash.
The London office of AIG was playing fast and loose with credit default swaps on sub-prime mortgages. As an example, a tiny hedge fund similar in nature to AIG insured UBS for $1.3 billion of sub-prime mortgages for a premium of $2 million a year. As long as the mortgages didn’t default, the hedge fund was raking in the dough and making an annualized return of 44 percent. Then, in 2007, mortgages began to be defaulted upon. UBS called in its insurance claim and the hedge fund refused to pay. So UBS made an insurance claim. It didn’t get paid, and found it was now on the hook for $1.3 billion. It didn’t get its $2 million back either.
The London office of AIG literally put the entire company at risk by doing the same thing on a far larger scale. In their minds, they were privatizing financial gains and counting on the government to bail them out in the event of losses. The US government did bail out AIG, to the tune of $85 billion.
While the full figure may never be known, the US Treasury was handing out bundles of $100 bills to every bank in the world like candy to kids on Halloween. The total cost was in the trillions of dollars, all borrowed. The actions of the central banks did nothing more than convince the banks that the government would always be there to save them.
But maybe not. Things continue right up to the point where they stop.
The world is awash in debt that no one actually believes will be paid; the middle-class is being crushed between the rock of higher taxes and the hard place of constant inflation. And they have had enough. All over the world, protests are growing daily. They will continue to grow until the system blows up. Then we have The Great Reset, where we return to a level of government the middle class can afford.
If you think about it, it’s very simple. There is only a certain level of government any country can afford. Once you go above that level you are asking for problems and are guaranteed to get them.
Now this may sound irrational because you aren’t hearing it from anyone else, but the only solution is to cut back on government until it returns to a level you can afford. There are no other options; you can’t print your way out and you can’t borrow your way out. You have to reduce government.
There are some actions you can take to protect yourself. That’s what this whole book is about.
Bob and Barb Moriarty brought 321gold.com to the Internet almost 16 years ago. They later added 321energy.com to cover oil, natural gas, gasoline, coal, solar, wind and nuclear energy. Both sites feature articles, editorial opinions, pricing figures and updates on current events affecting both sectors. Previously, Moriarty was a Marine F-4B and O-1 pilot with more than 832 missions in Vietnam. He holds 14 international aviation records.
Disclosure: 1) Statements and opinions expressed are the opinions of Bob Moriarty and not of Streetwise Reports or its officers. The auther is wholly responsible for the validity of the statements. Streetwise Reports was not involved in any aspect of the article preparation. The author was not paid by Streetwise Reports LLC for this article. Streetwise Reports was not paid by the author to publish or syndicate this article. 2) This article does not constitute investment advice. Each reader is encouraged to consult with his or her individual financial professional and any action a reader takes as a result of information presented here is his or her own responsibility. By opening this page, each reader accepts and agrees to Streetwise Reports’ terms of use and full legal disclaimer. This article is not a solicitation for investment. Streetwise Reports does not render general or specific investment advice and the information on Streetwise Reports should not be considered a recommendation to buy or sell any security. Streetwise Reports does not endorse or recommend the business, products, services or securities of any company mentioned on Streetwise Reports. 3) From time to time, Streetwise Reports LLC and its directors, officers, employees or members of their families, as well as persons interviewed for articles and interviews on the site, may have a long or short position in securities mentioned. Directors, officers, employees or members of their immediate families are prohibited from making purchases and/or sales of those securities in the open market or otherwise from the time of the interview or the decision to write an article until three business days after the publication of the interview or article. The foregoing prohibition does not apply to articles that in substance only restate previously published company releases.
Negative yields are becoming common for many of the world’s most mature economies. The process of extending negative yields within these economies suggests that safety is more important than returns and that central banks realize that growth and increases in GDP are more important than positive returns on capital. In the current economic environment, this suggests that global capital investors are seeking out alternative solutions to adequately develop longer-term opportunities and to develop native growth prospects that don’t currently exist.
Our research team has been researching this phenomenon and how it relates to the continued “capital shift” that is taking place throughout the globe. We believe we have some answers for anyone interested in our opinions. We also believe the longer-term answers will depend on what happens over the next 5 to 7 years throughout the globe and how economic expectations shift as well as how global debt is dealt with.
We urge all of our followers to read all of the segments of this research post about how the global central banks are pushing the envelope and have been for many years :
Throughout our research, we referenced a number of current articles to determine our own outcomes and expectations. Some of the articles we used as reference are listed below.
Each of these resources helped to create a bigger picture of what we believe will likely happen and how the process may unfold. We’ll start by attempting to understand the core elements of the negative yield perspective and how/when it may change.
Negative yields are a result of expected economic malaise rooted in the understanding that GDP growth and economic output are relatively flat and not expected to rise. It comes down to the fact that if investors identified true growth opportunities in the major global economies, the yields for the debt instruments would reflect investor optimism (resulting in higher yields). Thus, the core element of the current global economic malaise is that the planet is transitioning from a very fragile 19th-century economic model into something new – we call it the 21st-century economic model.
This process will likely take an additional 10+ years to really begin to complete and may require many false starts as the world begins to understand exactly what is required to make this transition. Debt, as a process of engaging in economic activity, is something that is essential for some level of inflation, income, and the creation of future growth. Debt becomes a major issue when growth declines over extended periods of time resulting in a default risk for some nations/countries. Yet, as the human population continues to expand and global central banks continue to attempt to find the spark that will launch the new economic growth model, debt is essential to avoid economic contraction.
As we’ve hinted to, above, we believe the true answer is the transition away from 19th century economic structures that have resulted in massive risk factors (like unfunded pensions, unfunded state, and federal liabilities and massive global bank, investment banking and industrial level economic “black holes”) and to move towards true new world economic model. What that looks like is something we are considering at the moment and have a few ideas of.
Currently, there are a few new industries that show promise across the globe in terms of the new 21st-century economy and fledgling new industries.
_ Cannabis industry
_ Human Care Services Industry
_ Alternate housing Solutions
_ Eco-Sustainability Solutions
_ Fintech Wealth Creation Solutions
_ Social/Infrastructure Restoration Solutions
We believe the next 10+ years will become very fluid as traditional economic models are replaced with newer, more alternative, types of economic solutions that spark real growth industries and opportunities. We hope this process of transition initiates fairly quickly before any extended failure process takes place to start the reduction of capacity and resources that will be required for the rebuilding of the new 21st-century economy. Time will tell.
What this means for the rest of us is that we need to stay very focused on the fact that transitional asset shifts are very likely over the next 10+ years. The only time in history that we believe was similar to the current global economic environment was shortly after WWII. Global debts had skyrocketed and economic expectations throughout the planet were mild at best. Germany and most of Europe was beginning a rebuilding process while most of SE Asia and Japan were also attempting to rebuild and restructure after a brutal series of global wars. Much of the outside world was still in some form of an undeveloped economic structure at that time. For most of the developed world, the process of rebuilding and identifying real economic growth came nearly 20 years after the end of WWII – near the late 1950s and early 1960s as a type of Renaissance Era.
Given today’s world and how quickly things progress, we believe the process may take about 7 to 14 years to complete this time – depending on how quickly we are able to transition the global away from risks and systematic failures that are a result of clinging to failed 19th-century components.
It is our opinion that wild price rotations in a variety of global assets will plague the global markets over the next 7+ years as pools of capital are moved into and out of opportunities for returns and gains. We believe all of the world’s global markets are at risk for these very volatile rotations in price levels and that individual segments of the global markets will become targets for price declines and advances as capital attempts to force a “price discovery” process that seeks to identify true price values.
The process of true price discovery is convoluted with the steps of shaking off old expectations, risks, liabilities, falsehoods, and processes while attempting to identify real future value and executing the steps to transition these resources into renewed future expectations. It is almost like tearing down a structure in order to build something better and more efficient from the usable pieces of the old structure.
Our opinion is that skilled technical traders need to stay very fluid right now and to understand that broader risk factors are at play throughout the globe. Every major and minor economy on the planet will likely feel some aspect of the transition that is taking place within the global economy. We’ve highlighted a few charts, below, to show variations of risk as related to the trends that have taken place over the past 8+ years. Two of these charts shows a Pitchfork type of price channel. Once price breaks below these price channels, we enter a new territory of downward price trends that will begin the price discovery process.
This chart of the German DAX suggests the lower price trend channel is currently near $9300. As time progresses, that channel continues to rise. We would expect the $10,000 level to be a critical psychological level going forward.
This chart of the FSTE 100 shows a similar pattern where the lower price channel is near $5450 currently. As we progress further in time, that level continues to rise. We would suggest the $6000 will become critical for price support in the FTSE going forward.
The SPY sets up a similar pattern but shows more of our cycle and other research elements. The lower BLUE price channel, near $240, is our current price channel providing longer-term support. Below that level, we would fall back to the 2016 lows near $209.40.
Pay attention to what happens in the global markets over the next 6 to 18 months. The US Presidential election, Brexit and a host of other global issues are still playing out. We believe we are just starting this transition process and we believe now is the time for all skilled technical traders to fully understand that risks, price rotation, and true price discovery are very likely outcomes that may drive very wild price moves for many years into the future.
We urge all of our followers to read all of the segments of this research post about how the global central banks are pushing the envelope and have been for many years :
In closing, sit back and think about all the opportunities that will be created over the next 7+ years if you are skilled enough to trade these massive price swings. Think about how the world will transition away from risk factors that continue to plague our future and towards something that will usher in a 50+ year run of opportunity and gains. If you are young enough to enjoy this run, now is the time you will want to find a solid team of people that can help you navigate this process and find success.
We urge all of our followers to pay attention to our research, consider your options very closely and prepare for this next move by pulling some of your active portfolio away from risks and into more protective measures. This Crazy Ivan event is just 10 days away and we really want to urge all of our followers to not under-estimate this event cycle.
WARNING SIGNS ABOUT GOLD, SILVER, MINERS, AND S&P 500
In early June I posted a detailed video explaining in showing the bottoming formation and gold and where to spot the breakout level, I also talked about crude oil reaching it upside target after a double bottom, and I called short term top in the SP 500 index. This was one of my premarket videos for members it gives you a good taste of what you can expect each and every morning before the Opening Bell. Watch Video Here.
I then posted a detailed report talking about where the next bull and bear markets are and how to identify them. This report focused mainly on the SP 500 index and the gold miners index. My charts compared the 2008 market top and bear market along with the 2019 market prices today. See Comparison Charts Here.
On June 26th I posted that silver was likely to pause for a week or two before it took another run up on June 26. This played out perfectly as well and silver is now head up to our first key price target of $17. See Silver Price Cycle and Analysis.
More recently on July 16th, I warned that the next financial crisis (bear market) was scary close, possibly just a couple weeks away. The charts I posted will make you really start to worry. See Scary Bear Market Setup Charts.
Fears of a recession were overdone last week as a sense of normalcy returned. Equity indices managed to post a modest recovery into Friday’s close.
However, concerns continue to keep risk appetite in check. From the inverted yield curve to a slowdown in China and Germany, to the crisis in Argentina, investors had plenty of narratives running in the background.
Euro Slips to 2-Week Low
The common currency fell to a two-week low on Friday. The declines came amid a broader strength in the USD as well as the trade balance figures. The eurozone’s trade surplus stood at 20.6 billion. This came as exports were down 4.7% while imports fell 4.1% during the period. The trade surplus of 20.6 billion was down from 22.6 billion in June 2019.
Will EURUSD Decline Further?
The currency pair’s decline last week shows price trading just above the lower trend line. This could offer some dynamic support in the near term. However, price action remains weak and there is a possibility for the EURUSD to test the previous lows near 1.1030. The Stochastics oscillator remains in the oversold level, which signals a possible rebound in price in the near term.
Crude Oil Trades Mixed Amid Economic Uncertainty
WTI crude oil prices closed with modest gains on Friday. Price action in crude oil remains flat amid the economic outlook turning mixed. However, last week’s retail sales report managed to quell fears of a recession. This partly led to gains in oil prices but the commodity failed to capitalize on it. The strength of the USD also dampened the upside bias in oil.
WTI Crude Oil to Maintain the Sideways Range
Oil prices are expected to maintain the sideways range. The resistance level is established at 57.50 while the support is found at 51.70. Amid this level, the minor support at 52.00 is seeing a bit of consolidation. Overall, oil prices need to break out from this range to establish some momentum and direction to the trend. Until then, we expect prices to remain flat.
Gold Pulls Back from Highs
The precious metal managed to log another week of gains. However, last week’s volatility failed to push gold prices any higher. The precious metal is likely to remain in a wait-and-see mode heading into this week. Important events such as the FOMC meeting minutes, the ECB minutes and Jackson Hole symposium will be some of the catalysts for gold.
XAUUSD Could Turn Weaker if 1500 Support Fails
Price action in gold remains somewhat mixed with the support level near 1500 likely to be critical. Given that gold failed to post fresh highs, we anticipate a steeper correction if the 1500 psychological support gives way. This will pushed gold prices down to test the lows of 1485. To the upside, gold will need to post higher highs to confirm the upside bias.
The currency pair is trading in the second half of the third wave of decline to 1.1019. Today a decline to 1.1070 looks possible, upon the breakaway of which hitting 1. 1035 may become probable. The goal is local. Then growth to 1.1070 may follow, and then – a decline to 1.1019.
GBPUSD
The instrument has realized an impulse for a decline to 1.2138 and its correction to 1.2161. Upon escaping this level downwards, the trend may continue to 1.2108, followed by the growth to 1.2135 and a decline to 1.2093. An alternative may be a renewal of 1.2180 in case of going upwards, followed by a decline along the trend.
USDCHF
The currency pair formed a consolidation range around 0.9777. Growth to 0.9850 looks possible, the goal is local. A correction to 0.9808 and growth to 0.9898 may follow. The goal is first.
USDJPY
The instrument is forming a consolidation range around 106.35. Growth to 106.95 may follow. Upon breaking this level away, a potential for the wave continuation to 108.20 may appear.
AUDUSD
The pair is trading in a structure of growth to 0.6808. The level may be hitted today, after which a consolidation range may form around it. After an escape upwards growth to 0.6880 may follow, the goal is local.
USDRUB
The pair is trading under pressure for growth. It may hit 66.70 and then decline to 65.75.
USDCAD
The pair has completed a wave of declining to 1.3260,this structure regarded as a correction, which may extend to 1.3240. The main scenario is trend continuation uowards to 1.3360.
GOLD
Gold is developing the consolidation range around 1507.40. The main scenario may be a decline to 1494.30. An alternative would be a spurt to 1534.75.
BRENT
Oil is trading under a pressure for growth. It may hit 59.72 and decline to 58.70, and then grow to 61.01. The goal is local.
BTCUSD
The instrument is trading under a pressure for growth. A breakaway of 10506.50 upwards is not excluded. The goal is at 10745.45. Then a decline to 9855.00 may follow. The goal is first.
Attention! Forecasts presented in this section only reflect the author’s private opinion and should not be considered as guidance for trading. RoboForex LP bears no responsibility for trading results based on trading recommendations described in these analytical reviews.