On Monday the 19th of August, trading on the euro closed down. The bulls were unable to keep the EURUSD pair in positive territory. The breakout of the trend line brought the rate down to 1.1076. At the beginning of the European session, the euro was being propped up by expectations that German would announce some fiscal stimulus measures.
Here we got some negative news. The German finance minister said that Germany may forego balancing the budget in favour of increased spending in the event of a recession.
In the evening, the euro dropped in response to remarks from the Federal Reserve’s Eric Rosengren, who said that he doesn’t currently see the case for rate slash, given the relative strength of the US economy and a lack of any serious threats. The Fed should focus more on economic statistics to determine the right time for a rate reduction.
The bulls failed to get a foothold above the balance line. The resurgent dollar forced them to close the long positions they had opened ahead of the European session.
At the time of writing, the euro is trading at 1.1077 against the greenback. As it stands, only the pound and the euro are trading down. In today’s Asian session, all the other majors are up against the dollar. Markets are still under pressure from the ECB’s governing council member Rehn’s remarks about the stimulus package being prepared for the Eurozone.
Investors now have their eyes fixed on the US, where the Federal Reserve will release the minutes of its latest meeting on Wednesday, followed by the annual conference at Jackson Hole from the 22nd to 24th of August, where Jerome Powell will speak.
Also note that the US Department of Commerce has granted an extension to telecoms giant Huawei that allows it to purchase supplies from US companies. Donald Trump has said that trade negotiations with China are set to continue.
Taking all these factors into account, it’s reasonable to expect high market volatility during the week, which could further increase with the FOMC minutes and developments at Jackson Hole.
From a technical point of view, we’ve now got a contradictory picture on the EURUSD pair. On the chart, we’ve highlighted the zone of 1.1069 – 1.1075, as well as the 1.1055 mark. The stochastic has reversed downwards, so there’s a high probability of a drop to 1.1069.
The 135th degree is a key level, so if we don’t get a bounce here, the pair could slide as far as 1.1020. The majors paint a mixed picture, while the EURGBP cross is trading up. The bears could drag the market down and cash in on their short positions.
A sense of positivity is sweeping across financial markets on Tuesday amid signs of progress in trade negotiations and hopes of stimulus in major economies.
Asian markets were mixed during early trading after China’s central bank announced a key interest rate reform over the weekend – a move seen supporting economic growth. The mood across European market is set to improve further on rising optimism about stimulus measures in Germany after Finance Minister Olaf Scholz suggested that Berlin could spend up to €50 billion in an economic crisis.
While stimulus hopes and renewed trade optimism are clearly fuelling global equity bulls, the question is for how long?
The explosive movements witnessed across financial markets last week highlight how global sentiment remains fragile and highly sensitive to geopolitical risk factors. Equity bears have enough ammunition to make an unwelcome return should renewed trade tensions and global recession fears rekindle risk aversion.
King Dollar comfortably sits on throne
The mighty Dollar continues to tighten its grip across currency markets as the Dollar Index (DXY) hits a fresh three-week high at 98.40 on Tuesday.
Stimulus hopes is sending investors away from safe haven assets, which is lifting US government bond yields consequently supporting king Dollar.
Where the Dollar concludes this week will be heavily influenced by the FOMC minutes and Chair Jerome Powell’s speech in Jackson Hole on Friday. Should the minutes and Powell’s speech confirm expectations of a US interest rate cut in September, the Dollar has the potential to weaken.
In regards to the technical picture, the DXY remains bullish on the daily charts. An intraday breakout above 98.50 should inspire a move higher towards 99.00.
Commodity spotlight – Gold
Gold bulls are engaged in a fierce battle to defend the $1500 psychological level as investors seek riskier assets.
While the improving market mood has the potential to send the precious metal lower in the near term, the medium to longer term outlook remains bullish. Gold is seen finding ample support from a dovish set of Fed minutes and if Powell signals a September interest rate cut during his speech as Jackson Hole.
In regards to the technical picture, Gold is bullish on the daily charts. Should $1500 prove to be a reliable support, prices are seen rebounding towards $1525 and $1550. A breakdown below $1500 opens the doors towards $1485.
Disclaimer: The content in this article comprises personal opinions and should not be construed as containing personal and/or other investment advice and/or an offer of and/or solicitation for any transactions in financial instruments and/or a guarantee and/or prediction of future performance. ForexTime (FXTM), its affiliates, agents, directors, officers or employees do not guarantee the accuracy, validity, timeliness or completeness, of any information or data made available and assume no liability as to any loss arising from any investment based on the same.
Dollar strengthening resumed after hawkish Fed comment
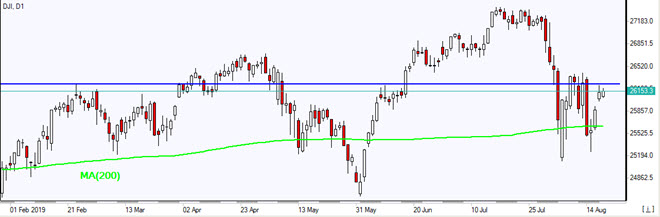
US stock indexes advance continued on Monday underpinned by stimulus hopes after President Trump’s economic adviser Larry Kudlow told on Sunday the administration was “looking at” a 10% tax cut for middle-income earners. The S&P 500 extended gains 1.2% to 2923.65. Dow Jones industrial advanced 1% to 26135.79. The Nasdaq composite rose 1.4% to 8002.81. The dollar strengthening resumed as Federal Reserve Bank of Boston president Rosengren, a voting member of the central bank’s interest-rate-setting committee, said “we have to be careful not to ease too much when we don’t have significant problems:” the live dollar index data show the ICE US Dollar index, a measure of the dollar’s strength against a basket of six rival currencies, rose 0.2% to 98.35 but is lower currently. Stock index futures point to higher market openings today
European indexes rise on German stimulus talk
European stocks recovery continued on Monday led by basic resources shares. GBP/USD joined EUR/USD’s continued slide yesterday with euro higher currently while Pound inching lower. The Stoxx Europe 600 index ended 1% higher. The DAX 30 rose 1.3% to 11715.37 as German Finance Minister Olaf Scholz said on Sunday that Germany could free up around 50 billion euros of extra spending . France’s CAC 40 advanced 1.3% and UK’s FTSE 100 gained 1% to 7189.65.
Australia’s All Ordinaries Index rises while Chinese indexes slide
Asian stock indices are mixed today despite US decision to give Chinese telecom giant Huawei another 90 days to buy equipment from American suppliers. Nikkei closed 0.6% higher at 20677.22 despite the reversal of yen slide against the dollar. Markets in China are down as the central bank of China set the one-year Loan Prime Rate at 4.25%, down from 4.31% previously: the Shanghai Composite Index is down 0.2% and Hong Kong’s Hang Seng Index is 0.2% lower. Australia’s All Ordinaries Index added 1.2% despite Australian dollar turning higher against the greenback.
Brent futures prices are edging higher today. Prices rose yesterday boosted by Yemen’s Houthi rebels’ drone attack over the weekend on one of Saudi Arabia’s largest oil fields: October Brent crude closed 1.9% higher at $59.74 a barrel on Monday.
Note: This overview has an informative and tutorial character and is published for free. All the data, included in the overview, are received from public sources, recognized as more or less reliable. Moreover, there is no guarantee that the indicated information is full and precise. Overviews are not updated. The whole information in each overview, including opinion, indicators, charts and anything else, is provided only for familiarization purposes and is not financial advice or а recommendation. The whole text and its any part, as well as the charts cannot be considered as an offer to make a deal with any asset. IFC Markets and its employees under any circumstances are not liable for any action taken by someone else during or after reading the overview.
In the future, dengue outbreaks will escalate worldwide. Due to tropical and socio-economic conditions, climate change (and covert biological efforts), dengue can only be contained through multipolar cooperation.
In mid-July, Philippines health authorities declared a “national dengue alert.” In early August, the Department of Health declared a National Dengue Epidemic. By now, the number of cases has soared to 170,000, with 720 deaths; that’s 100% higher relative to 2018, despite a delayed rainy season. The most affected age group among dengue deaths is 5-9 years.
The dengue outbreak in the Philippines and several other South and Southeast Asian countries is now international headline news. But how did dengue become “endemic” to these countries?
The conventional dengue narrative
By the 2010s, dengue caused the greatest human disease burden of any arbovirus – that is, viruses that are transmitted by mosquitoes, ticks, or other arthropods, including yellow fever – with estimated 10,000 deaths and 100 million symptomatic infections per year in over 125 countries.
Historically, the first epidemic instances of dengue occurred in Asia, Africa and North America in the late 18th century. The ecological disruption in Southeast Asia and the Pacific during and after World War II fostered conditions for increased transmission of mosquito-borne diseases.
The first recorded dengue hemorrhagic fever (DHF) epidemic occurred in Manila, in the early 1950s, but within 20 years the disease in epidemic form spread throughout Southeast Asia.
By the mid-1970s, dengue was the leading cause of hospitalization and death among children in the region, while epidemics intensified in the Pacific and the Americas. Since the 1980s and 1990s, epidemic dengue transmission has intensified further, with a global resurgence of dengue fever.
In this view, the Philippine dengue epidemic is the net effect of environmental conditions (last July was the warmest in recorded history), vaccination debacle (Dengvaxia mess, corruption), extreme weather (high precipitation), living conditions (high urban density), and socio-economic vulnerabilities (low living standards, high income polarization, weak public-health system).
Yet, medical studies presume that dengue is “endemic” to certain climate areas, even though it has been purposefully exploited ever since the postwar era. The Philippines has a special role in this dark history of experimentation on unwitting human subjects. US bio-tests began in the Philippines in 1906, when Richard P. Strong, then head of the Philippine Biological Laboratory, inoculated 24 inmates of Manila’s Bilibid Prison with a cholera vaccine that had been contaminated with plague causing 13 fatalities.
The covert dengue history
After World War II, the United States quietly augmented domestic efforts by recruiting major Nazi and Japanese bio-warfare scientists. As weaponization activities began with disease vectors in the early ‘50s, the focus was on plague-fleas, mosquitoes, and yellow fever. During tests in Utah, Georgia and Florida, hundreds of thousands of fleas and (yellow fever) mosquitoes were dispersed, according to US Army studies.
Until the early ‘70s, US program stockpiled dangerous bioagents and pursued research on many more. In 1972 the Biological Weapons Convention (BWC) banned the “offensive” use of biological and toxin weapons, yet the treaty, which suffers from verification and compliance issues, left the door open for “defensive” bio-warfare and “research” in major powers.
Historically, dengue fever had been the focus on US Army and CIA biological warfare researchers for more than half a century. US Army’s Biological Warfare facility at Fort Dietrick, Maryland, has experimented with dengue fever, as verified by US historians and congressional committees since the 70s. By 1981, Cuba struggled amid an epidemic of hemorrhagic dengue fever, although it did not have a history of severe dengue outbreaks.
During the Cold War, when biological agents were produced in industrial scale by the Soviet Union and the US, the threat of the mutually assured destruction constrained risks. After the Cold War, the Nunn-Lugar Cooperative Threat Reduction Program (CTRP) presumably aimed to keep the former Soviet Union’s nuclear and chemical infrastructure from rogue nations and terrorists. Yet, in 1996 Congress expanded the program internationally.
Branching from the Nunn-Lugar program, bio-labs are funded by the Defense Threat Reduction Agency (DTRA) under a multibillion dollar military Cooperative Biological Engagement Program (CBEP). The CBEP labs are located in 25 countries, including in Eastern Europe (e.g., Georgia and Ukraine), the Middle East, Africa and Southeast Asia – and the Philippines.
Critics claim that some of these locations have seen outbreaks of tropical diseases, which are not endemic to the area. After 2015, sand flies, which can be found in Philippines (and were tested on humans in US in early ‘70s), have infested areas in Tbilisi, Georgia. In turn, outbreaks of tropical diseases, such as dengue, have become more severe.
Until recently, there had been no dengue outbreak in the US since the 1930s. Presumably, dengue had been eradicated, despite global increases in incidence and severity, and immigration. But in 2009, Key West, Florida, several residents showed infection. According to a study by the Centers for Disease Control (CDC), the infection rate in the area was 5 to 8%. Mosquitoes known to spread dengue fever were found in more than half of US states.
According to CIA documents and the 1975 Congressional committee, three sites in Florida, Key West, Panama City and Avon Park, and in central Florida, had been used for experiments with mosquito-borne dengue fever and other biological agents.
Dengue scope, costs, severity will escalate
Thanks to global warming, the dengue challenge is likely to get worse. Risks from some vector-borne diseases, such as malaria and dengue fever, are projected to increase with warming from 1.5°C to 2°C. That, in turn, will cause an increase in the number of mosquitoes, a larger geographic range, and more individuals will be at risk of dengue fever.
In a recent study, the total annual global cost of dengue illness was estimated at $8-9 billion (with upside estimates at $20 billion). Rising temperatures imply that dengue will intensify in “already endemic areas.” By 2050, much of southeastern US will become suitable for dengue, inland areas of Australia, many of the larger cities in coastal China and Japan, and particularly in southern Africa. Globally some 2.3 billion more people will be at risk of dengue in 2080 compared to 2015, bringing the total population at risk to over 6.1 (high estimate 6.9) billion, or 60% of the world’s population.
The role of covert attempts in viral outbreaks is hard to assess, but the concern is rising. A new Pentagon program called “Insect Allies,” which is funded by the Defense Advanced Research Projects Agency (DARPA) and relies on gene editing, wants to infect insects with modified viruses, presumably to make US crops more resilient. Some international scientists believe such initiatives can easily be exploited as new bio-weapon systems programs, which violate the Biological Weapons Convention.
After the Cold War, US has dominated biological defense and research. With rising climate risks and geopolitical tensions, no single country should have monopoly over global biological agents in the 21st century, however. Potential conflicts of self-interest are obvious, tragic and potentially existential.
Like “dual-use” technologies that can be used for both peaceful and military objectives, biological agents can serve as potential antidotes and weapons. What we truly need is multipolar cooperation among the major advanced economies and largest emerging powers. Only such checks can constrain existential biological risks to vast urban populations in the future.
This commentary is based on Dr Steinbock’s fully-referenced research note on the dengue outbreak in the Philippines, climate change and rising global dengue risks.
About the Author:
Dr. Dan Steinbock is the founder of Difference Group and has served at India, China and America Institute (US), Shanghai Institute for International Studies (China) and EU Center (Singapore). For more, see http://www.differencegroup.net/
The original commentary was published by The Manila Times on August 18, 2019
Solid Biosciences’ shares are up by more than 40% today after Chardan Capital Markets upgraded the firm’s shares from “neutral” to “buy” and raised its price target from $7.50 to $10.00/share.
Duchenne muscular dystrophy (DMD) research firm Solid Biosciences Inc. (SLDB:NASDAQ) was upgraded by analysts at Chardan Capital Markets from a “neutral” rating to a “buy” rating in a report issued this morning. Chardan’s biotechnology and pharmaceuticals analyst Gbola Amusa, MD, CFA, wrote, “We now upgrade SLDB from Neutral to Buy, increasing our price target from $7.50 to $10.00 ahead of Solid’s anticipated IGNITE DMD data update later this year…The risks surrounding SGT-001 are well-known to the market, and any improvements in the market’s view of SGT-001 safety and/or efficacy (e.g. with the IGNITE DMD data update later this year) could lead to significant share price momentum.”
News of the upgrade gained much attention from investors and the stock has traded up higher than 40% at times today over yesterday.
Earlier this week the company provided a business update and announced financial results for the second quarter ended June 30, 2019.
During Q2/19, research and development (R&D) expenses were $21.6 million, compared to $13.6 million for Q2/18. The increase was primarily attributable to compensation and other costs associated with additional headcount, as well as facility costs and increased costs related to the clinical development and manufacturing activities for SGT-001. General and administrative expenses for Q2/19 were $5.4 million, compared to $4.6 million for Q2/18.
The firm reported a net loss for Q2/19 of $26.5 million, compared to $18.0 million for Q2/18.
In the release the company reiterated that it had raised $60 million through a private placement that closed on July 30, 2019. Solid had $67.4 million in cash, cash equivalents and available-for-sale securities as of June 30, 2019, compared to $122.5 million as of December 31, 2018. Including the proceeds from the July 2019 private placement, Solid expects that that company has sufficient capital to fund its operations into the fourth quarter of 2020.
Ilan Ganot, CEO, president and co-founder of Solid Biosciences, commented, “We continue to execute on our mission to bring transformative therapies to patients with Duchenne muscular dystrophy, and we have taken several steps towards reaching our goal…We have amended the IGNITE-DMD protocol to expedite our clinical path evaluating our SGT-001 gene transfer candidate and have treated a second patient in our higher dose cohort. We also bolstered our financial resources and extended our runway. Looking forward, we continue to anticipate providing a data update from the IGNITE DMD clinical trial in the months ahead.”
Solid’s lead candidate, SGT-001, is a novel adeno-associated viral (AAV) vector-mediated gene transfer under investigation for its ability to address the underlying genetic cause of Duchenne muscular dystrophy (DMD), mutations in the dystrophin gene that result in the absence or near-absence of dystrophin protein. SGT-001 is a systemically administered candidate that delivers a synthetic dystrophin transgene, called microdystrophin, to the body. SGT-001 has been granted Rare Pediatric Disease Designation, or RPDD, and Fast Track Designation in the United States and Orphan Drug Designations in both the United States and European Union.
Solid Biosciences describes itself as a life science company focused solely on finding meaningful therapies for Duchenne muscular dystrophy. The company states that is was founded by those touched by the disease and is a center of excellence for DMD, bringing together experts in science, technology and care to drive forward a portfolio of candidates that have life-changing potential. Solid is progressing programs across four scientific platforms: Corrective Therapies; Disease-Modifying Therapies; Disease Understanding and Assistive Devices.
The company’s shares opened today at $6.84 (+$0.69, +11.22%) over yesterday’s close of $6.15, but are trading higher now between $6.74-8.74. At present, the stock is trading at $8.74 ($2.59, +42.11%).
Disclosure: 1) Stephen Hytha compiled this article for Streetwise Reports LLC and provides services to Streetwise Reports as an independent contractor. He or members of his household own securities of the following companies mentioned in the article: None. He or members of his household are paid by the following companies mentioned in this article: None. 2) The following companies mentioned in this article are billboard sponsors of Streetwise Reports: None. Click here for important disclosures about sponsor fees. 3) Comments and opinions expressed are those of the specific experts and not of Streetwise Reports or its officers. The information provided above is for informational purposes only and is not a recommendation to buy or sell any security. 4) The article does not constitute investment advice. Each reader is encouraged to consult with his or her individual financial professional and any action a reader takes as a result of information presented here is his or her own responsibility. By opening this page, each reader accepts and agrees to Streetwise Reports’ terms of use and full legal disclaimer. This article is not a solicitation for investment. Streetwise Reports does not render general or specific investment advice and the information on Streetwise Reports should not be considered a recommendation to buy or sell any security. Streetwise Reports does not endorse or recommend the business, products, services or securities of any company mentioned on Streetwise Reports. 5) From time to time, Streetwise Reports LLC and its directors, officers, employees or members of their families, as well as persons interviewed for articles and interviews on the site, may have a long or short position in securities mentioned. Directors, officers, employees or members of their immediate families are prohibited from making purchases and/or sales of those securities in the open market or otherwise from the time of the interview or the decision to write an article until three business days after the publication of the interview or article. The foregoing prohibition does not apply to articles that in substance only restate previously published company releases.
The metallurgical result and its implications are addressed in a ROTH Capital Partners report.
In an Aug. 14 research note, ROTH Capital Partners analyst Jake Sekelsy reported that the final results from the metallurgical work done at Vista Gold Corp.’s (VGZ:NYSE.MKT; VGZ:TSX) Mt. Todd gold project in Australia were positive. Accordingly, ROTH increased its target price on the gold company to US$1.60 per share from US$1.40. The current share price, in comparison, is US$0.86.
Sekelsky highlighted that testing resulted in recoveries in the low-90% range, “a significant increase” over the 86.4% outlined in the prefeasibility study. This recovery rate was determined from 71 samples of various grades from the main Batman deposit at Mt. Todd, “which we believe provides a representative sample of the deposit as a whole.”
Next for Vista Gold, the analyst indicated, is updating the prefeasibility study, specifically the costs and foreign exchange rates within it, and incorporating the metallurgical results as well. “In short, we expect the updated prefeasibility study to feature enhanced economics relative to the existing prefeasibility study,” Sekelsky added, noting such an updated study would be the “largest” short-term catalyst for the company.
Based on the recent metallurgical results, ROTH adjusted its model on Vista Gold, increasing, but remaining conservative on, the estimated average recovery rate at Mt. Todd to 90% rather than 87%, wrote Sekelsky. Also, “we believe additional upside remains via an update to foreign exchange rates utilized in the prefeasibility study.”
ROTH, which considers Vista Gold a Buy, expects the Mt. Todd project “to continue to provide investors with strong leverage to higher gold prices,” Sekelsky concluded.
Disclosure: 1) Doresa Banning compiled this article for Streetwise Reports LLC and provides services to Streetwise Reports as an independent contractor. She or members of her household own securities of the following companies mentioned in the article: None. She or members of her household are paid by the following companies mentioned in this article: None. 2) The following companies mentioned in this article are billboard sponsors of Streetwise Reports: None. Click here for important disclosures about sponsor fees. 3) Comments and opinions expressed are those of the specific experts and not of Streetwise Reports or its officers. The information provided above is for informational purposes only and is not a recommendation to buy or sell any security. 4) The article does not constitute investment advice. Each reader is encouraged to consult with his or her individual financial professional and any action a reader takes as a result of information presented here is his or her own responsibility. By opening this page, each reader accepts and agrees to Streetwise Reports’ terms of use and full legal disclaimer. This article is not a solicitation for investment. Streetwise Reports does not render general or specific investment advice and the information on Streetwise Reports should not be considered a recommendation to buy or sell any security. Streetwise Reports does not endorse or recommend the business, products, services or securities of any company mentioned on Streetwise Reports. 5) From time to time, Streetwise Reports LLC and its directors, officers, employees or members of their families, as well as persons interviewed for articles and interviews on the site, may have a long or short position in securities mentioned. Directors, officers, employees or members of their immediate families are prohibited from making purchases and/or sales of those securities in the open market or otherwise from the time of the interview or the decision to write an article until three business days after the publication of the interview or article. The foregoing prohibition does not apply to articles that in substance only restate previously published company releases. As of the date of this interview, officers and/or employees of Streetwise Reports LLC (including members of their household) own securities of Vista Gold, a company mentioned in this article.
Disclosures from ROTH Capital Partners, Vista Gold, Company Note, August 14, 2019
Regulation Analyst Certification (“Reg AC”): The research analyst primarily responsible for the content of this report certifies the following under Reg AC: I hereby certify that all views expressed in this report accurately reflect my personal views about the subject company or companies and its or their securities. I also certify that no part of my compensation was, is or will be, directly or indirectly, related to the specific recommendations or views expressed in this report.
ROTH makes a market in shares of Vista Gold and as such, buys and sells from customers on a principal basis.
ROTH and/or its employees, officers, directors and owners own options, rights or warrants to purchase shares of Vista Gold stock.
Shares of Vista Gold may be subject to the Securities and Exchange Commission’s Penny Stock Rules, which may set forth sales practice requirements for certain low-priced securities.
ROTH Capital Partners, LLC expects to receive or intends to seek compensation for investment banking or other business relationships with the covered companies mentioned in this report in the next three months.
If you’ve been following our research long enough, you’ll remember that we often discuss Fibonacci Price Theory and how we use it to try to identify opportunities and trends in the markets. The basic premise of Fibonacci Price Theory is that price is always seeking to establish newer highs or newer lows with every rotation on the charts. The theory is rather simple to understand and learn and it helps easily identify where support, resistance, and the trend is established. Let’s take a minute to go over the basics of Fibonacci Price Theory before we continue.
This first example of Fibonacci Price Theory trend is a simple example that highlights the basic premise of the theory – price move always attempts to establish new price highs or new price lows in a trend. Therefore, in a downtrend, we would attempt to observe price in a simple structure as you see on the left side of this example – establishing new lower lows and new lower highs in a series of waves. In an uptrend, we would attempt to observe price in an opposite structure where new higher highs and new higher lows are set up. Fairly simple so far – right?
In complex price rotations, we have to understand that we are changing the perspective of price trend when we are looking at different intervals of price data. When we are investigating a 10-minute chart, we will see shorter-term Fibonacci price structure which may appear to be counter to our longer-term charts (Daily, Weekly or other intervals). This is because the Fibonacci Price Theory works on all intervals and attempts to identify price structure and trend based on price rotations and true price structure.
In the complex example, below, we’ve drawn some samples that show price rotation within a trend. The first example, on the left, is a continued DOWNTREND with a failed bullish high near the middle. This happens often as price enters a congestion period. Notice that after the initial new low, price rotated within a range, then broke out setting up the bullish “new high”, but then immediately failed and moved lower. Sometimes you’ll hear us report this type of setup as a “washout high”. This failed trigger immediately sets up a bigger downside price move as the price was unable to find support above the previous high levels. As soon as price rotated lower after that peak and took out those previous highs, we should have been very cautious of the upside potential. When it took out the most recent low (shown with the PINK box), that was our trigger that the bullish trend was OVER and the new bearish trend was setup.
On the right side, we have a complete price rotation (from bullish to bearish). We can see the upside trend initially set up with a new price high, then price consolidated into a range. Once price broke above the most recent range high (highlighted with the PINK box), that was a new bullish trigger that price should attempt to move higher. After it broke the previous GREEN peak, that provides even further confirmation of an uptrend.
Once the second big peak setup, the price moved lower to set up a rotational low and high price that established our Fibonacci Price Theory trigger range. A move above that last high would provide confirmation that the trend should continue to move higher and a move below that last low would provide confirmation that the trend has reversed into a bearish trend. The price moved lower (see the PINK box) and we set up a new bearish price trend based on these simple price rotations.
We hope these examples allowed you to better understand the next series of charts below. Look for these structures in the real price of these charts and see if you can see what we see in terms of the “Setup”.
First, let’s start with the YM 120-minute chart and what we believe is the SETUP for our August 19 breakdown prediction. Looking at this chart, we have a DOUBLE-TOP type of setup on the left side where two price high setups aligned within a few ticks of one another. What confirms this as a DOUBLE-TOP is the subsequent breakdown of price setting up the August 15 price low near 25,400. Since that breakdown (establishing a new lower low), we can presume the trend is Bearish based on Fibonacci Price Theory and we can assume that a new breakdown trend may be setting up on the hard right edge of this chart. This new rotation near the right edge of the chart may turn into a complex price rotation, but we believe the downside move will eventually become very clear to traders based on our August 19 breakdown prediction.
This YM 240 Minute chart reflects a different perspective of the same trend. We still see the extended DOUBLE-TOP formation after the bigger breakdown in price in early August. We also see the August 15 low as a complex price rotation setting up near the right edge of this chart. Now, think about the examples we used to try to help you understand this type of Fibonacci Price Theory setup? We have a big downside price move in early August – setting up a new bearish price trend. In order for us to attempt to confirm a reversal of that bearish trend, we would need to see a price peak setup and be breached with a new higher high type of price setup. Given that no new price high has broken above the late July price highs and each subsequent price peak has set up in either a DOUBLE-TOP formation or a lower high type of price structure – what are we left to conclude? This is still a bearish price trend setup and that means we should expect a new downside price leg to attempt to establish a new price low.
Here is the NQ 240 minute chart. Take a look at this and use your new skills to try to understand why we believe the eventual price breakdown will happen? This is almost exactly like the Complex Fibonacci Price Structure on the RIGHT SIDE of the example we provided (above). A deep downside move sets up a bearish trend. Moderate upside price rotation in early August sets up a bullish corrective wave (because no new price high broke above the 8050 highs). After the corrective wave exhausted near August 15, it broke downward to establish the recent new low near 7400 (notice the attempted “washout high” near August 14th?). Currently, the new price low from August 15 sets the trend as a confirmed downside bearish trend that we expect will setup another new price low below 7400. The only thing that would change that is if the price were able to move above 7800 and establish a new higher high.
Lastly, here is the MC (S&P 400 MidCap) 240-minute chart. We love using the MIDCAP and TRAN charts because they often provide a much clearer picture of true price structure than the ES, YM and NQ charts do. Pay attention to the MAGENTA ARCS I’ve drawn on this chart. See anything interesting? I know that I see from this chart and why I believe my August 19th breakdown prediction is going to be accurate. Take a minute to study this chart and come to your own conclusion about the price structure.
There you have it, folks. We made a prediction about a July 2019 market top setup and an August 19 breakdown in price many months back. How did we know about these setups? We are using our proprietary price modeling and predictive modeling systems along with various technical analysis tools and years of study and research into technical analysis and price structures. We can attempt to use our proprietary tools to help traders, like you, stay well ahead of these moves and find greater profits.
All we have to do now is wait for the new rotation in price to either confirm or invalidate our breakdown analysis. At this point, it is all up to the price, investor confidence and “fear and greed”.
CONCLUDING THOUGHTS:
In short, you should be starting to get a feel of where each commodity and asset class is headed for the next 8+ months. The next step is knowing when and what to buy and sell as these turning points take place, and this is the hard part. If you want someone to guide you through the next 12-24 months complete with detailed market analysis and trade alerts (entry, targets and exit price levels) join my ETF Trading Newsletter.
Be prepared for these incredible price swings before they happen and learn how you can identify and trade these fantastic trading opportunities in 2019, 2020, and beyond with our Wealth Building & Global Financial Reset Newsletter. You won’t want to miss this big move, folks. As you can see from our research, everything has been setting up for this move for many months.
Join me with a 1 or 2-year subscription to lock in the lowest rate possible and ride my coattails as I navigate these financial market and build wealth while others lose nearly everything they own during the next financial crisis.
As a technical analysis and trader since 1997, I have been through a few bull/bear market cycles. I believe I have a good pulse on the market and timing key turning points for both short-term swing trading and long-term investment capital. The opportunities starting to present themselves will be life-changing if handled properly.
FREE GOLD OR SILVER WITH MEMBERSHIP!
Kill two birds with one stone and subscribe to get yourFREE PRECIOUS METAL (gold or silver) and get our trades that will make you wealthy during the next metalsbull market and financial crisis!
The world has truly entered uncharted waters with negative interest rates spreading so far and wide.
Frank Holmes, CEO of US Global Investors, recently noted that a whopping 25% of all bonds sold globally now carry a negative yield. “Investors” are even buying some “junk” rated bonds which will repay the bearer less than purchase price upon maturity.
Now European banks, who have been absorbing the European Central Bank’s 0.4% charge to hold deposits, are throwing in the towel and getting ready to pass those charges on to clients.
Wealthy depositors at the Swiss bank UBS will soon start paying the bank 3/4 percent to hold cash balances above 2 million Swiss francs. Some of those clients may turn to physical gold. For starters, the 0.75% negative interest rate to hold cash is roughly double the cost of storing $2 million in gold bullion.
And holding gold in allocated storage means investors don’t have to rely on an institution like UBS as their counterparty. The Swiss firm, like other major European banks including Deutsche Bank, is troubled. It has legal liabilities, including a $5 billion fine recently imposed for assisting clients in tax evasion.
The bank’s share price is back at the lows seen during the 2008 Financial Crisis. The Financial Times observed wealthy clients leaving UBS early in the year.
At this point, investors are wondering if UBS will survive. Yet remaining wealthy clients will be asked to pay the struggling bank for safeguarding large deposits. The UBS customer exodus could soon pick up speed.
There is something both broken and ominous about the spread of negative interest rates. In a healthy economy, lenders do not pay borrowers to take their money. And depositors do not pay their bank. Both scenarios are unnatural and unprecedented.
Central bankers, in all of their wisdom, are determined to force people with capital to deploy it. They want people to spend, to make capital investments, to continue buying real estate and stocks despite extraordinarily high valuations.
The trouble is that many investors are not seeing growth and opportunities for investment. Instead they seek safe haven. They buy more and more bonds with negative yields and they hold cash in the bank, despite the fact that deposits have earned nothing for years.
Meanwhile, perpetual inflation exacts its own toll on the purchasing power of all this capital.
To calculate the real cost of holding negative yielding bonds and deposits, the rate of inflation must be added. In Europe, consumer prices have been rising at a little over 1.5% per year. The true cost of holding large balances at UBS will soon exceed 2.25% annually.
First, zero interest rates failed. Then moving the rate for deposits to negative 0.4% failed as reluctant retail banks were slow to pass the cost along to their clients.
Now these banks are starting to fall in line. They have little choice as the ECB signals its intention to keep pushing, forcing rates even more deeply negative in the months ahead. Yet there is little reason to expect the central banker’s gambit to succeed this time.
If the wealthy did not find great opportunities everywhere for their capital when it yielded nothing, they aren’t likely to suddenly find them now that central bankers are turning the screws on them another crank.
Central bankers may convince wealthy people to pull cash from the banks, but they aren’t necessarily going to go on the desired spending spree. Our bet is that, instead, they will seek other safe havens, including precious metals.
The Money Metals News Service provides market news and crisp commentary for investors following the precious metals markets.
Glad to have you on the program to share the value proposition before us in Labrador Gold. We have a lot of ground to cover today but before we begin, Dr. Moss, please introduce us to Labrador Gold and what is the opportunity you present to the market?
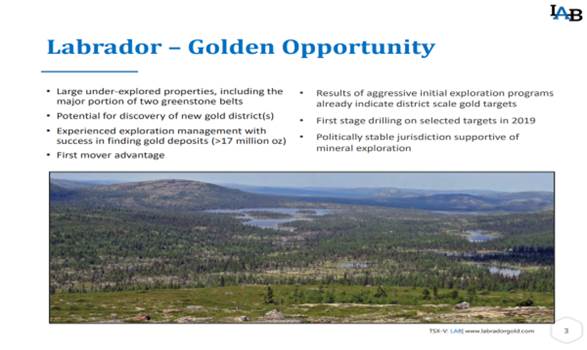
Roger Moss: Well, I think as the name implies, we are a junior mining company. We’re exploring for gold in Labrador. Labrador is part of a province on the eastern seaboard of Canada. It’s an area that has seen exploration in the past, but not for gold to any significant degree. So that’s one of the key factors for us is that looking for gold in under-explored terrains, where we have a good chance to find not just a gold deposit, but potentially a whole district.
Myself and Sean Ryan, who is our technical consultant, between the two of us we have a lot of experience in gold exploration and specifically in discovery of gold deposits. Sean, with his discoveries up in the Yukon on the other side of Canada and myself in Namibia when I was working with Anglo-American back in the in the early ’80s.
So I think that we have great properties in a good jurisdiction, that Labrador is very mining friendly, and it’s politically stable, which of course is very, very important for investors to know, concerning the companies that they’re investing in. So I think we have the properties, we have the people, and we have the jurisdiction, which is a pretty good start.
Maurice Jackson: You referenced one of the merits of Labrador Gold and that is in you’re in a safe jurisdiction, which is Canada. Dr. Moss, takes us to the region of Labrador and provide us with some historical context.
Roger Moss: Labrador, it’s had quite a long history of exploration and mining. Going back to the large iron ore discoveries and subsequent mines in Labrador, in the western Pipe Labrador, significant iron ore mines, which are still operating today. And that’s been going on since the early 1950s.
More recently we had a major copper nickel discovery at Voisey’s Bay in the early ’90s that sparked off an incredible staking rush where junior mining companies came in and staked a large part of Labrador, looking for more of the same kind of nickel and copper deposits.
And then finally, in the 2000s we had another rush for uranium and during that rush there was a small uranium deposit found, which is still not yet in production. So, we’ve had our share of major exploration periods but what you will have noticed is that none of those were really targeted towards gold. So there hasn’t been a sustained exploration for gold mineralization in Labrador to date.
Maurice Jackson: And speaking of gold, why does Labrador Gold have confidence in the probability of finding the next great discovery here?
Roger Moss: Well, I think part of it is because there has been so little exploration done in the past. We believe that the two projects that we have are very, very prospective with respect for gold. We expect to find a gold deposit but there’s also the chance that, because of the circumstances, we may actually find a gold district. And I can get into that a little bit more later but right now what we have is we’ve got two projects with gold anomalies, that’s gold in rocks or gold in soils, over tens of kilometers. And that’s really the district scale that we’re looking for.
Maurice Jackson: Let’s visit your project portfolio and take us to your flagship Hopedale Project and introduce us to the potential we have before us.
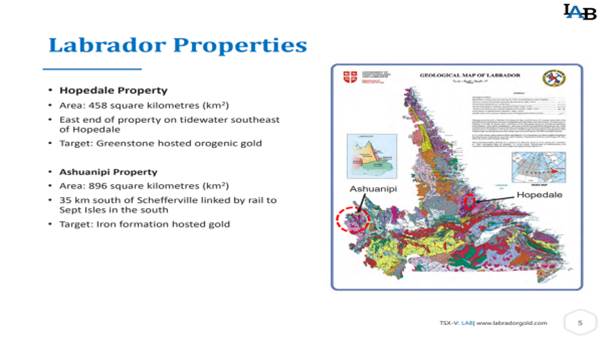
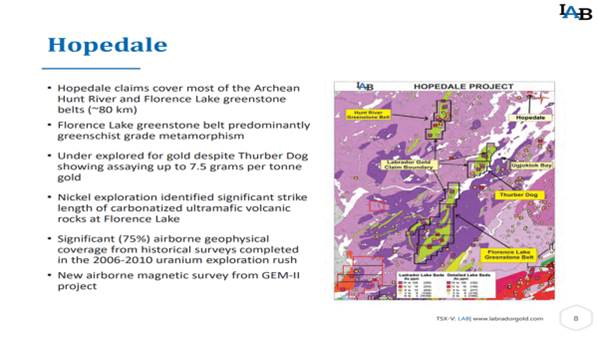
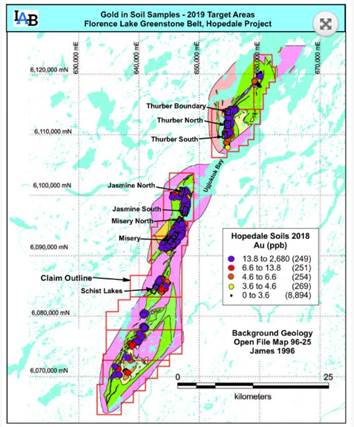
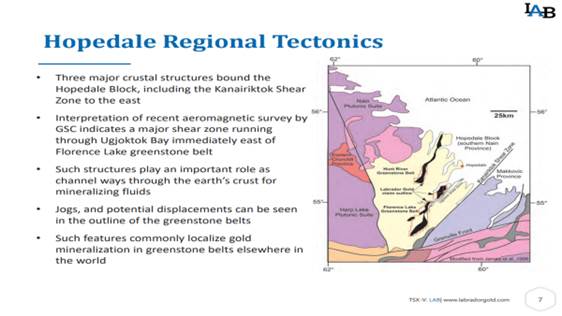
Roger Moss: Hopedale is a great example of what I was just talking about, the district scale. The Hopedale Project consists of basically licenses and claims that cover two greenstone belts, 90% of the two greenstone belts, the Hunt River Greenstone Belt and the Florence Lake Greenstone Belt. And greenstone belts are incredibly prolific hosts of gold mineralization in Canada and elsewhere in the world. And most of our work has been targeted towards the Florence Lake Greenstone Belt to date because that appears to be the most prospective from our initial work. And so we’ve now have approximately 50 kilometers of strike length, which has excellent prospectivity for gold.
That’s what we’ve been targeting and our targeting has really been focused on where along that 50 kilometer length are the best areas for us to really explore intensively to find that gold deposit. Now as I mentioned, we are looking at districts scale. 50 kilometers is a lot of ground to cover. We have anomalies all along that 50 kilometer length, they’re associated with geological contacts, which is typical of gold deposits in greenstone belts, so we’re very encouraged that this belt has the potential to provide not just a gold deposit, but potentially a gold district.
Maurice Jackson: The company has taken a systematic approach to gold exploration. Walk us through the process and share some of the results.
Roger Moss: The systematic approach is based on what our technical consultant Sean Ryan has done up in the Yukon. He’s had a lot of success up there as I mentioned earlier, and his work really revolves around taking these large areas and narrowing them down systematically. And there are only a few ways you can do that.
One way is to use airborne geophysics to look at where the structures might be on the ground and the other way is to use geochemistry and different types of sampling media that will get you into the area that you want to be in to focus your efforts. And the key here is to get to that area quickly and effectively. And both Sean and I have had really good success with using soil geochemistry, soil sampling, going from a very regional scale onto a very detailed scale to home in on the areas that have the best gold potential.
So that’s really the way that we’ve been working in the Florence Lake Greenstone Belt. Of course geology comes into it. We have used the airborne geophysics that’s available to us. So, these things also come into it but it’s really the geochemistry and the soil samples in particular that enable us to narrow down that 50 kilometer strike length to areas that have the highest potential.
Maurice Jackson: Is Labrador Gold actively drilling there now?
Roger Moss: No, not right now. We have been exploring over the last two years and, as I mentioned, our strategy is to systematically reduce the areas that we want to focus on. And, of course, when you get to the point where you’re drilling, you have to be very focused.
So what we’re doing this year, right now in fact, is we’re looking at eight areas that we have picked out from that 50 kilometer strike length and we’re focused on those areas. And out of those eight areas, we expect to find targets that we will be able to drill. We will be drilling later on in this season or early next season and it’ll be one or more of those eight targets that we’ll be drilling.
Maurice Jackson: You reference greenstone belts. Why are they important to this discussion?
Roger Moss: I’m a big fan of greenstone belts. I’ve worked quite a bit on greenstone belts in Canada, in Northern Ontario and in Quebec. And people in Canada understand them. They know what to look for when they’re investing in greenstone belts or companies exploring greenstone belts. And the reason for that is that in Canada, for example, the Abitibi Greenstone Belt in Ontario and Quebec has production and resources of over 200 million ounces, which is incredible. I mean it’s a large area, but still 200 million ounces is significant.
And one part of that greenstone belt, a small part of it, the Larder Lake gold camp, has produced about 14 and a half, 15 million ounces. And that footprint of that Larder Lake gold camp would fit in to the northern part of the Florence Lake Greenstone Belt. So again, we have similar rocks, we have gold mineralization, and we have the signs for not only a gold deposit, but for a gold district. So that’s why, to me, gold deposits in greenstone belts are so interesting.
Maurice Jackson: Let’s discuss some important topics germane to the Hopedale Project. Beginning with reversionary interests, are there any on the Hopedale Project?
Roger Moss: Yes, there are. Our partner Sean staked the ground, so we have an option from Sean. We are in the second year of four years, after which we would own 100% subject to a 2% royalty that Sean retains.
Maurice Jackson: We’re going to get into some numbers later in this discussion, but from a capital expenditure standpoint, how is infrastructure on your project?
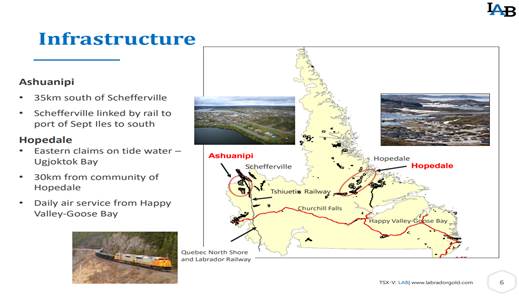
Roger Moss: Well, the infrastructure is actually pretty good. Most people when they think of Labrador and until recently, myself included, would consider that it’s way out in the middle of nowhere. But in the Hopedale Project, the greenstone belt lies along the eastern part of a bay which comes in from the Atlantic. So we are right on tidewater. Which obviously if you have a mine, or even an advanced project, is a huge plus because you can bring in supplies, fuel, equipment by boat rather than having to fly everything in to the camp or to the project.
So I think that while there are no roads, we do have that ability to bring equipment in and ship material out along that bay, which is right at, connects right to the Atlantic. So I think looking down the road, if we are successful there, any kind of mining project would be able to get the product out pretty easily.
Maurice Jackson: What is your relationship with First Nations?
Roger Moss: Our relationship with the First Nations is good. Right now of course our exploration is still in the early stage so there are no real bones of contention that come up at this point. But we do have a good relationship. We keep them informed of what we’re doing, we give them the results of what we’ve done. I usually go up to the community, give them a presentation both before and after each field season. And they’re generally very supportive.
We try as much as we can, despite being early-stage exploration, to hire the locals and they are appreciative of that. And also in the case of the Hopedale Project, we deal with the Nunatsiavut Government, which is a self-governing Inuit government. And that’s really good because we can also then hire some of their companies to do the support work for our exploration. So overall, yes. Very good relations.
Maurice Jackson: Are you fully permitted?
Roger Moss: Yes. We have to permit each year, prior to undertaking exploration. And again in the case of Hopedale, not only do we have to get permits from the Newfoundland and Labrador Department of Natural Resources, but also from the Nunatsiavut Government. And they are quite rigorous but we have all the permits that we need for this year.
Maurice Jackson: Is the ultimate goal for Labrador Gold to build a mine or make a discovery and then sell the Hopedale Project?
Roger Moss: Well as you can tell, we’re really explorers and not miners. I’ve never been involved in mining, I’ve always been an explorer throughout my career. And I think that companies can get into trouble if they switch from doing pure exploration and get into development and mining. So our ultimate goal would be to make a discovery and then advance it to the point where a gold mining company would be interested in taking it over. So yes, that’s the goal.
Maurice Jackson: We’ve discussed the good, let’s address the bad. What can go wrong and what is your action plan to mitigate that wrong?
Roger Moss: Well, I guess despite our best efforts, we could come up short and not find a gold deposit or even a significant gold mineralization. So that’s probably the worst case scenario. And, but in order to try and mitigate that, we have what I’ve laid out as our systematic exploration programs.
So we plan the program in such a way that at the end of each stage we can analyze the results and decide on whether to proceed or to leave it. And I think that’s important because if things aren’t turning out as well as you would like, you have to be willing to let it go sooner rather than later. There’s nothing worse than then holding onto a dead project for too long. So I think that both Sean and I and have the discipline to be able to do that. Obviously we still believe that we’re going to find something in Labrador. And I think that our exploration, as we’ve done to date, is still leading us that way.
And we’ll keep doing that. And, but if it does turn bad, we’ll be the first to say, “Okay we need to move on.” So I think it’s a discipline that one needs in order to assess the project, the stage that they’re at, and to make the decision unemotionally stay or move on.
Maurice Jackson: And I would add to that there’s nothing worse than an ego.
Roger Moss: Yes, I mean I think both Sean and I are fairly fortunate. We work well together and we don’t have too much ego, at least not that comes into decision making regarding our exploration.
Maurice Jackson: Switching gears, let’s discuss the people responsible for increasing shareholder value. Dr. Moss, please introduce us to your board of directors.
Roger Moss: We have four people on the board, in addition to myself. And they have diverse backgrounds. Jim Borland is well known in the mining industry here in Canada. He was the editor of The Northern Miner newspaper for a long time. He’s been leading junior mining companies in management positions and been on the board of directors of many junior mining companies and is currently actively involved with the Prospectors and Developers Association of Canada, who many of your readers may know put on the very popular PDAC conference every year in March, here in Toronto.
Trevor Boyd is an exploration geologist who I’ve known since we were at university together here in Toronto. He has a lot of experience in Canada and especially in greenstone belts, so he’s a very precious, precious addition to our board in that he’s available for me to bounce ideas off and I certainly take advantage of that. And I’ve also had Trevor out in the field looking at the rocks and getting his take on what they look like.
Then we have what I would call up two young guns, Leo Karabelas and Kai Hoffmann. Both of them are entrepreneurs in the mining industry. They have lots of experience in marketing in the mining industry and they help us in that respect. Kai, of course, is probably well known to some of your listeners as a speaker at a many mining and exploration conferences. And he also has a company called Soar Financial, which does a lot of marketing, a lot of putting together financial information, and especially with respect to the mining industry. So I think between the five of us, it’s a very rounded board and one that’s certainly focused on delivering value to our shareholders.
Maurice Jackson: Who is Dr. Roger Moss and what makes him qualified for the task at hand?
Roger Moss: Well, I’m an exploration geologist, as I mentioned. I’ve been involved in the mining industry for some time and worked worldwide. And as I mentioned earlier, we involved in the discovery of the Navachab gold deposit in Namibia, which went into production in 1994, I think, and it’s still in production now. It’s a multimillion ounce deposit and one that I’m proud to have been a part of.
I’ve also been involved in senior management of junior mining companies probably for the last 18 years or so and I’ve seen a lot of rocks and I think that’s one thing that you want in, certainly in a geologist. And to be able to have a good sense of what makes a project and what doesn’t. And really I think those are my main qualifications. The experience in both geology and in management positions of junior mining companies I think is really what I bring to the table.
Maurice Jackson: Who is on your management team and what skill sets do they bring to Labrador Gold?
Roger Moss: Our management team is a very small. It’s just myself, as president and CEO, and Aurora Davidson, the CFO. Aurora is a chartered accountant. She has significant experience in the mining industry and both in junior mining companies and in producing mining companies. And so she’s a great asset and makes sure that all our accounts and spending is on track and not going to go awry.
Maurice Jackson: Who do you have on your technical team?
Roger Moss: Well, I think I mentioned both Trevor and Sean already and so that’s basically the three of us. Sean and I generally work together to put together our exploration programs each year. Sean obviously has a lot of experience on the soil sampling side, but he’s also very good at thinking outside the box. I know that’s a cliché term, but he really does. And he comes up with innovative ways to advance exploration to the point where we can make that decision. So instead of going through the normal procedure, if there’s a way to get to the answer quicker, then Sean usually manages to come up with it. So it’s been great working with Sean.
As I mentioned myself, I’m more in the geological and on the geological side. So putting in the geological context. And I think the three of us together, Sean and I are doing the planning, Trevor reviewing the plans, adding his comments, I think that it’s a really good technical board and I think that’s why we’ve seen the success that we’ve had to date.
Maurice Jackson: Let’s get into some numbers. Please share the capital structure for Labrador Gold.
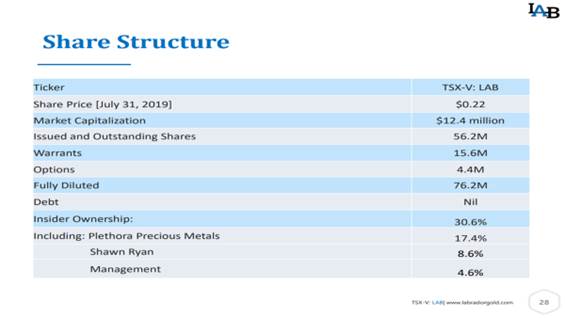
Roger Moss: Right now we’re sitting at 56 million shares outstanding. We have just over 15 million warrants, about four and a half million options, so we’re looking at about 75 million shares fully diluted.
Maurice Jackson: How much cash and cash equivalents do you have?
Roger Moss: Right now we have on the order of about CA$900,000. All the prices are in Canadian dollars, by the way.
Maurice Jackson: How much debt do you have?
Roger Moss: No debt.
Maurice Jackson: What is your burn rate?
Roger Moss: Our burn rate is on the order of $15,000 to $20,000 a month. It’s pretty lean. We keep it that way and we’re very fortunate that we can get it down that low. Me, being a geologist, I like to see as much money going into the ground as possible because that’s really what we’re trying to do here. We’re trying to invest in putting money into the ground and finding a deposit.
Maurice Jackson: Who are your major shareholders?
Roger Moss: Our major shareholder would be Plethora Precious Metals Fund. They’re based in the Netherlands and they own about 17% of the company. They’re very supportive, they’ve been shareholders for now for probably five or so years. They were very helpful in getting Labrador Gold started and introducing Sean and myself, so they’ve been a big part in how Labrador Gold looks today.
We also have some large high-net-worth investors and together they control about 35% and they’re also very supportive of our strategy. They like what we’re doing and they like the systematic way that we are, that we’re going about the exploration.
Maurice Jackson: How about management? How much do they own?
Roger Moss: Management probably owns about 4%.
Maurice Jackson: And what is the float?
Roger Moss: Well when you add it all up and subtract the remainder, we have about 35% in the float.
Maurice Jackson: Are there any redundant assets on the books that we should know about?
Roger Moss: Nope.
Maurice Jackson: Are there any change of control fees and if yes, what is the compensation?
Roger Moss: Yes, I have a change of control clause in my management contract and that’s equivalent to about six months of fees.
Maurice Jackson: Is management charging a consultant fee for any services?
Roger Moss: Yes, both the CFO and I charge consulting fees.
Maurice Jackson: Can you expand on that sir?
Roger Moss: Together we charge about $10,000 a month.
Maurice Jackson: In closing, multilayer question here, what is the next unanswered question for Labrador Gold? When can we expect a response and what determines success?
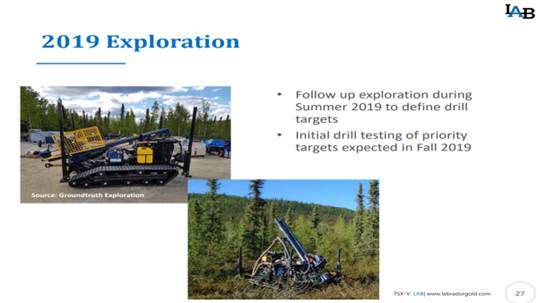
Roger Moss: Well, obviously the big question that we’re trying to answer is where is that significant gold deposit. And I think that the next step for us is we have to define the drill targets in order to get the draw on the property and test our theories, test the exploration that we’ve done to date. That work is underway right now. We expect results by the end of the month, let’s say end of August.
And success in that will allow us to undertake a drill program in the fall that should test one or more of those targets that come out of the current exploration. So, ultimately in order to discover that deposit, which is what we’re trying to do, we need to intersect some significant gold mineralization and drill program. So if we can do that, that will be success in my mind.
Maurice Jackson: What keeps you up at night that we don’t know about?
Roger Moss: Well, I sleep pretty well.
Maurice Jackson: Good.
Roger Moss: I’m not usually up at night. But one of the big things for me is always finding enough money to keep the exploration going. And I, as I said, we’re not big spenders on General & Administrative costs, but having significant exploration programs, that needs to be funded. So financing is always, always on my mind and I just want to make sure that we have the funds to be able to do the exploration that we need to do to find that deposit.
The other thing that, it doesn’t really keep me up at night but it’s something that I think about often, is the fact that a lot of the shareholders in Labrador Gold I know personally; they’ve been with us for a long, long time and so I don’t want to let them down. And so I want to make sure that what we’re doing as a company is going to generate returns for them.
Maurice Jackson: Dr. Moss, last question and that is what did I forget to ask?
Roger Moss: Well, I think it’s been pretty thorough. The only thing I would probably add is that, just mention the financing. And we will be doing a financing in the near term here to fund our ongoing exploration. And so we’ll be expecting to announce the terms of that financing soon. Other than that, I think your listeners have got a good introduction to Labrador Gold and our properties and I hope that they’ve got some information to think about.
Maurice Jackson: Well, Dr. Moss for someone listening that wants to get more information about Labrador Gold, please share the website address.
Roger Moss: Oh, it’s pretty simple, it’s www.labradorgold.com. And for those of you out there using social media, we’re also on Facebook and on Twitter at @LabGoldCorp.
Maurice Jackson: For direct inquiries, call (416) 704-8291 or you may email [email protected].
Labrador Gold trades on the TSX.V: LAB | OTCQX: NKOSF.
Before you make your next bullion purchase, make sure you call me. I’m a licensed representative for Miles Franklin Precious Metals Investments, where we provided a number of options to expand your precious metals portfolio from physical delivery, offshore depositories, precious metal IRAs, and private block chain distributed ledger technology.
Call me directly, at (855) 505-1900 or you may email [email protected]. Finally, please subscribe to provenandprobable.com for mining insights and bullion sales.
Dr. Roger Moss of Labrador Gold, thank you for joining us today on Proven and Probable.
Maurice Jackson is the founder of Proven and Probable, a U.S. based media company that has a dual prong approach. The first prong identifies undervalued junior mining opportunities, conducts site visits around the world, and interviews CEOs of companies that are on major world stock exchanges and some of the most respected names in the natural resource space. The second prong, Proven and Probable is an independent licensed representative of Miles Franklin to sell physical precious metals in a number of options to expand a precious metals portfolio, offering physical delivery to home or business of gold, silver, platinum, palladium and rhodium, a fully insured offshore depository, as well as precious metals IRAs, and ledger private blockchain distributed ledger technology stored at the Royal Canadian Mint.
Disclosure: 1) Maurice Jackson: I, or members of my immediate household or family, own shares of the following companies mentioned in this article: None. I personally am, or members of my immediate household or family are, paid by the following companies mentioned in this article: None. My company has a financial relationship with the following companies mentioned in this article: None. Proven and Probable disclosures are listed below. 2) The following companies mentioned in this article are billboard sponsors of Streetwise Reports: None. Click here for important disclosures about sponsor fees. 3) Statements and opinions expressed are the opinions of the author and not of Streetwise Reports or its officers. The author is wholly responsible for the validity of the statements. The author was not paid by Streetwise Reports for this article. Streetwise Reports was not paid by the author to publish or syndicate this article. The information provided above is for informational purposes only and is not a recommendation to buy or sell any security. Streetwise Reports requires contributing authors to disclose any shareholdings in, or economic relationships with, companies that they write about. Streetwise Reports relies upon the authors to accurately provide this information and Streetwise Reports has no means of verifying its accuracy. 4) This article does not constitute investment advice. Each reader is encouraged to consult with his or her individual financial professional and any action a reader takes as a result of information presented here is his or her own responsibility. By opening this page, each reader accepts and agrees to Streetwise Reports’ terms of use and full legal disclaimer. This article is not a solicitation for investment. Streetwise Reports does not render general or specific investment advice and the information on Streetwise Reports should not be considered a recommendation to buy or sell any security. Streetwise Reports does not endorse or recommend the business, products, services or securities of any company mentioned on Streetwise Reports. 5) From time to time, Streetwise Reports LLC and its directors, officers, employees or members of their families, as well as persons interviewed for articles and interviews on the site, may have a long or short position in securities mentioned. Directors, officers, employees or members of their immediate families are prohibited from making purchases and/or sales of those securities in the open market or otherwise from the time of the interview or the decision to write an article until three business days after the publication of the interview or article. The foregoing prohibition does not apply to articles that in substance only restate previously published company releases.
Proven and Probable LLC receives financial compensation from its sponsors. The compensation is used is to fund both sponsor-specific activities and general report activities, website, and general and administrative costs. Sponsor-specific activities may include aggregating content and publishing that content on the Proven and Probable website, creating and maintaining company landing pages, interviewing key management, posting a banner/billboard, and/or issuing press releases. The fees also cover the costs for Proven and Probable to publish sector-specific information on our site, and also to create content by interviewing experts in the sector. Monthly sponsorship fees range from $1,000 to $4,000 per month. Proven and Probable LLC does accept stock for payment of sponsorship fees. Sponsor pages may be considered advertising for the purposes of 18 U.S.C. 1734.
The Information presented in Proven and Probable is provided for educational and informational purposes only, without any express or implied warranty of any kind, including warranties of accuracy, completeness, or fitness for any particular purpose. The Information contained in or provided from or through this forum is not intended to be and does not constitute financial advice, investment advice, trading advice or any other advice. The Information on this forum and provided from or through this forum is general in nature and is not specific to you the User or anyone else. You should not make any decision, financial, investments, trading or otherwise, based on any of the information presented on this forum without undertaking independent due diligence and consultation with a professional broker or competent financial advisor. You understand that you are using any and all Information available on or through this forum at your own risk.
The rationale for investing in this Canadian mining company is given in this BMO Capital Markets report.
In an Aug. 13 research note, analyst Ryan Thompson reported that BMO Capital Markets initiated coverage on New Pacific Metals Corp. (NUAG:TSX.V; NUPMF:OTCQX) with an Outperform (Speculative) rating and a CA$3.75 per share target price. The stock is currently trading at around CA$2.64 per share.
Thompson presented the company highlights.
One, Silver Sand, New Pacific’s flagship project in Bolivia, could become a “very large, profitable project,” he wrote, based on the scale of the land package, the mineralization already discovered at the main Silver Sand area and the prospective mineralized zones. “These projected zones show characteristics similar to Silver Sand, as evidenced by artisanal mining and represent several additional drill targets to be tested,” added Thompson.
Two, silver majors Silvercorp Metals and Pan American Silver invested in Silver Sand, which BMO interprets as a “vote of confidence” in the project.
Three, New Pacific is on the cusp of completing a resource estimate for Silver Sand. The report is expected by year-end 2019 with a preliminary economic assessment to follow in 2020.
Four, Silver Sand is a rarity in that few silver developments projects exist in the world. As such, it is a “scarce deposit with a high amount of leverage to the silver price,” Thompson commented.
Five, New Pacific signed a mining production contract (MPC) with Bolivia’s state mining entity, COMIBOL, the first ever between it and a private company. The MPC “outlines a less onerous set of conditions compared to laws that were established previously,” Thompson explained. “We note that the MPC must still be passed through parliament to be ratified into law.”
Despite the MPC, country risk remains, Thompson pointed out. That and Silver Sand’s early stage warrant the Speculative in BMO’s rating on New Pacific.
The bottom line, Thompson noted, is that “as Silver Sand continues to advance, we see the potential for shares to rerate higher if the market gains a better understanding of the potential scale and economics of the project via delivery of an NI 43-101 resource estimate at year-end.”
Disclosure: 1) Doresa Banning compiled this article for Streetwise Reports LLC and provides services to Streetwise Reports as an independent contractor. She or members of her household own securities of the following companies mentioned in the article: None. She or members of her household are paid by the following companies mentioned in this article: None. 2) The following companies mentioned in this article are billboard sponsors of Streetwise Reports: None. Click here for important disclosures about sponsor fees. 3) Comments and opinions expressed are those of the specific experts and not of Streetwise Reports or its officers. The information provided above is for informational purposes only and is not a recommendation to buy or sell any security. 4) The article does not constitute investment advice. Each reader is encouraged to consult with his or her individual financial professional and any action a reader takes as a result of information presented here is his or her own responsibility. By opening this page, each reader accepts and agrees to Streetwise Reports’ terms of use and full legal disclaimer. This article is not a solicitation for investment. Streetwise Reports does not render general or specific investment advice and the information on Streetwise Reports should not be considered a recommendation to buy or sell any security. Streetwise Reports does not endorse or recommend the business, products, services or securities of any company mentioned on Streetwise Reports. 5) From time to time, Streetwise Reports LLC and its directors, officers, employees or members of their families, as well as persons interviewed for articles and interviews on the site, may have a long or short position in securities mentioned. Directors, officers, employees or members of their immediate families are prohibited from making purchases and/or sales of those securities in the open market or otherwise from the time of the interview or the decision to write an article until three business days after the publication of the interview or article. The foregoing prohibition does not apply to articles that in substance only restate previously published company releases. As of the date of this interview, officers and/or employees of Streetwise Reports LLC (including members of their household) own securities of New Pacific Metals, a company mentioned in this article.
Disclosures from BMO Capital Markets, New Pacific Metals Corp., August 13, 2019
IMPORTANT DISCLOSURES
Analyst’s Certification I, Ryan Thompson, hereby certify that the views expressed in this report accurately reflect my personal views about the subject securities or issuers. I also certify that no part of my compensation was, is, or will be, directly or indirectly, related to the specific recommendations or views expressed in this report.
Analysts who prepared this report are compensated based upon (among other factors) the overall profitability of BMO Capital Markets and their affiliates, which includes the overall profitability of investment banking services. Compensation for research is based on effectiveness in generating new ideas and in communication of ideas to clients, performance of recommendations, accuracy of earnings estimates, and service to clients.
Analysts employed by BMO Nesbitt Burns Inc. and/or BMO Capital Markets Limited are not registered as research analysts with FINRA. These analysts may not be associated persons of BMO Capital Markets Corp. and therefore may not be subject to the FINRA Rule 2241 restrictions on communications with a subject company, public appearances and trading securities held by a research analyst account.
Company Specific Disclosures
Disclosure 5: BMO Capital Markets or an affiliate received compensation for products or services other than investment banking services within the past 12 months from Pan American Silver and Silvercorp Metals.
Disclosure 6C: Pan American Silver and Silvercorp Metals are clients (or were clients) of BMO Nesbitt Burns Inc., BMO Capital Markets Corp., BMO Capital Markets Limited or an affiliate within the past 12 months: C) Non-Securities Related Services.
Disclosure 16: A research analyst has extensively viewed the material operations of New Pacific Metals Corp.
Disclosure 17: New Pacific Metals Corp has paid or reimbursed some or all of the research analyst’s travel expenses.
Disclosure 19: BMO Nesbitt Burns Inc. (“BMO NBI”) has provided a fairness opinion to the Special Committee of the Board of Directors of Tahoe Resources Inc. in connection with the definitive agreement entered into with Pan American Silver Corp. BMO NBI has been paid a fee. BMO NBI follows information control procedures which prevent its research analysts who are issuing research from having access to non-public information received by BMO NBI’s investment banking personnel in connection with the transaction. Accordingly, it is possible that individual employees at BMO NBI may have material non-public information or opinions which are not included in, and may not be consistent with, the information and advice in this research report.
For Important Disclosures on the stocks discussed in this report, please click here.
 Current situation: