NZ Exports & The RBNZ Fallout

By Orbex

Later today, we have an important data release from New Zealand; the bi-weekly GDT Price Index. The figure plays an important role in determining the evolution of the currency. There has also been quite a lot going on lately that needs to be considered when gauging the impact.

While not dependant on interest rates, this is the first time we get data that’s from after the RBNZ’s surprise 50 point cut in the reference rate. Analysts had been pricing in at least two cuts by the end of the year. However, not many predicted that they would come at once. Exports are certainly affected by monetary policy, which completes the triangulation with the exchange rate.

What We are Looking For

For today’s data, we are expecting dairy prices to remain under pressure and dip a further -0.7%. This is compared to -2.6% in the prior fortnight. The index slipped back into the negative during the summer. This was as the supply and demand imbalance was corrected slightly, in part due to the increasing costs that were seen during the beginning of the year.

Going forward, the largest publicly traded dairy company projects prices to remain relatively high for the rest of the year. In their latest report to investors, Danone reported seeing the supply issues of the beginning of the year neutralizing. This would lead to a stabilized price with modest growth. The sentiment was echoed in Saputo’s quarterly report.

Tariffs and the Milk Market

One of the points to keep in mind when trading the NZD is the effect of the trade war. This is considering the country’s dependence on the export of dairy products. While the US certainly isn’t threatening New Zealand with trade action, they are the world’s largest producer of dairy. At the beginning of the year the US had dairy-trade-related issues with one of their largest customers, Canada; and the threat of potential tariffs increases the risk of sourcing dairy from the US.

The end result is that on top of the supply problems due to higher demand, the trade disruptions around the largest producer causes generalized anxiety and supports the price. China is a net importer of dairy products, and agricultural products are one of the sectors being used as leverage in the US trade discussions.

The Domestic Effect

Although New Zealand has taken considerable steps to diversify its economy, dairy still accounts for one-third of the country’s export profits. It has an impact on the evolution of the currency. With the consensus among dairy buyers that prices will be on the rise for the rest of the year, it’s one of the factors that contribute to supporting the Kiwi.

Of course, this is not enough to offset the dovish tone set by the RBNZ’s Governor, even after the 50 basis point cut. Many analysts are factoring in another cut to 0.75% by the end of the year.

Careful What You Wish For

While generally lower rates are seen as supportive of the economy, some in the business community in New Zealand aren’t happy with the RBNZ’s latest actions. The bank has a tradition of being very conservative and cautious with its actions. The sudden rate cut seems to be deviating from that perspective.

The increase in uncertainty about how the bank will act in the future is disconcerting for some businesses, especially related to the financial sector. Trying to jog the market by taking more aggressive action might backfire. The talk of needing more action by the central bank in the future is an indication that they don’t expect the economy to improve soon, either.

By Orbex
 

GBPCAD Analysis: Getting ready for important events

By IFCMarkets

Getting ready for important events

In this review, we suggest to consider the British pound against the Canadian dollar. Is the GBPCAD quotation growth possible? Such dynamics are observed with the weakening of the Canadian dollar and the strengthening of the British pound.

The main positive factor for the British pound is the possibility of concluding an agreement on Britain’s exit from the European Union. Previously, the parties could not agree, which created high economic risks for the British economy and its currency. Recall that Brexit should be held on October 31, 2019. On August 24-26, 2019, the G7 summit will be held in France. British Prime Minister Boris Johnson intends to hold a series of meetings with European leaders as part of this event, starting with a meeting with French President Emmanuel Macron on August 22. In conclusion, he will hold talks with US President Donald Trump. If successful, the outcome of the visit of Boris Johnson may be a positive factor for the pound. In turn, important data on inflation for July will be published in Canada on August 21, 2019. It can affect the monetary policy of the Bank of Canada. Its next meeting will be held on September 4.

GBPCAD

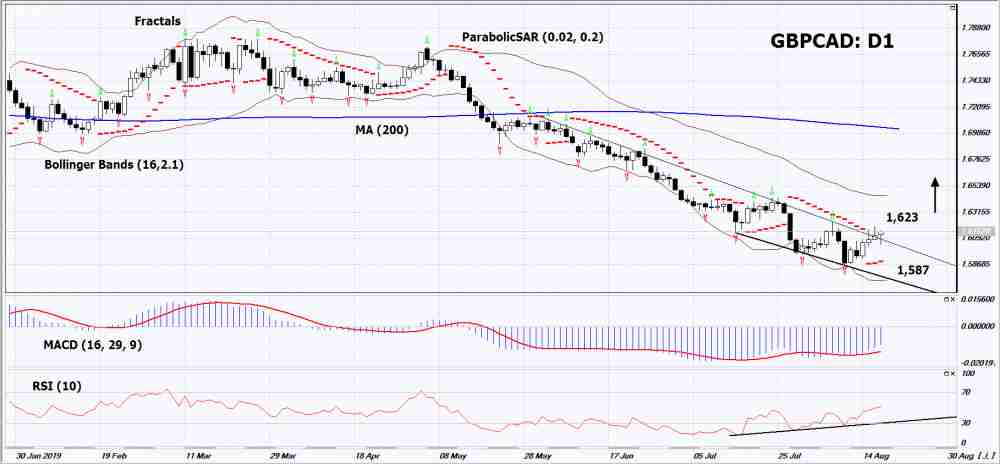
On the daily timeframe GBPCAD: D1 exceeded the downtrend. Further growth of quotes is possible in case of successful Brexit and a decrease of inflation in Canada.

  • The Parabolic indicator demonstrates a signal to increase.
  • The Bolinger bands widened, indicating high volatility. Both Bollinger Lines Slope Up.
  • The RSI indicator is above the 50 mark. It has formed a triple divergence.
  • The MACD indicator gives a bullish signal.

The bullish momentum may develop if GBPCAD exceeds its last upper fractal: 1.623. This level can be used as an entry point. The initial stop lose may be placed below the last lower fractal and the Parabolic signal: 1.587. After opening the pending order, the stop shall be moved following Bollinger and Parabolic signals to the next fractal minimum. Thus, we are changing the potential profit/loss to the breakeven point. More risk-averse traders may switch to the 4-hour chart after the trade and place a stop loss moving it in the direction of the trade. If the price meets the stop level (1,587) without reaching the order (1,623), we recommend to cancel the order: the market sustains internal changes that were not taken into account.

Technical Analysis Summary

PositionBuy
Buy stopAbove 1,623
Stop lossBelow 1,587

Market Analysis provided by IFCMarkets

Japanese Candlesticks Analysis 20.08.2019 (EURUSD, USDJPY)

Article By RoboForex.com

EURUSD, “Euro vs. US Dollar”

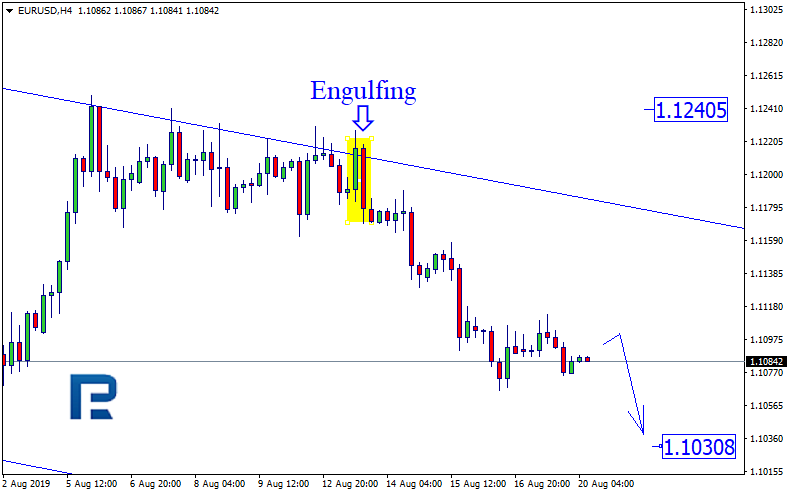
As we can see in the H4 chart, after completing Engulfing pattern, EURUSD has rebounded from the descending channel’s upside border. Right now, the pair is being corrected to the downside. After finishing the pullback, the price may fall towards 1.1030 to continue forming the descending channel. However, one shouldn’t exclude a possibility that the price may break the resistance level and continue growing towards 1.1240.

EURUSD
Risk Warning: the result of previous trading operations do not guarantee the same results in the future

USDJPY, “US Dollar vs. Japanese Yen”

As we can see in the H4 chart, after testing the channel’s downside border and forming several reversal patterns, including Hammer, close to the support level, USDJPY has rebounded from it. Right now, it is being corrected after forming another correction. Judging by the previous movements, it may be assumed that the price may reach 108.00 to continue forming the descending channel. However, we shouldn’t ignore a possibility that the instrument may return to the support line at 105.10.

USDJPY

Article By RoboForex.com

Attention!
Forecasts presented in this section only reflect the author’s private opinion and should not be considered as guidance for trading. RoboForex LP bears no responsibility for trading results based on trading recommendations described in these analytical reviews.

Ichimoku Cloud Analysis 20.08.2019 (AUDUSD, NZDUSD, USDCAD)

Article By RoboForex.com

AUDUSD, “Australian Dollar vs US Dollar”

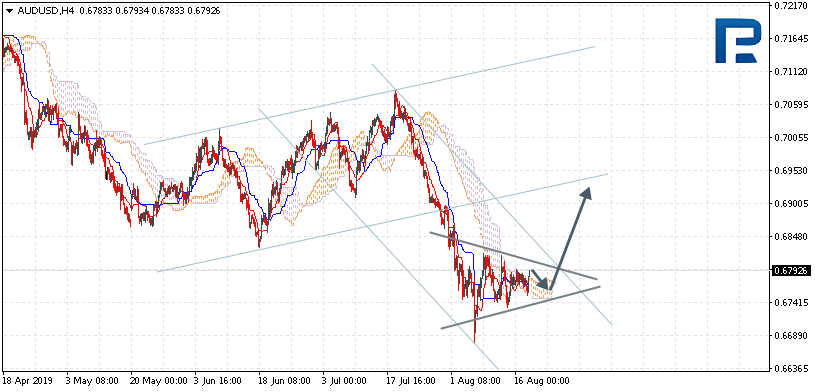
AUDUSD is trading at 0.6792; the instrument is moving above Ichimoku Cloud, thus indicating an ascending tendency. The markets could indicate that the price may test the cloud’s upside border at 0.6780 and then resume moving upwards to reach 0.6905. Another signal to confirm further ascending movement is the price’s rebounding from the support level. However, the scenario that implies further growth may be canceled if the price breaks the cloud’s downside border and fixes below 0.6730. In this case, the pair may continue falling towards 0.6625. After breaking Triangle’s upside border and fixing above 0.6825, the price may continue moving upwards.

AUDUSD
Risk Warning: the result of previous trading operations do not guarantee the same results in the future

NZDUSD, “New Zealand Dollar vs US Dollar”

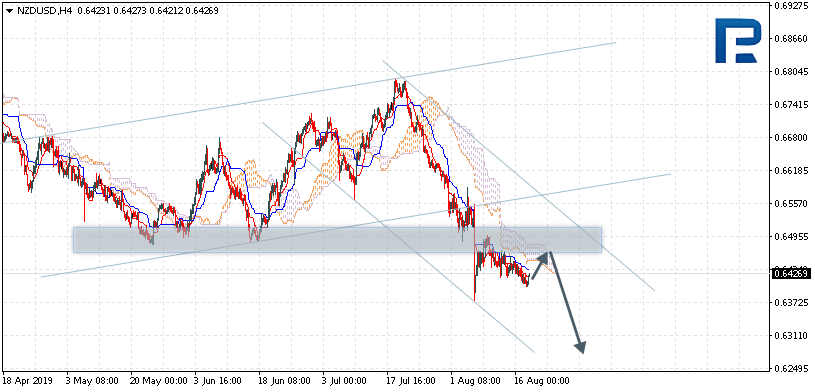
NZDUSD is trading at 0.6426; the instrument is moving below Ichimoku Cloud, thus indicating a descending tendency. The markets could indicate that the price may test the cloud’s upside border at 0.6435 and then resume moving downwards to reach 0.6300. Another signal to confirm further descending movement is the price’s rebounding from the resistance level. However, the scenario that implies further decline may be canceled if the price breaks the cloud’s upside border and fixes above 0.6510. In this case, the pair may continue growing towards 0.6605.

NZDUSD
Risk Warning: the result of previous trading operations do not guarantee the same results in the future

USDCAD, “US Dollar vs Canadian Dollar”

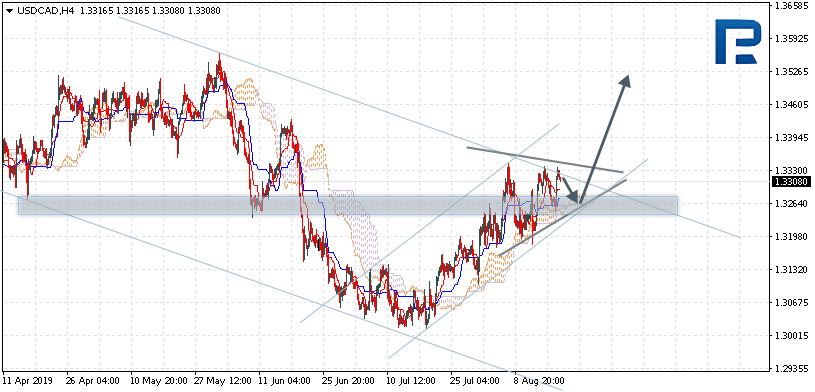
USDCAD is trading at 1.3308; the instrument is moving above Ichimoku Cloud, thus indicating an ascending tendency. The markets could indicate that the price may test the cloud’s upside border at 1.3270 and then resume moving upwards to reach 1.3525. Another signal to confirm further ascending movement is the price’s rebounding from the support level. However, the scenario that implies further growth may be canceled if the price breaks the cloud’s downside border and fixes below 1.3225. In this case, the pair may continue falling towards 1.3135. After breaking the descending channel’s upside border and fixing above 1.3355, the price may continue moving upwards.

USDCAD

Article By RoboForex.com

Attention!
Forecasts presented in this section only reflect the author’s private opinion and should not be considered as guidance for trading. RoboForex LP bears no responsibility for trading results based on trading recommendations described in these analytical reviews.

USD Remains Bid Over Quiet Week

By Orbex

USD Still Bid

Over a quiet week, the US dollar traded further to the upside on Tuesday morning. USD index continued to grind higher during the early European session with price moving back above the 98.22 level to trade 98.25 last. There is little in the way of data this week to impact flows, though traders will be paying close attention to the FOMC meeting minutes due tomorrow.

ECB Easing Expectations Cap EUR

EURUSD remains under pressure today with price having failed to make it back above the 1.1112 level yesterday. Fears of a prolonged slowdown in the eurozone are keeping expectations of fresh ECB easing elevated. The market is widely expecting the bank to announce measures in September, keeping the near-term bias for EUR weighted to the downside.

Brexit Fears Weighing on GBP

GBPUSD is trading heavily once more today as the ongoing fallout from the leaked Yellowhammer document weighs on price. The market is growing increasingly fearful that the UK is headed for a no-deal Brexit. According to some of the projection made in the report, the consequences could be disastrous. GBPUSD trades 1.2095 last with price fighting to stay above the bearish channel lows for now.

Risk Assets

Risk assets remain bid today though flows are very light. The market continues to trade off cautious-optimism around ongoing US/China trade negotiations. The situation remains fragile, however, and China has warned that the US that involvement in the situation with Hong Kong will jeopardize a deal. SPX500 trades 2926.18 last with price fighting to get back above the 2932.54 level.

Safe Haven Inflows Return

Safe havens have been firmer again today. The risk of a recession in the US, as well as the ongoing risks from the trade war and Brexit, have seen JPY and gold both higher against USD over the session so far.XAUUSD trades 2923.93 last while USDJPY trades 106.33. Price remains capped by the 106.77 level, for now, keeping focus on further downside.

Crude Capped By Trendline

Oil prices have come back under sharp selling pressure so far today following a further rejection at the bearish trend line from July highs. Crude has recovered well over recent sessions following the emergence last week of US recession fears. It now remains capped by lingering concerns around the US/China trade story. Crude trades 55.93 last.

AUD Up, CAD Down

USDCAD continues to march higher today. A firmer USD and a return to weakness in oil prices have seen CAD coming under pressure once again. USDCAD trades 1.3329 last with price trading firmly back above the 1.33 level.

AUDUSD remains bid today, despite the moves lower in oil and risk sentiment. A recovery in gold prices is helping underpin AUD which is still fighting to hold above the .6758 level.

By Orbex


Trump Calls On Fed To Cut Rates By 1%

By Orbex

Despite coming under widespread criticism for such incidents in the past, Trump has once again publicly declared his views on how he wants the Fed to act. Taking to his favorite medium of Twitter, the US president wrote yesterday that:

 “The Fed Rate, over a fairly short period of time, should be reduced by at least 100 basis points, with perhaps some quantitative easing as well. If that happened, our Economy would be even better, and the World Economy would be greatly and quickly enhanced-good for everyone!”

Trump has consistently attacked the Fed over its monetary tightening over the last year. When the Fed was finally forced to cut rates in July due to the negative economic impact from Trump’s trade war, the president bemoaned the .25% cut saying the bank should have opted for a larger cut.

Many, from across the political divide have scorned the president for attempting to influence the Fed’s decision making. Indeed, earlier this month the Wall Street Journal published an open letter signed by four former Fed chairmen. They called for the independence of the Fed to be maintained and for the bank to be able to act free from political pressure.

Given the fresh escalation in trade tensions between the US and China, and the negative impact inflicted on the global economy, expectations of further easing from the Fed have increased recently. Last week, movements in US treasury yields raised fears about an imminent recession in the US. The yield on 2Y USTs moved above the yield on the 10Y note for the first time since 2007. Typically, such a move has tended to precede a recession in the US.

Key Comments

However, Trump and his team have been quick to dispel rumors of a recession. They continue to reassure the public that the economy is in good health. White House adviser Larry Kudlow said:

“I don’t see a recession at all…Consumers are working. At higher wages. They are spending at a rapid pace. They’re actually saving also while they’re spending – that’s an ideal situation.”

These comments were echoed by White House Adviser Pete Navarro who said:

“We have the strongest economy in the world and money is coming here for our stock market. It’s also coming here to chase yield in our bond markets.”

Indeed, the president himself told reporters:

“We have the strongest economy, by far, in the world.”

Market Looking For September Rate Cut

The market is widely expecting the Fed to cut rates again this year. This is despite the Fed downplaying the prospect of further easing when it cut rates in July. However, given the deterioration in global conditions since then, market pricing is increasingly reflecting the view that the Fed will cut rates at its next meeting on September 18th. This will come with further rate cuts expected over Q4. At this point in time, the market is only looking for a further .15% cut. Therefore, the question is whether the Fed will cut rates in line again, or opt for a bigger move?

Technical Perspective

usd index

The USD Index continues to grind higher within the rising wedge pattern which has framed price action since Q3 2017. However, momentum has started to wane over recent months with price struggling to break above the 98.22 level. The RSI indicator is also flagging bearish divergence. This is highlighting the risk of a reversal lower in the medium term. To the downside, the main support levels to watch are sitting at 94.87–95.42. A break of these levels would pave the way for a much deeper move lower in USD.

By Orbex


The Analytical Overview of the Main Currency Pairs on 2019.08.20

by JustForex

The EUR/USD currency pair

Technical indicators of the currency pair:
  • Prev Open: 1.10921
  • Open: 1.10776
  • % chg. over the last day: -0.11
  • Day’s range: 1.10776 – 1.10885
  • 52 wk range: 1.1034 – 1.1817

The EUR/USD currency pair continues to consolidate. The technical picture is ambiguous. At the moment, the local support and resistance levels are: 1.10650 and 1.10950, respectively. The US president again criticized the Fed for a “strong” dollar. Donald Trump believes that the Central Bank in the near future should consider reducing the key interest rate by 100 basis points. We recommend opening from key levels.

In July, the producer price index in Germany rose by 0.1% compared with the forecasted value of 0.0%.

EUR/USD

Indicators point to the strength of sellers: the price has fixed below 50 MA and 100 MA.

The MACD histogram is in the negative zone but above the signal line, which gives a weak signal to sell EUR/USD.

The Stochastic Oscillator is in the neutral zone, the %K line is below the %D line, which also indicates a bearish sentiment.

Trading recommendations
  • Support levels: 1.10650, 1.10500
  • Resistance levels: 1.10950, 1.11300, 1.11650

If the price consolidates below the level of 1.10650, expect a further drop toward 1.10300-1.10000.

Alternatively, the price could grow toward 1.11200-1.11400.

The GBP/USD currency pair

Technical indicators of the currency pair:
  • Prev Open: 1.21500
  • Open: 1.21236
  • % chg. over the last day: -0.19
  • Day’s range: 1.21174 – 1.21380
  • 52 wk range: 1.2015 – 1.3385

An ambiguous technical picture has developed on the GBP/USD currency pair. The pound is currently in lateral movement. The key support and resistance levels are: 1.21000 and 1.21400, respectively. GBP/USD quotes have the potential for further growth. Market participants are waiting for new information regarding the Brexit process. Positions must be opened from key levels.

The Economic News Feed for 20.08.2019 is calm.

GBP/USD

Indicators do not give accurate signals: the price has fixed between 50 MA and 100 MA.

The MACD histogram is near the 0.

The Stochastic Oscillator is in the neutral zone, the %K line is below the %D line, which indicates a bearish sentiment.

Trading recommendations
  • Support levels: 1.21000, 1.20750, 1.20450
  • Resistance levels: 1.21400, 1.21750, 1.21900

If the price consolidates above 1.21400, expect further growth toward 1.21750-1.22000.

Alternatively, the price could decrease toward 1.20750-1.20600.

The USD/CAD currency pair

Technical indicators of the currency pair:
  • Prev Open: 1.32694
  • Open: 1.33234
  • % chg. over the last day: +0.39
  • Day’s range: 1.33087 – 1.33307
  • 52 wk range: 1.2727 – 1.3664

Yesterday, aggressive purchases were observed on the USD/CAD currency pair. Quotation growth exceeded 60 points. The CAD reached key extremes. At the moment, the trading instrument is consolidating in the range of 1.33000-1.33400. We do not exclude further growth of the USD / CAD currency pair. Today, the news background on the Canadian economy is quite calm. We recommend paying attention to the dynamics of oil quotes. Positions must be opened from key levels.

At 15:30 (GMT+3:00) we expect data on sales in the manufacturing sector of Canada.

USD/CAD

Indicators do not give accurate signals: 50 MA crossed 100 MA.

The MACD histogram is in the positive zone, but below the signal line, which gives a weak signal to buy USD/CAD.

The Stochastic Stochastic Oscillator is in the neutral zone, the %K line crossed the %D line. There are no signals at the moment.

Trading recommendations
  • Support levels: 1.33000, 1.32750, 1.32500
  • Resistance levels: 1.33400, 1.33700, 1.34000

If the price consolidates above 1.33400, expect further growth toward 1.33700-1.34000.

Alternatively, the price could drop toward 1.32750-1.32600.

The USD/JPY currency pair

Technical indicators of the currency pair:
  • Prev Open: 106.250
  • Open: 106.624
  • % chg. over the last day: +0.24
  • Day’s range: 106.429 – 106.692
  • 52 wk range: 104.97 – 114.56

The USD/JPY currency pair continues to consolidate. The technical picture is still mixed. At the moment, ецщ local support and resistance levels can be distinguished: 106.300 and 106.700. A trading instrument has a potential for growth. Participants in financial markets expect additional drivers. We recommend that you pay attention to the yield dynamics on the US Treasury bonds. Positions must be opened from key levels.

The Economic News Feed for 20.08.2019 is calm.

USD/JPY

The price fixed above 50 MA and 100 MA, which points to the strength of buyers.

The MACD histogram has approached the 0 mark. There are no signals at the moment.

The Stochastic Oscillator is in the neutral zone, the %K line is below the %D line, which indicates a bearish sentiment.

Trading recommendations
  • Support levels: 106.300, 106.000, 105.750
  • Resistance levels: 106.700, 107.000

If the price consolidates above 106.700, expect further growth toward 107.000-107.200.

Alternatively, the price could drop toward 106.000.

by JustForex

The Dollar Index Is Testing Three-Week Highs

by JustForex

The US dollar is being traded near three-week highs against a basket of major currencies. The 10-year US government bonds yield has moved away from recent lows due to the fact that the leading countries of the world intend to support their economies with various economic stimulus measures. Also, it became known that the United States extended the Huawei license. By extending the license, the company will still be able to purchase materials from US companies. A temporary license is extended until November 19th. Meanwhile, investors will closely monitor US-China trade relations. The US President has criticized the Fed for a “strong” dollar again. Donald Trump said the regulator should consider lowering the key interest rate by 100 basis points in the near future. The US dollar index (#DX) closed the trading session in the positive zone (+0.22%).

The euro fell against the US dollar after the publication of weak economic statistics. Thus, the Eurozone consumer price index rose only by 1.0% in July, while experts forecasted growth by 1.1%. The political situation in Italy is still unstable. German authorities are going to apply stimulus measures to avoid a recession in the country’s economy. Last week Chancellor of Germany, Angela Merkel, said that Germany’s economy is moving into a difficult phase.

The “black gold” prices are consolidating after growth the day before. Futures for the WTI crude oil are currently testing the $56.35 mark per barrel.

Market Indicators

Yesterday, the bullish sentiment was observed in the US stock markets: #SPY (+1.20%), #DIA (+0.95%), #QQQ (+1.59%).

The 10-year US government bonds yield has moved away from local highs. At the moment, the indicator is at the level of 1.57-1.58%.

The news feed for 2019.08.20:

Today, the publication of important economic news is not expected.

by JustForex

Canada’s Manufacturing Sales To Rise For A Second Month?

By Orbex

The monthly manufacturing sales report from Canada is due for release today.

According to economists polled, manufacturing sales numbers are forecast to rise 2.0% on the month in June.

This follows a 1.6% increase in May. Manufacturing sales picked up momentum after falling 0.4% in April, which was revised from the initial print of a 0.6% decline. Data for May was rather encouraging. After adjusting for price factors, overall manufacturing sales grew 1.7% on a volume basis.

Canada Manufacturing Sales
Canada Manufacturing Sales, May 2019

The data set for June coming out later today will perhaps give a full picture of how the Canadian economy fared in the second quarter of this year. Data so far is supportive of the view that Canada’s domestic picture is improving.

Most of the gains in May were attributed to transitory effects due to the resumption of the auto plants, leading to an increase in the transportation equipment industry.

Global headwinds to manufacturing still remain. With the trade dispute between the world’s two largest economies still uncertain, various other economies have been facing the heat.

Canada is also no exception to this.

Therefore, there is a possibility that the outlook on manufacturing sales could be somewhat tame. Economists’ expectations remain rather optimistic at the moment.

Motor Vehicle Sales Could Push Manufacturing Sales Higher

In the data for May, Canada’s manufacturing sales grew on the back of motor vehicle sales. This sector alone rose 13.3% on the month. It was followed by vehicle parts sales which rose 7.3% on the month.

The surge in the above two sectors came after automobile plants reopened in May following the shutdown in April. It is likely that the surge in sales was due to a backlog of orders.

For June, there is a possibility that inventory levels would have been filled. This could perhaps lead to a slower pace of gains in June. Oil prices also play a crucial role in setting the trends in the automobile sector.

Crude oil prices in June hit a bottom early on but managed to rise sharply towards the end of the month. The modestly higher oil prices could potentially dampen the sales outlook for the period.

However, for the most part, motor vehicle sales and vehicle parts sales will be something to watch out for. If the current momentum remains, we could expect to see manufacturing sales rising for the second consecutive month.

Weak Ivey PMI for June Could Spell Trouble

It should also be noted that the Ivey Purchase Manager’s Index for June fell to a four-month low. The Ivey PMI index was at 52.4 with declines in the prices index, deliveries index, and inventories index.

This could potentially have an impact on the manufacturing sales report. There is a likelihood that the weaker Ivey PMI report could see manufacturing sales rising at slower than forecast levels.

As a result, the employment index was also weaker.

But this remains in contrast to May’s unfilled orders. Data at the time showed that unfilled orders rose 0.5%. This was the third monthly increase in the previous four-month period. But it could very well be because of the shutdown of the auto plants to a certain extent.

Trade balance figures for June show that exports fell 5.1%, offsetting the gains in May. 10 out of the 11 product segments showed a decline.

In May, the US and Canada also lifted the compensatory tariffs on steel and aluminum products. As a result, the data for June was somewhat weak.

Looking at the above factors, it is quite likely that manufacturing sales could come in somewhat lower than expectations of a 2.0% increase on the month.

By Orbex


Risk Appetite Improves Amid A Quiet Day

By Orbex

The markets opened to a quiet trading day with no major fundamentals dictating the flows. Economic data was also limited to that from the eurozone. Meanwhile, the US administration was seen giving China’s Huawei a 90-day grace period, easing tensions. Traders remain cautious ahead of the key events this week which focus on monetary policy.

Euro Comes Under Pressure Due to Weak Inflation

The euro currency was seen trading weak on Monday. Economic data on the day covered the final inflation figures for July. Data showed that headline inflation rose just 1.0% on the year ending July 2019. This was slightly below the estimates of a 1.1% increase from flash estimates. Core CPI, however, was unchanged at 0.9% as per the flash estimates.

EURUSD Looks Bearish, with Further Declines Likely

Price action in EURUSD looks increasingly bearish. The bearish flag pattern that is currently forming gives impetus to the bearish view. The downside target is toward the previous lows of 1.1030 with the possibility of a decline towards the 1.10080 region. Any upside will see the resistance level of 1.1140 stalling the gains.

EURUSD

Sterling Maintains Upside Momentum

The pound sterling maintained modest gains on Monday. Lack of any new developments on the Brexit front helped traders to bid the currency higher. A UK spokesman said that preparations were underway for a no-deal Brexit. The details of the no-deal Brexit will be released in a few days time.

GBPUSD Remains Biased to the Upside for Now

The currency pair has been gradually drifting higher, following the upside breakout from the descending wedge pattern. With GBPUSD clearing the support/resistance area of 1.2082, we expect the upside to prevail. However, a lack of momentum could see this to be a potential bull trap. GBPUSD could retest the level of 1.2082 if the bullish momentum fades.

GBPUSD

Gold Extends Declines for the Second Day

The recovering market risk appetite saw gold prices posting declines for the second day. However, the pace of declines is somewhat smaller when comparing to previous gains. For the moment, investors are likely to remain on the sidelines ahead of the big-ticket events this week. These include the ECB and Fed meeting minutes and the Jackson Hole Symposium due later in the week.

Has Gold Formed a Top in the Rally?

The current pace of gains looks to have stalled for the moment. With gold prices forming a lower high, it is likely that the current retracement will see a retest of the breakout level. The support area near 1508 is likely to be tested. This is where resistance will be established in the near term. As long as this holds as resistance, we expect the downside to prevail. The next downside target is at 1485.

Gold

By Orbex