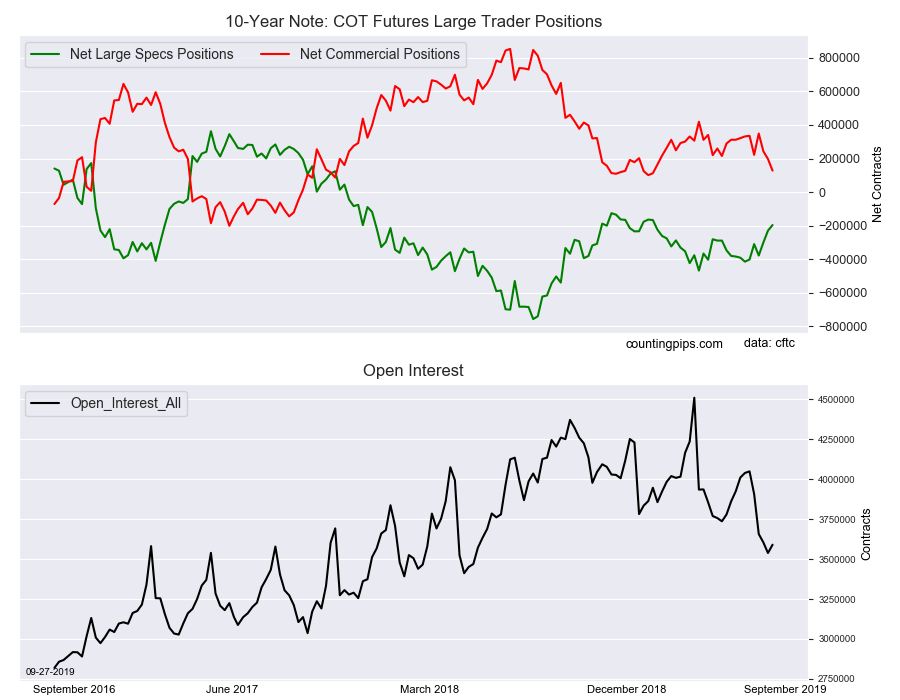
Large bond speculators cut back on their bearish net positions in the 10-Year Note futures markets once again this week, according to the latest Commitment of Traders (COT) data released by the Commodity Futures Trading Commission (CFTC) on Friday.
The non-commercial futures contracts of 10-Year Note futures, traded by large speculators and hedge funds, totaled a net position of -196,306 contracts in the data reported through Tuesday September 24th. This was a weekly change of 33,657 net contracts from the previous week which had a total of -229,963 net contracts.
The week’s net position was the result of the gross bullish position (longs) ascending by 848 contracts (to a weekly total of 624,462 contracts) while the gross bearish position (shorts) dropped by -32,809 contracts for the week (to a total of 820,768 contracts).
Speculators reduced their bearish bets for a third straight week and for the fifth time out of the past six weeks. This recent downtrend in bearish bets has now shaved off a total of 218,040 contracts from the bearish level in just the last six weeks. The current standing of speculative positions is at the least bearish level since March 26th, a span of twenty-six weeks.
10-Year Note Commercial Positions:
The commercial traders position, hedgers or traders engaged in buying and selling for business purposes, totaled a net position of 127,868 contracts on the week. This was a weekly shortfall of -69,527 contracts from the total net of 197,395 contracts reported the previous week.
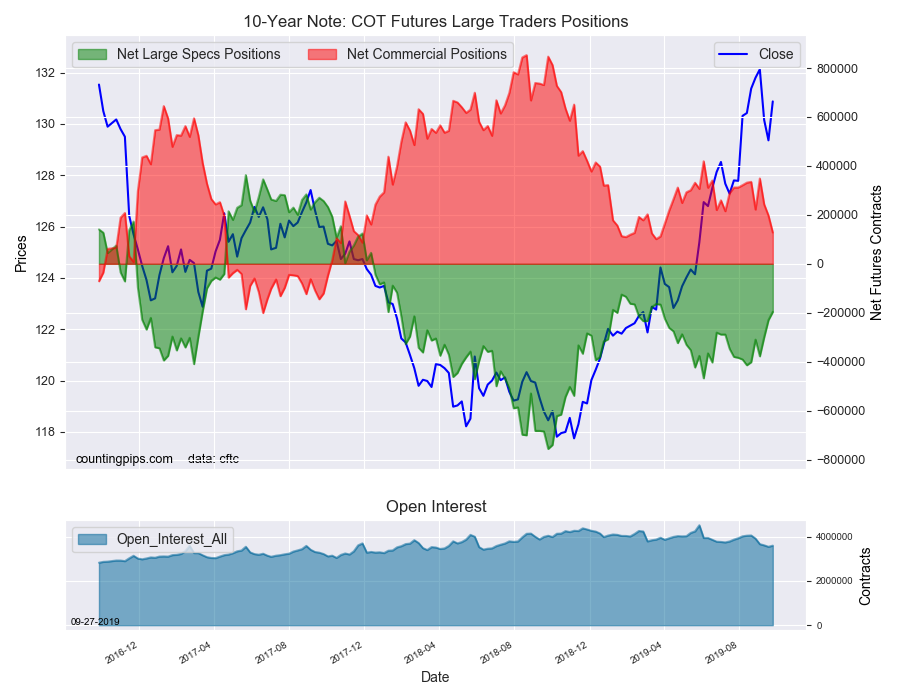
10-Year Note Futures:
Over the same weekly reporting time-frame, from Tuesday to Tuesday, the 10-Year Note Futures (Front Month) closed at approximately $130.87 which was a boost of $1.51 from the previous close of $129.35, according to unofficial market data.
*COT Report: The COT data, released weekly to the public each Friday, is updated through the most recent Tuesday (data is 3 days old) and shows a quick view of how large speculators or non-commercials (for-profit traders) as well as the commercial traders (hedgers & traders for business purposes) were positioned in the futures markets.
The CFTC categorizes trader positions according to commercial hedgers (traders who use futures contracts for hedging as part of the business), non-commercials (large traders who speculate to realize trading profits) and nonreportable traders (usually small traders/speculators).
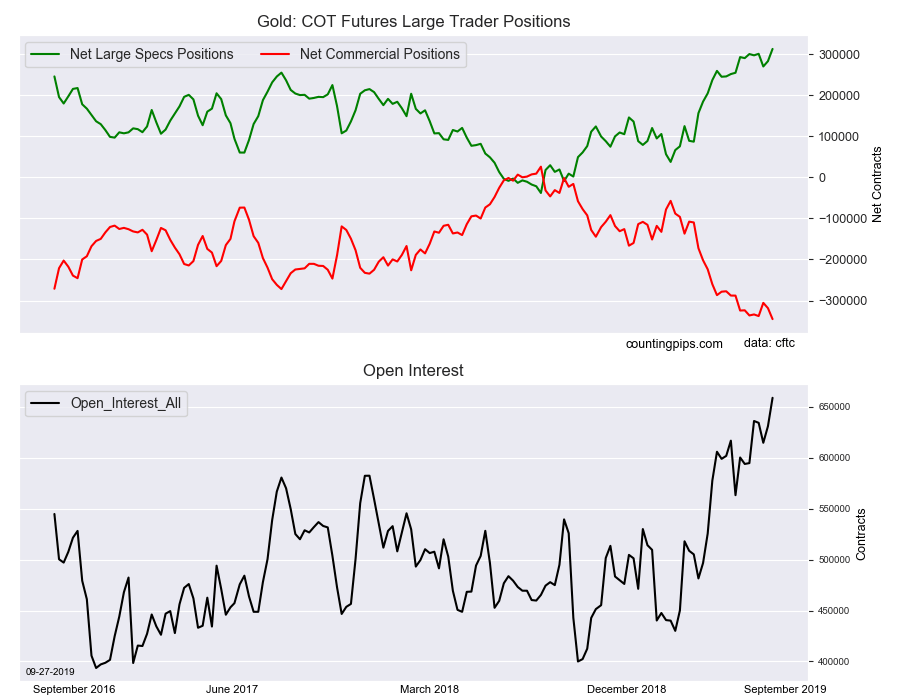
Large precious metals speculators lifted their bullish net positions in the Gold futures markets this week, according to the latest Commitment of Traders (COT) data released by the Commodity Futures Trading Commission (CFTC) on Friday.
The non-commercial futures contracts of Gold futures, traded by large speculators and hedge funds, totaled a net position of 312,444 contracts in the data reported through Tuesday September 24th. This was a weekly advance of 29,845 net contracts from the previous week which had a total of 282,599 net contracts.
The week’s net position was the result of the gross bullish position (longs) rising by 28,882 contracts (to a weekly total of 370,393 contracts) while the gross bearish position (shorts) fell by -963 contracts for the week (to a total of 57,949 contracts).
Gold speculators sharply raised their bets this week for a 2nd straight week and by the most in the past seven weeks. The boost in bullish bets brings the current standing to the highest level since July 5th of 2016, a span of one hundred and sixty-eight weeks.
The gain in speculative bullish bets this week has now pushed positions higher for sixteen out of the past twenty-two weeks.
Gold Commercial Positions:
The commercial traders position, hedgers or traders engaged in buying and selling for business purposes, totaled a net position of -345,145 contracts on the week. This was a weekly decline of -26,746 contracts from the total net of -318,399 contracts reported the previous week.
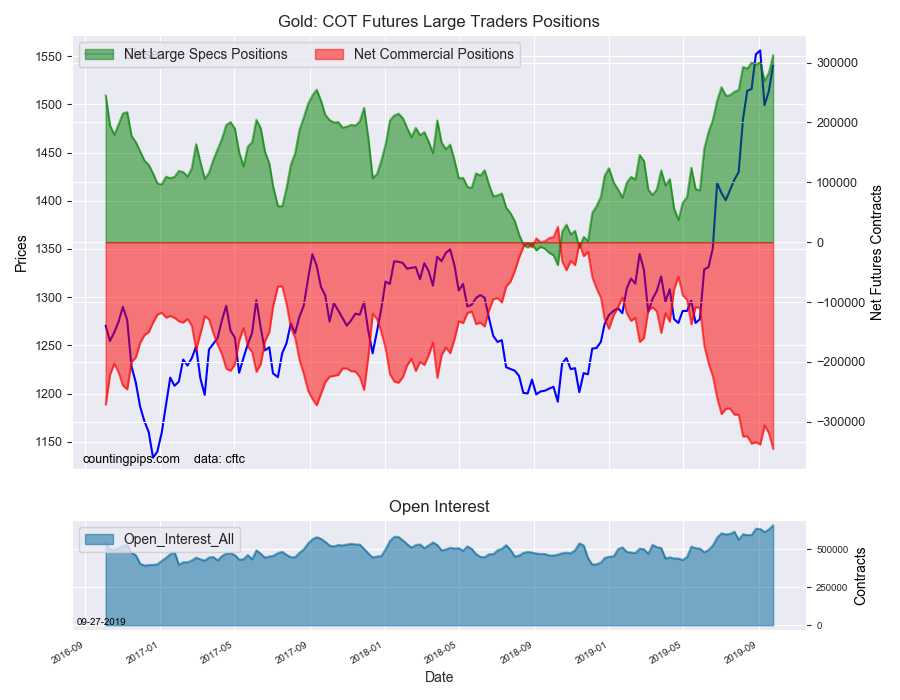
Gold Futures:
Over the same weekly reporting time-frame, from Tuesday to Tuesday, the Gold Futures (Front Month) closed at approximately $1540.20 which was an uptick of $26.80 from the previous close of $1513.40, according to unofficial market data.
*COT Report: The COT data, released weekly to the public each Friday, is updated through the most recent Tuesday (data is 3 days old) and shows a quick view of how large speculators or non-commercials (for-profit traders) as well as the commercial traders (hedgers & traders for business purposes) were positioned in the futures markets.
The CFTC categorizes trader positions according to commercial hedgers (traders who use futures contracts for hedging as part of the business), non-commercials (large traders who speculate to realize trading profits) and nonreportable traders (usually small traders/speculators).
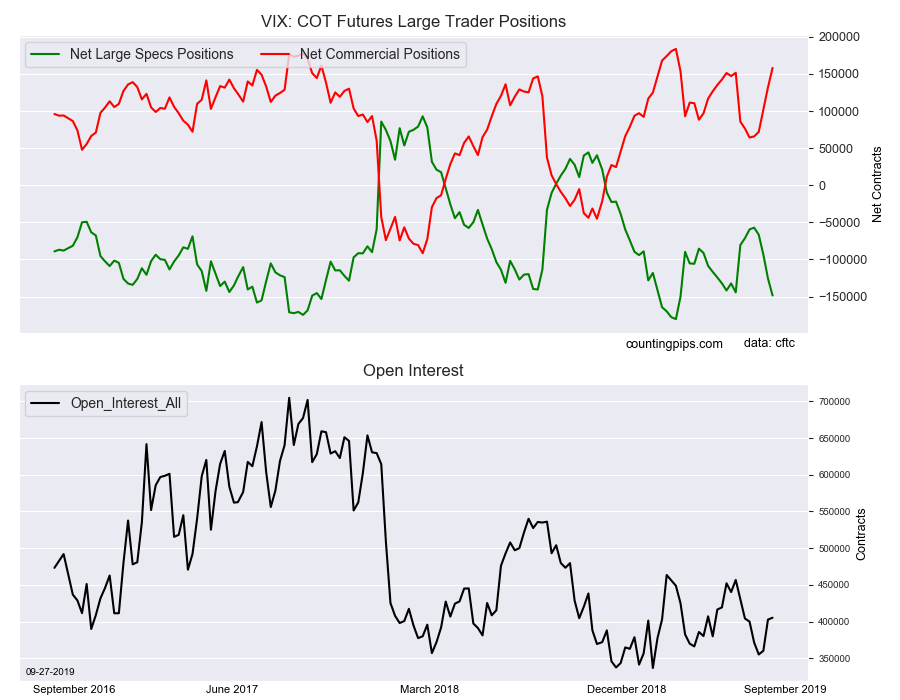
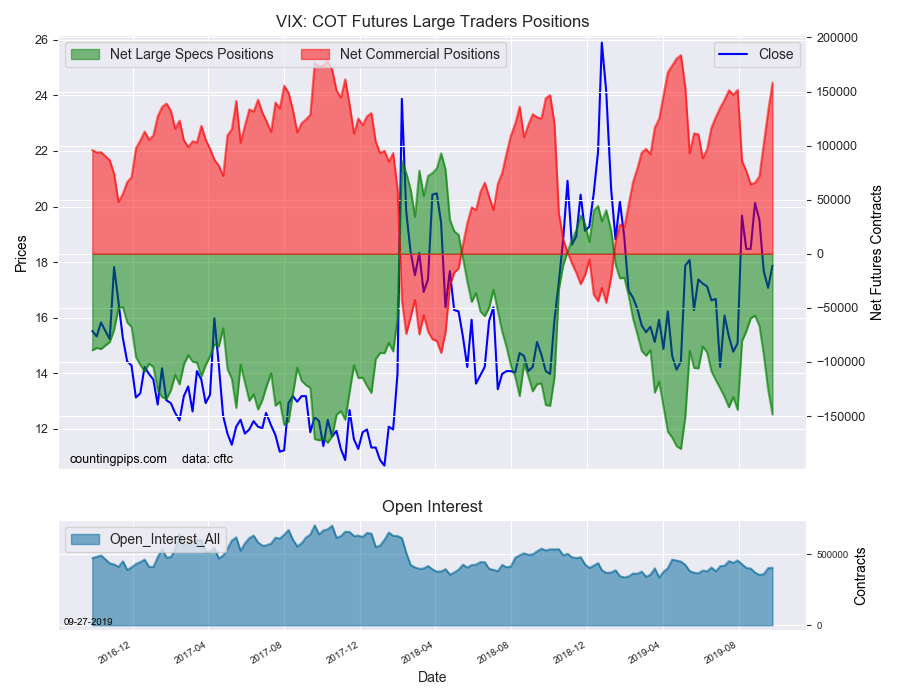
Large volatility speculators continued to add to their bearish net positions in the VIX futures markets this week, according to the latest Commitment of Traders (COT) data released by the Commodity Futures Trading Commission (CFTC) on Friday.
The non-commercial futures contracts of VIX futures, traded by large speculators and hedge funds, totaled a net position of -148,519 contracts in the data reported through Tuesday September 24th. This was a weekly change of -22,868 net contracts from the previous week which had a total of -125,651 net contracts.
The week’s net position was the result of the gross bullish position (longs) tumbling by -1,387 contracts (to a weekly total of 84,701 contracts) while the gross bearish position (shorts) jumped by 21,481 contracts for the week (to a total of 233,220 contracts).
VIX speculators boosted their bearish bets for a 4th week overall while each of the last three weeks have jumped by at least -22,000 contracts. The large speculative position is now at the most bearish level in twenty weeks dating back to May 7th when the net position stood at -150,307 contracts. That was just one week after the VIX positions fell to an all-time record bearish position on April 30th at a total of -180,359 contracts.
Currently, the net position is now over the -100,000 net contract level for a second straight week.
VIX Commercial Positions:
The commercial traders position, hedgers or traders engaged in buying and selling for business purposes, totaled a net position of 158,132 contracts on the week. This was a weekly gain of 26,196 contracts from the total net of 131,936 contracts reported the previous week.
VIX Futures:
Over the same weekly reporting time-frame, from Tuesday to Tuesday, the VIX Futures (Front Month) closed at approximately $17.87 which was an increase of $0.80 from the previous close of $17.07, according to unofficial market data.
*COT Report: The COT data, released weekly to the public each Friday, is updated through the most recent Tuesday (data is 3 days old) and shows a quick view of how large speculators or non-commercials (for-profit traders) as well as the commercial traders (hedgers & traders for business purposes) were positioned in the futures markets.
The CFTC categorizes trader positions according to commercial hedgers (traders who use futures contracts for hedging as part of the business), non-commercials (large traders who speculate to realize trading profits) and nonreportable traders (usually small traders/speculators).
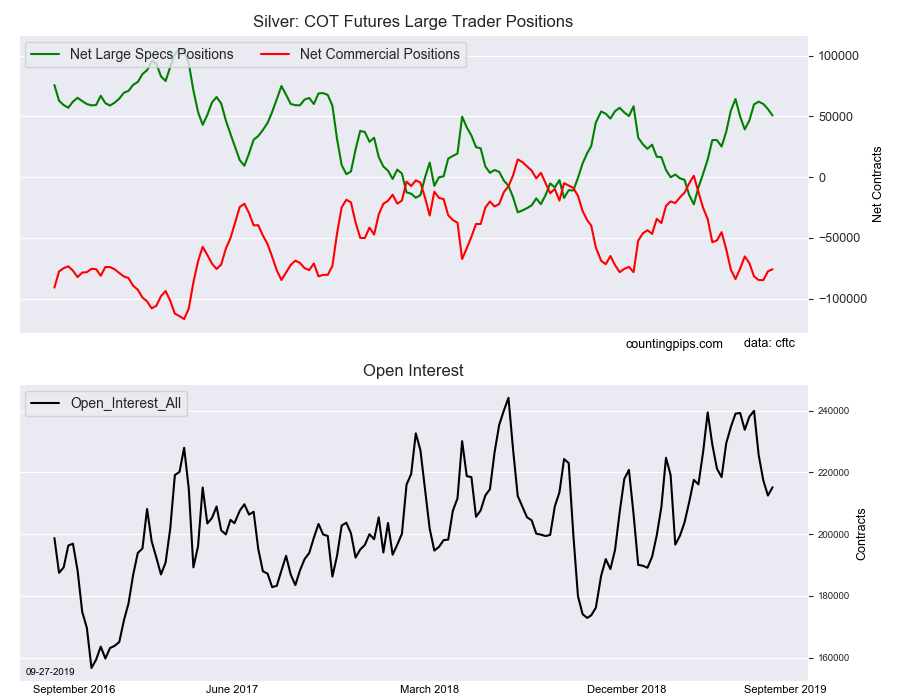
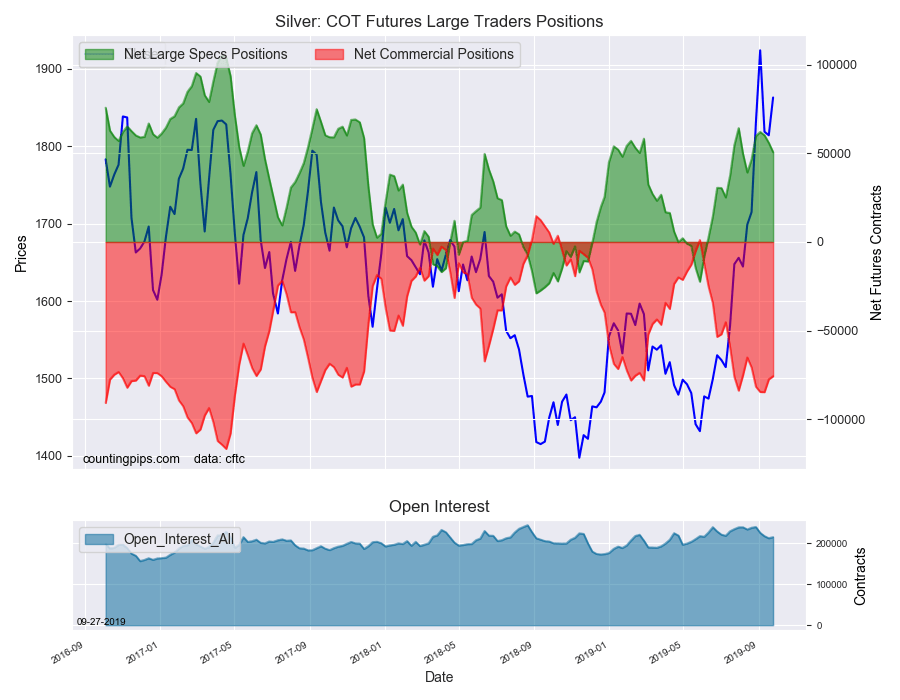
Large precious metals speculators decreased their bullish net positions in the Silver futures markets again this week, according to the latest Commitment of Traders (COT) data released by the Commodity Futures Trading Commission (CFTC) on Friday.
The non-commercial futures contracts of Silver futures, traded by large speculators and hedge funds, totaled a net position of 50,729 contracts in the data reported through Tuesday September 24th. This was a weekly fall of -5,249 net contracts from the previous week which had a total of 55,978 net contracts.
The week’s net position was the result of the gross bullish position (longs) decreasing by -623 contracts (to a weekly total of 94,002 contracts) while the gross bearish position (shorts) rose by 4,626 contracts for the week (to a total of 43,273 contracts).
Silver speculators continued to pare their bullish bets for a third straight week after previously rising for three straight weeks. These recent declines have been modest and follow up a streak of bullish gains in ten out of the previous fourteen weeks. The current standing remains above the +50,000 net contracts level for a fifth consecutive week – the first time that has happened since January-February of 2019.
Silver Commercial Positions:
The commercial traders position, hedgers or traders engaged in buying and selling for business purposes, totaled a net position of -75,779 contracts on the week. This was a weekly increase of 1,768 contracts from the total net of -77,547 contracts reported the previous week.
Silver Futures:
Over the same weekly reporting time-frame, from Tuesday to Tuesday, the Silver Futures (Front Month) closed at approximately $1862.80 which was a boost of $48.80 from the previous close of $1814.00, according to unofficial market data.
*COT Report: The COT data, released weekly to the public each Friday, is updated through the most recent Tuesday (data is 3 days old) and shows a quick view of how large speculators or non-commercials (for-profit traders) as well as the commercial traders (hedgers & traders for business purposes) were positioned in the futures markets.
The CFTC categorizes trader positions according to commercial hedgers (traders who use futures contracts for hedging as part of the business), non-commercials (large traders who speculate to realize trading profits) and nonreportable traders (usually small traders/speculators).
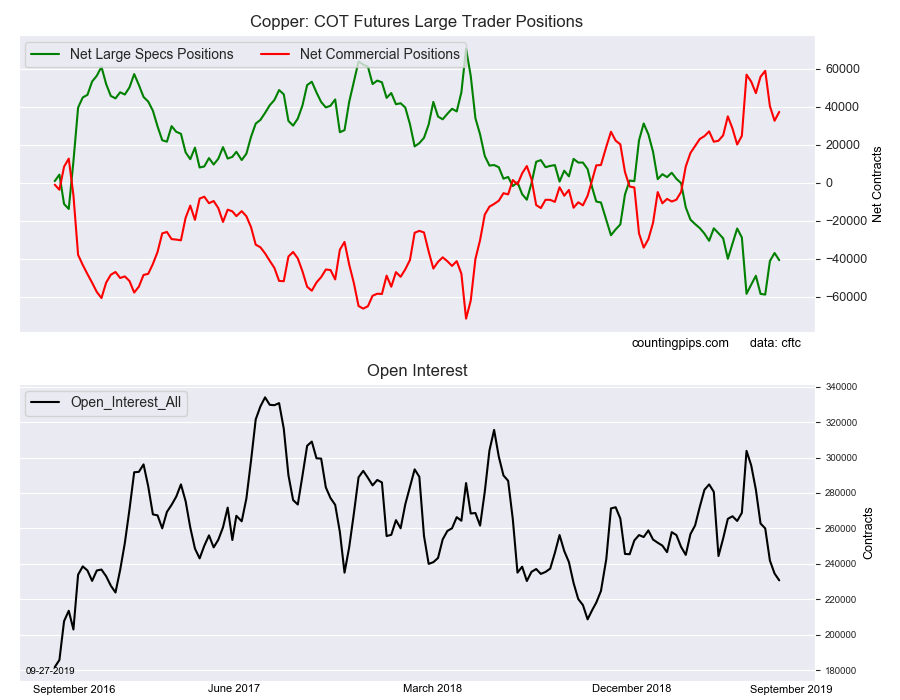
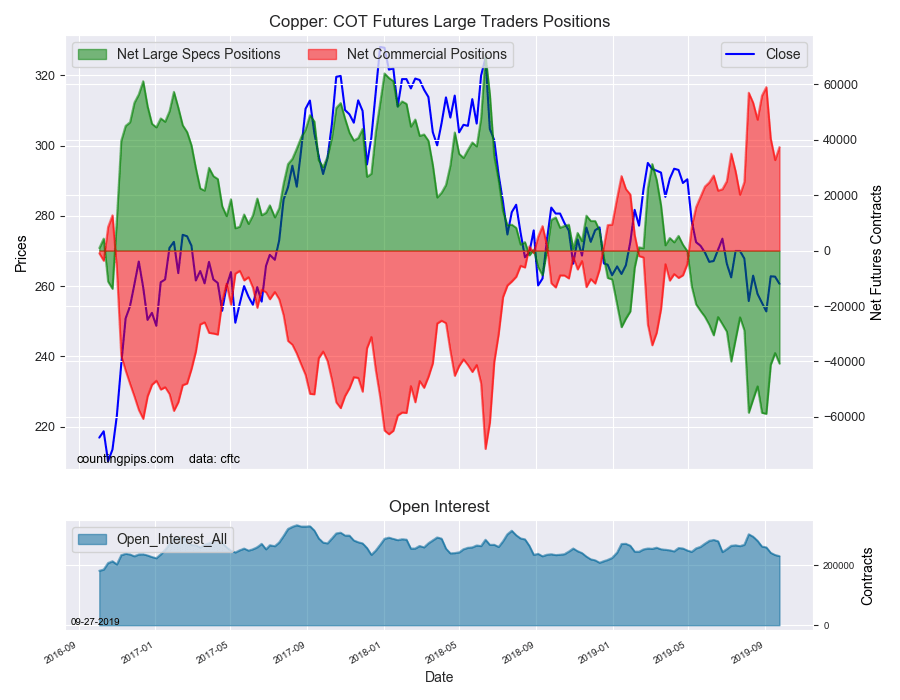
Large precious metals speculators increased their bearish net positions in the Copper futures markets this week for the first time in three weeks, according to the latest Commitment of Traders (COT) data released by the Commodity Futures Trading Commission (CFTC) on Friday.
The non-commercial futures contracts of Copper futures, traded by large speculators and hedge funds, totaled a net position of -40,739 contracts in the data reported through Tuesday September 24th. This was a weekly change of -3,789 net contracts from the previous week which had a total of -36,950 net contracts.
The week’s net position was the result of the gross bullish position (longs) decreasing by -3,878 contracts (to a weekly total of 71,205 contracts) while the gross bearish position (shorts) fell by just -89 contracts for the week (to a total of 111,944 contracts).
Copper speculators raised their bearish bets after two weeks of declining bearish positions. The net position had reached an all-time bearish record high on August 3rd at a level of -58,841 contracts before specs pared their bets in the next two weeks. The current standing is back over the -40,000 net contract level this week for the seventh time out of the past eight weeks.
Copper Commercial Positions:
The commercial traders position, hedgers or traders engaged in buying and selling for business purposes, totaled a net position of 37,358 contracts on the week. This was a weekly advance of 4,666 contracts from the total net of 32,692 contracts reported the previous week.
Copper Futures:
Over the same weekly reporting time-frame, from Tuesday to Tuesday, the Copper Futures (Front Month) closed at approximately $260.65 which was a decrease of $-2.05 from the previous close of $262.70, according to unofficial market data.
*COT Report: The COT data, released weekly to the public each Friday, is updated through the most recent Tuesday (data is 3 days old) and shows a quick view of how large speculators or non-commercials (for-profit traders) as well as the commercial traders (hedgers & traders for business purposes) were positioned in the futures markets.
The CFTC categorizes trader positions according to commercial hedgers (traders who use futures contracts for hedging as part of the business), non-commercials (large traders who speculate to realize trading profits) and nonreportable traders (usually small traders/speculators).
By CentralBankNews.info The Central Bank of Trinidad and Tobago (CBTT) left its benchmark repo rate steady at 5.0 percent in light of slowing global growth, easier monetary policy by major central banks, low inflation, sluggish demand for business credit, an external balance that has yet to be restored, and an economic recovery that is not broad based.
CBTT, which has kept its rate steady since raising it in June 2018, said natural gas production was starting to normalize after being hit by unplanned shutdowns and crude oil output was steady, but expected spillovers from higher government spending on manufacturing and private consumption were not yet evident.
Trinidad & Tobago’s economy contracted 2.1 percent in the fourth quarter of last year, larger than a contraction of 1.6 percent in the third quarter, and in July S&P Global Ratings downgraded the country’s sovereign credit rating to BBB from BBB+ based on lower-than-expected energy production and economic growth that would weaken the government’s revenue base and delay its plans to balance its budget.
Credit extended to the private sector rose “moderately” to 4.5 percent in July from 3.5 percent in March, but CBTT said business credit had declined by 2.8 percent year-on-year, although this was shallower than in previous months.
Inflation in Trinidad and Tobago is “well contained,” according to CBTT, with annual inflation of 1.2 percent in August, up from 1.1 percent in previous three months, but severe flooding in September is likely to lead to a further uptick in some prices.
The Central Bank of Trinidad and Tobago issued the following statement:
“International economic conditions remain delicate amidst rising global risks. In addition to ongoing trade tensions between the United States and China, rising geopolitical pressures in the Middle East threaten stability in oil markets, while Brexit discussions in the UK are coming to a head. The International Monetary Fund, in its July 2019 World Economic Outlook Update, revised global growth projections for 2019 further downward by 0.1 per cent to 3.2 per cent. Since then, faced with a slowdown of the US economy, the US Federal Reserve cut the Federal funds rate by 25 basis points in July and September 2019. These actions precipitated policy rate cuts by several central banks, which eased capital outflow and exchange rate pressures, especially among emerging market and developing economies. Meanwhile, in global energy markets over the past few months the price of oil trended higher surpassing US$60 per barrel in September while the price of natural gas remained relatively stable.
Domestically, unplanned shutdowns at Atlantic LNG during the second quarter of 2019 adversely impacted natural gas production, while crude oil production had stabilized at just over 59 thousand barrels per day. Heading into the third quarter, preliminary data suggest that natural gas production has normalized and crude oil output remained steady. In the non-energy sector, preliminary data for indicators monitored by the Central Bank point to improved performances in the distribution and finance sectors during the second quarter. However, the expected spillovers from the pick-up in government capital spending on the manufacturing and private construction sectors are not yet evident.
Data from the Central Statistical Office show that headline inflation remained well contained at 1.2 per cent in the twelve months to August 2019. Core inflation was anchored at 1.0 per cent, but higher prices for vegetables (10.9 per cent) caused food prices to accelerate to 2.0 per cent – the highest rate of increase thus far for 2019. It is likely that severe flooding in September would lead to a further uptick in the price of some domestic produce. Meanwhile, labour market conditions may be softening. Data from the Ministry of Labour, Small and Micro Enterprises showed that the number of persons retrenched during the first six months of 2019 rose on a year-on-year basis.
Private sector credit extended by the consolidated financial system expanded moderately to 4.5 per cent in July 2019 (year-on-year) compared with 3.5 per cent in March 2019. However, business credit continued to decline (-2.8 per cent), but the fall-off was shallower than in previous months. Consumer credit, driven by double-digit increases in lending for debt consolidation and refinancing, grew by 6.5 per cent and real estate mortgage loans increased by a steady 8.6 per cent. Commercial banks’ daily excess reserves at the Central Bank have averaged just over $4.5 billion thus far in September 2019 after somewhat tighter conditions earlier in the year. The Central Bank has had to carefully balance the public sector’s financing requirements and credit and inflationary conditions in calibrating its liquidity operations. As such, net maturities of open market operations injected $2,180 million into the financial system during June-August 2019.
Although declining US rates have improved the interest rate gap between short term TT-US treasury securities, the differential for three-month instruments remained below parity at -67 basis points at the end of August 2019. Meanwhile, there continues to be some disequilibrium in the foreign exchange market and the Central Bank maintained its fortnightly sales of foreign currency to authorised dealers.
The Monetary Policy Committee (MPC) in its deliberations considered the changes in the external environment, especially slowing global growth and policy actions by major central banks. Locally, the available indicators suggest that the economic recovery is not yet broadbased, inflation remains low, the demand for business credit is sluggish and external balance has not yet been restored. Taking these factors into consideration, the MPC agreed to maintain the repo rate at 5.00 per cent. The Bank will continue to carefully monitor and analyze international and domestic developments.
The next Monetary Policy Announcement is scheduled for December 27, 2019.”
Welcome to this week’s Market Wrap Podcast, I’m Mike Gleason.
Coming up Michael Pento of Pento Portfolio Strategies joins me for another top-flight interview as we discuss some major stresses in the financial system that are going to result in some serious issues in the economy. He also talks about the trade summit happening next month and what it will likely mean for precious metals if a deal is struck between the U.S. and China, or if an agreement is not reached. So be sure to stick around for my conversation with Michael Pento, coming up after this week’s market update.
Precious metals markets are trading in wide ranges as they struggle to hold on to gains posted earlier in the week.
As of this Friday recording, the metals are taking it on the chin here today with gold now looking at a weekly decline of 1.6% to trade at $1,494 an ounce. Silver is down 3.0% for the week to come in at $17.49 per ounce. Platinum is moving lower this week by 1.4% and currently fetches $937 an ounce. And finally, palladium is now commanding $1,692 per ounce after rising another 2.7% this week.
Hard assets in general are facing a headwind from a rising U.S. dollar versus foreign currencies. Precious metals, however, managed to gain in dollar terms and in terms of all major fiat currencies this summer. We’ll see if they can regain some momentum this fall.
In the meantime, investors are trying to balance the prospects for a Trump trade deal with China against the risks of the President being impeached.
On Tuesday, Democrat leader Nancy Pelosi announced that Congress would begin a formal impeachment inquiry against President Donald J. Trump. Partisan camps on both sides have planted their stakes in the ground, but investors want to know how the unfolding political drama will impact their wealth.
Will these impeachment proceedings bring down a presidency and doom the “Make America Great Again” policy agenda? Or will they devolve into a political sideshow that markets largely ignore?
The most likely outcome appears to be that impeachment will fail. Even if President Trump is impeached by the Democrat-controlled House, the odds of him being forced out of office by a two-thirds vote in the Republican-controlled Senate are slim. It would be difficult to imagine Trump resigning from office under any circumstance.
A failed impeachment effort might even help President Trump politically. It would rally his supporters to his side and could lead moderate voters to view Democrats as hyper-partisans who are singularly driven by anti-Trump animus.
As for how an impeachment effort might impact markets, history suggests it probably won’t change any major trends already in place. Neither the resignation of Richard Nixon nor the impeachment and acquittal of Bill Clinton caused the stock market to crash.
Precious metals markets didn’t move much around these momentous political events, either.
The House of Representatives initiated articles of impeachment against President Clinton on December 19, 1998. On February 12, 1999, the U.S. Senate voted to acquit Clinton and leave him in office.
Around that period, gold prices were in a long bottoming out process after having been in a bear market since peaking in January 1980. From the time Clinton was impeached to his acquittal, gold meandered around just under $300 an ounce. Interestingly, silver popped from $4.95 to $5.65 and the S&P 500 also made slight gains.
President Nixon resigned on August 8, 1974 with gold trading at $152. Gold began the year at $117 and finished at $195 per ounce. Nixon’s resignation occurred within a major year-long rally and doesn’t seem to have altered its trajectory, though it might have amplified the upside a bit.
Overall, the Watergate scandal that took down Nixon didn’t leave a lasting impact on markets. The much bigger legacy Nixon left is what has happened to the dollar since he ended its redeemability in gold. The consequences of the dollar’s lost status as a gold-backed currency are still playing out.
Under the post-World War II Bretton Woods system, U.S. dollars had been redeemable in gold by foreign countries. But Nixon feared a run on U.S. gold reserves and in 1971 announced to the public that the dollar would no longer be convertible into gold.
Richard Nixon: We must protect the position of the American dollar as a pillar of monetary stability around the world.
Accordingly, I have directed the Secretary of the Treasury to take the action necessary to defend the dollar against the speculators.
I have directed Secretary Connally to suspend temporarily the convertibility of the dollar into gold or other reserve assets.
Let me lay to rest, the bugaboo of what is called devaluation. If you want to buy a foreign car or take a trip abroad, market conditions may cause your dollar to buy slightly less.
But if you are among the overwhelming majority of Americans who buy American made products in America, your dollar will be worth just as much tomorrow as it is today.
Richard Nixon was no George Washington, and “Tricky Dick” didn’t always tell the truth. His claim that the dollar would be worth just as much tomorrow as today turned out to be quite a whopper. The fiat dollar’s purchasing power fell rapidly during the 1970s – not just against foreign currencies, but against real things. Commodity and precious metals prices surged, culminating with gold spiking to $850.
According to the Bureau of Labor Statistics’ own CPI Inflation Calculator, a dollar in August 1971, just before Nixon de-linked it from gold, is worth 16 cents today. That’s an 84% devaluation.
The lesson for investors is that trends in monetary policy matter a whole lot more for their wealth than momentary political headlines. The monetary policies now being implemented by the Federal Reserve are intended to gradually devalue the dollar.
In recent weeks, the Fed has inflated more aggressively – dropping its benchmark interest rate, letting its balance sheet expand, and pumping hundreds of billions of dollars into the troubled overnight lending market for banks.
On Wednesday, the Federal Reserve Bank of New York announced that it would increase its maximum daily repo market operations from $75 billion to a $100 billion. Fed officials are also considering a new standing repo facility to provide liquidity on a more permanent basis.
They insist it’s not Quantitative Easing per se. But regardless of what they call it, they are inflating the currency supply in their biggest intervention into financial markets since 2008. There will be unintended consequences – and they could visit themselves upon investors in the weeks and months ahead.
Well now for more on the effects of all of this liquidity being pumped into the repo market, and a whole lot more, let’s get right to this week’s exclusive interview.
Mike Gleason: It is my privilege now to welcome back Michael Pento, President and Founder of Pento Portfolio Strategies. Michael is one of our very favorite market commentators that we have on the podcast and is a well-known money manager, and author of the book The Coming Bond Market Collapse: How to Survive the Demise of the U.S. Debt Market. He’s been a regular guest right here with us over the past few years, and we always love getting his wonderful insights.
Thanks for the time again today and welcome back.
Michael Pento: Thanks for having me back on, Mike.
Mike Gleason: Well, Michael, I’d like to start out with a question about the repo markets and I’m hoping you can make sense of all this for us. Now the Fed is pumping hundreds of billions of dollars into these markets in ongoing overnight operations. We’re being told that this is just a matter of routine.
The markets certainly don’t seem too bothered, perhaps because Fed officials are out front assuring people that there is nothing to worry about. Unfortunately, that may be a signal that the opposite is true. Our central bankers are notorious for not telling the whole story and for being wrong, if not outright dishonest. So, if these operations are not extraordinary, one has to wonder why we don’t see the Fed doing this on a regular basis.
So, can you give a quick explanation for our listeners of what the Repo market is starters and then tell us Michael, what is your theory as to why the Fed is suddenly pouring huge sums into that market?
Michael Pento: I’ll try to give you a quick framer in the repo market, even though I’m not a bonafide expert in it, I will tell you this, there are problems in markets. You said there isn’t any manifestation in the problems in the repo market and the stock market and you’re completely correct, but the repo market is a huge problem.
Basically, think of the repo markets in two ways. So, there’s the Fed funds market, which is the target rate that the central bank sets for primary dealers to exchange cash. This is an unsecured line of credit. Bank A, which is a primary dealer and bank B is a primary dealer. They want to exchange cash with each other because one is short on reserves, one wants to borrow reserves. So, bank A loans money to bank B unsecured in the Fed funds market for around two percent, that’s what the Fed’s target is.
And then that money is repatriated back the next day and it’s unsecured. Then you have the repo market, which is different than the Fed funds market, but the Fed funds market sets the rate for repo. This is where primarily you see shadow banks asking for cash from primary dealers and they’re bringing collateral into the OTC market. And they’re saying, “Hey, I have, for example, in 2007, I have a mortgage-backed security that I’d like to borrow cash overnight.” And then you bring this mortgage-backed security to the primary dealer. And the primary dealer, “No, I don’t want it for two percent, or five percent, or six percent, or any rate anywhere near that. I want it for 10%, or no rate at all. I don’t want it.” So that’s when the money markets become clogged.
What I find interesting now is that the repo market we just talked about the evidence of distress wasn’t yet manifest in the stock market, but the repo market, which is supposed to be the rate that you exchange collateral around the rate where the Fed wants it to be exchanged for around two percent, now you take mostly high quality assets, these shadow banks take high quality assets – like mortgage-backed securities, CLOs, Treasuries – they tried to repo this rate at near two percent, but they got it at 10%. 10%, Mike!
Yet, this is what I find most amazing. This is not yet like 2007, where you had distressed assets being repo’ed by mostly insolvent institutions, that caused repo to spike to 10%. You have “High quality” assets yet. And I put “High quality” because when the recession comes, they’re going to be bankrupt even worse than they were in 2007, but we’re not there yet. But you’re still paying 10%.
This is what I want your audience to get out of this kind of complex issue. There is no liquidity any longer in the repo market, okay, it’s much worse than we were in 2007, a bit over a decade ago, these were very deep and liquid repo markets. Because of Dodd-Frank and Basel III, these banks no longer want to principle trade these assets, they don’t want to hold these assets, so their liquidity is razor thin. Hence, when we have a problem with these assets, the repo market will skyrocket. The rates will skyrocket much higher than they did a few days ago and much higher they did in 2007. This is the tenuous fragile nature of the money markets, which is the financial grease liquidity that helps the economy run. Without it, the economy can’t function.
Mike Gleason: So that begs the question, why are we not seeing a bigger deal out of this in the markets? I mean, to me it seems like a pretty major issue and maybe that’s overblown, but why is it hardly causing a ripple?
Michael Pento: Well, first of all, the Fed came in right away and they… and let’s just go back a bit. So, about a year ago, a little less than a year ago in the fall of 2018, remember the Fed was in the middle of raising interest rates. They raised rates nine times. And they drained about $800 billion of the Fed’s balance sheet. That caused the junk bond market to completely freeze up. So, the Fed changed course dramatically. Now the Fed is cutting rates and they’re now back into QE and Fed even opened up a repo facility, it’s supposed to end October 10th… I doubt it can end October 10th… they’ve infused hundreds of billions of dollars, Mike, into the repo market to re-liquify it.
Here’s the point. Here’s the salient point. The Fed can re-liquify the money markets temporarily and they can do this by they could cut interest on excess reserves, they can put the standing repo facility in there or they can even go back to QE. But here’s the question, here’s the point I want to make. Let’s just say that we’re correct and that the economy is going to have a recession at some time and I think it’s going to be much sooner rather than later.
At some point, the $5.4 trillion worth of triple B corporate debt, which is one notch above junk, $5.4 trillion of triple-B collateralized loan obligations, which are leverage loans and junk bonds. There’s $5.4 trillion of that. That is going to go belly up and bankrupt, and you’re going to have insolvent financial institutions, shadow banks, that are going to be trying to repo this crap, $5.4 trillion of it. And you can tell me, “Well, the Fed will by this stuff overnight.” Remember repos are overnight loans, primarily. Overnight. You can take a bankrupt junk bond to the Fed overnight, but you’re going to have to buy back that bond the next day.
Here’s the question. If that’s the case, you’re an insolvent institution trying to repo $5.4 trillion worth collectively of this junk bonds and triple-B debt, that’s worthless. Are you going to then take that money from the Fed to buy more junk bonds, and CLOs, and triple-B corporate debt? No, you’re not. You can’t. You need that money from the Fed just to keep the doors open and they’re not going to be open very long. So, you’re going to have another fall of 2018 event. It’s going to be exponentially worse because it’s going to involve not only just junk bonds, but it’s going to involve leverage loans, and triple-B debt, as I said, over $5 trillion of it, and that’s just the beginning.
And there’s no way these banks are going to be participating in the purchases of new corporate debt. So, the whole thing’s going to dry up again like it did in 2018, in the end of 2018, like it did in 2008, and we’re set for another massive draw down in GDP. Unemployment rates will skyrocket and the stock market is going to tank. That’s my prediction. Write it down, record it. We’ll play it again for our audience soon.
Mike Gleason: Switching gears here a little bit, you discussed the $100.07 trillion deficit in your latest weekly newsletter. It’s the largest amount since 2012 and more than doubled what was reported in 2016 just before Trump took office. Total federal debt is $22.5 trillion and its growth is likely to outpace what we saw under Obama. Candidate Trump talked about reducing deficits and debt. As president he was able to pass tax cuts, which were terrific, but there has been much less effort to reduce federal spending and economic growth has certainly not kept pace with that spending.
That said, President Trump probably isn’t going to have to defend the continuing explosion in federal debt. Most understand Democrat candidates would demand even more borrowing. Trump supporters may not like what’s happening with deficits, but they certainly aren’t going to jump ship over it. Debts and deficits seem dead as a campaign issue, but that doesn’t mean they don’t matter. Someday the bubble will pop and Americans will once again have to confront the issue. Do you think this might happen before the 2020 election? How about 2024?
Michael Pento: Well, let’s just go over a couple of things you said there. So, candidate Trump said he was going to pay off the national debt. And let me caveat this by saying that I voted for President Trump. I think he’s infinitely better than what we have to face possibly in November of next year. But candidate Trump said he was going to pay off the national debt, which was under $20 trillion is like $18, $19 trillion at that time. It’s now $22.5 trillion.
So, not only did we not pay off the debt, we’ve added to it, and we’re adding to it now at the pace, as you correctly point out, of over $1 trillion per annum. And this is when the unemployment rate, Mike, is at multi-decade lows. And when we have the next recession, when the automatic stabilizers kick in, welfare, food stamps, unemployment insurance, we are going to go from $1 trillion to 3 trillion. $3 trillion of deficits every year. And that’s assuming that the interest on the debt stays quiescent. So that’s a pretty big assumption, by the way, so we could be adding close to 15% of GDP, 15% of GDP per annum to our national debt. That’s how scary things could be.
And who’s going to buy all this debt? And at what interest rate? We were talking about repo market before, banks are loaded with Treasuries. By the way, these treasuries have a zero risk rating in the capital ratios. That’s how they’re calculated. What happens when these Treasuries really tank in price, what happens to the bank solvency? So, that’s a big question for us.
You and I talk about things all the time about how awkward and how tenuous and fragile the global economy has become. But so far, it hasn’t really become acutely manifest other than we had that little slight hiccup. We had one in 2016, we had one at the end of 2018, but central banks are doing something. Global central banks have printed $22 trillion worth of counterfeit money in the past decade to re-inflate asset prices and try to make the massive $250 trillion global debt pile serviceable. That’s a tremendous amount of printing to paper over what’s really going on in the world.
Let me repeat that. $22 trillion worth of new money, of fiat paper, has been created in the past decade. Think about that.
Mike Gleason: Yeah, it’s an unfathomable number. It’s really crazy, eventually you’ve got to think the chickens are going to come home to roost, as they say.
Well, as we kind of begin to wrap up here, we’re seeing some volatility in metals prices, particularly in silver. To us, it looks like prices have been pretty well-correlated with what is happening with yields in the bond market.
What do you make of the price action in metals and what are you expecting for the metals markets in the near term, in light of all of the aforementioned monetary issues, Michael?
Michael Pento: Well, I mean, I run an actively managed portfolio, so sometimes in very long metals, as I am right now, as I speak to you. But that could change. A lot of this is short-term contingent on what happens with President Trump and Xi Jinping when they meet early October, they’re supposed to have this grand bargain.
It wouldn’t surprise me if one is struck. If a bargain is struck and it’s substantial in nature, you will see a sharp and I think truncated selloff in the metals market, predicated on the fact that we’ve reached an agreement with Xi Jinping. Most of the tariffs will be rescinded, future tariffs will be discarded. And then a major reason why central bankers are currently cutting rates, especially the Federal Reserve, is predicated upon, and this is what they have avowed, predicated upon trade tensions. So, it would not surprise me to see a great buying opportunity in the metals market if such a deal is struck in the short-term.
But the truth of the matter is, we are going to enter into a recession very soon. The problems that are manifest in the global economy are not primarily derived from trade. They are primarily caused by China, which is a debt disabled nation, which can no longer stimulate the global economy into its growth trajectory of four percent, five percent. It’s now more like two, two-and-a-half percent. The U.S. economy waxes towards recession and you’re going to have a pullback in the global economic activity. You’re going to have a recession here in the United States and that’s when the bond market blows up, and that’s when you’re going to be very grateful you used an opportunity such as we could get in early October to purchase precious metals.
Now on the other hand, if there is no deal struck or if the deal does not eliminate most of the tariffs that are currently in place, I believe you’re going to have a direct response from the gold market and it will be very, very positive and very, very steep… a sharp rise in metals prices.
Mike Gleason: Well, we’ll leave it there for today, Michael, and we appreciate the time, as always, and love it when you’re willing to share your comments with our audience, as you have once again.
Now before we let you go, please tell folks a little bit more about Pento Portfolio Strategies and then also how they can follow you more closely.
Michael Pento: Sure, my website is PentoPort.com. My email addresses is [email protected]. I run an actively-managed 20 point model/strategy called the Inflation, Deflation, and Economic Cycle Model. It tries to make money in all cycles, but it particularly protects against periods of time where we’re entering a stagflation or intractable inflationary environment, or conversely, a disinflationary, depressionary, deflationary cycle.
Both of those outcomes are virtually assured, given the level of $250 trillion of global debt that cannot be ever paid back, and it can’t even be serviced adequately. It must be defaulted upon, and it will be defaulted upon either through deflation or massive inflation. I think it will be both at different times and you have to know how to invest in all of those environments.
Mike Gleason: Yeah, it’s certainly going to be a tricky market coming up here over the next several years, and obviously Michael is a fantastic person and his firm is a wonderful place to go if you are looking to navigate that and get some real expertise there. So, yeah, give him a call.
Well, good stuff, Michael, appreciate the time once again. Enjoy the fall, and we’ll look forward to our next conversation. Thanks very much and take care.
Michael Pento: Thank you, Michael.
Mike Gleason: Well, that will do it for this week. Thanks again to Michael Pento of Pento Portfolio Strategies, for more info please visit PentoPort.com. You can sign up for his email list, listen to his midweek podcasts and get his fantastic market commentaries on a regular basis, again go to PentoPort.com.
And don’t forget to tune in here next Friday for next Weekly Market Wrap Podcast, until then this has been Mike Gleason with Money Metals Exchange, thanks for listening and have a great weekend everybody.
The Money Metals News Service provides market news and crisp commentary for investors following the precious metals markets.
Note: This overview has an informative and tutorial character and is published for free. All the data, included in the overview, are received from public sources, recognized as more or less reliable. Moreover, there is no guarantee that the indicated information is full and precise. Overviews are not updated. The whole information in each overview, including opinion, indicators, charts and anything else, is provided only for familiarization purposes and is not financial advice or а recommendation. The whole text and its any part, as well as the charts cannot be considered as an offer to make a deal with any asset. IFC Markets and its employees under any circumstances are not liable for any action taken by someone else during or after reading the overview.
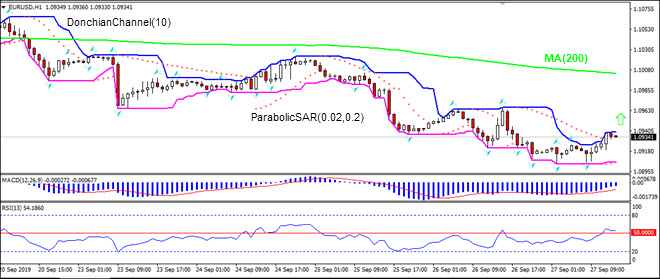
The decline of euro-zones largest economy’s index of import prices accelerated to 2.7% over year in August from -2.1% in July. Will the EURUSD continue falling?
On 1-hour timeframe EURUSD: H1 is in uptrend, rising toward 200-period moving average MA(200).
The Critical Investor delves into this lithium firm’s recovery method for its Arkansas project and why it may succeed when other companies’ have not.
1. Introduction
Usually, when I hear about companies pursuing new recovery methods necessary to make uneconomic specialty metals projects economic, I’m very skeptical about their chances of success. The simple reason for this is that developing such methods are very capital intensive, and very difficult to scale up from bench scale (laboratory scale) to commercial scale pilot plants. In the lithium space there are several examples of junior mining companies with similar initiatives, backed by giant chemical companies providing tech and pilot plants for many years, but unsuccessful in proving up commercial production. So when I was introduced to Standard Lithium Ltd. (SLL:TSX.V; STLHF:OTCQX) and its story, I was skeptical at first as well.
However, when I heard about the successful testing so far, the concept of recovery, the knowledge and experience involved, the JV partner and its ability to raise significant amounts of cash during the latest downturn in venture and lithium sentiment, it dawned on me that this might be a company with above average chances of success, and actually making it into commercial production. It is progressing pretty fast as well, which I also regard as a good sign. In this analysis I will discuss several important aspects, the economic potential of the Lanxess project, and the potential impact on valuation if things go as planned.
All presented tables are my own material, unless stated otherwise.
All pictures are company material, unless stated otherwise.
All currencies are in US Dollars, unless stated otherwise.
2. The company
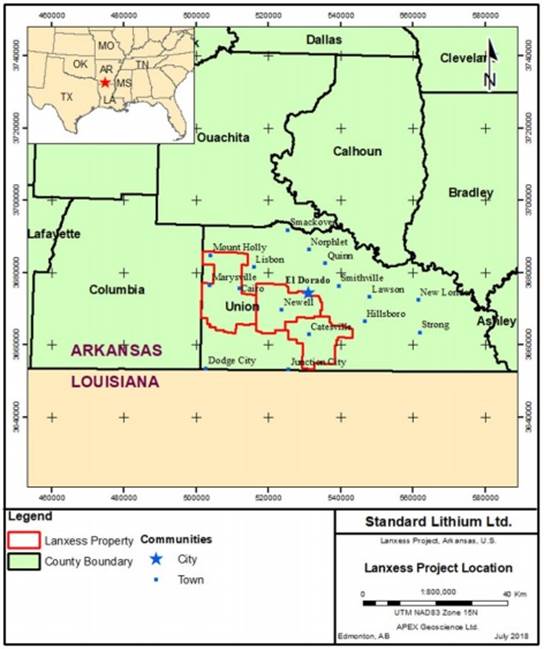
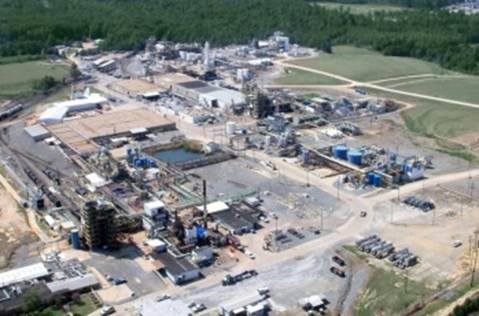
Standard Lithium (SLL.V) is a publicly traded technology and project developer advancing its lithium brine project in Arkansas, U.S. The company is currently focused on the development of its flagship 150,000-acre Lanxess Project located in southern Arkansas. The region is home to North America’s largest brine production and processing fairway. The location has significant infrastructure in place, with easy road and rail access, abundant electricity and water sources and is already permitted for extensive brine extraction and processing activities.
Standard Lithium isn’t a traditional venture mining company, which are usually mostly focused on exploring and developing mineral resources. This company is more about applying new direct extraction technologies at the project level, and leveraging the core competencies and investments of strategic partnerships to reduce capital and execution risk. Standard Lithium is focused on applying these modern extraction methods on existing large-scale U.S.-based brine resources that have the potential to be quickly brought into production for battery quality lithium materials. As the eventual construction of this type of project would be very capital intensive for a relatively small junior, Standard Lithium has partnered up with Lanxess AG (LXS:DE), a global Germany-based specialty chemicals company, which is listed in Germany and has a market cap of US$5.12 billion.
Lanxess has a very large brine based bromine extraction operation in southern Arkansas, and Standard Lithium aims through a JV to test and prove the commercial viability of the extraction of lithium from brine (“tail brine”) that is a byproduct of the existing bromine production facilities of Lanxess.
Standard Lithium has two projects; the flagship Lanxess project is located in Arkansas, but unfortunately there is no mention of it in the most recent Fraser Institute Survey of Mining Companies. The second project is the Mojave project, and is located in California. This article will be about the flagship Lanxess project only. Talking about jurisdictions, California doesn’t have a very good reputation for permitting, and therefore is ranked only 49 out of 83 in the latest survey, but Standard Lithium isn’t teaming up with existing and fully permitted operators in both locations for no reason. After extensive consultations with regulators, governments and community spokesmen in Arkansas, Standard Lithium believes there is no reason to believe that permitting additional facilities at the much larger Lanxess processing site will be a problem.
Standard Lithium is basically led by two men: CEO Robert Mintak and President and COO Andy Robinson, PhD. Mintak is a pioneer in the lithium space, has a powerful global network, and has been CEO of Pure Energy from 2013 into 2016 before he switched to Standard Lithium. He has been largely responsible for raising over C$40 million for Standard in the past few years, brings in deals like Lanxess and tells the story tirelessly across the world. Robinson is the technical brain behind Standard; as a geoscientist he has more than two decades of experience in geochemistry and groundwater-focused projects. He worked alongside Mintak as COO of Pure Energy and joined him at Standard Lithium.
Another key figure is Non-Executive Chairman Robert Cross, who founded B2Gold and currently still is the chairman of this company, which is approaching an annual production of 1 Moz gold. On top of this, Standard Lithium has a very interesting technical team of advisors, among them very experienced global thought leaders like Chemistry Nobel prize winner Prof. Barry Sharpless, Prof. Jason Hein who specializes in applying AI in reaction optimization, and other longtime specialists in the field of solvent/ion-exchange, flow sheets, pilot plants, process engineering, etc., who all have very active roles in the development of the new recovery process of Standard Lithium. As a result, Standard is working together with three different universities, having the best and brightest minds working on the new recovery method, and COO Robinson believes this approach enabled Standard Lithium to be successful so quickly, in relative terms.
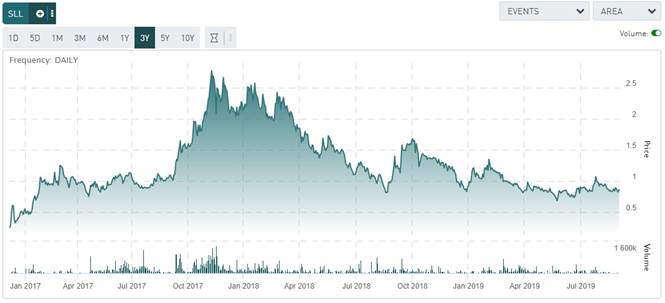
Standard Lithium has its main listing on the main board of the TSX Venture, where it’s trading with SLL.V as its ticker symbol. With an average volume of about 60,778 shares per day, the company’s trading pattern is reasonably liquid at the moment, and I expect this to improve when positive demonstration plant results start coming in.
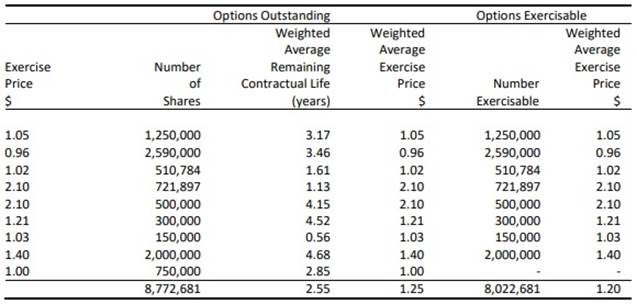
The company currently has 87.59 million shares outstanding (fully diluted 111.2 million), 14.85 million warrants (of the warrants outstanding, 3,125,000 are exercisable to acquire one common shares at $0.25 expiring May 10, 2021; 5,156,411 are exercisable at $2.60 per share, expiring on February 16, 2020; 5,695,250 are exercisable to acquire 1 common share at $1.30 expiring February 21, 2022; 656,675 are exercisable to acquire 1 common share at $1.00 expiring on March 21, 2021; and 213,000 are exercisable to acquire 1 common share at $1.30 expiring on April 10, 2022) and several option series to the tune of 8.77 million options in total, details are shown here:
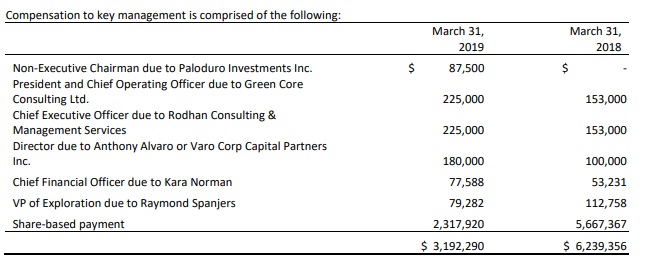
A current share price of C$0.81 results in a market cap of C$70.9 million. Management has decent skin in the game, as Mintak, Robinson and Cross each hold 11.5 million shares, and each over 1 million options. In total, management and BoD hold about 4 million shares, which is 4.5%. Significant holders are Commodity Capital (9.9%), Global Lithium ETF, Fosun International, National Chloride and Tetra Technologies, which in total hold 9%, which means roughly 23% is in relatively tight hands. I also looked into the compensation of management, and noticed pretty high share-based compensation numbers at first sight.
CEO Mintak had the following explanation, which sounded reasonable, as this compensation wasn’t shares or even close:
“Share-based compensation in 2018 included total of 721897 compensation options priced at 2.10 from our Feb 2018 $21M raise that expire Feb 2020 so we need to move the share price higher than 2.10 in 6 months for those to be in the money or they expire, also included an RSU compensation plan total of $2.1M at $2.10 that was subsequently canceled but required to be 100% expensed because of IRFS rules even though they were canceled. The rest were options that were issued and are under exercise price now.”
Standard’s working capital position at the end of the last reporting period, Q3 March 31, 2019, was C$9 million. In my view it is an interesting moment to enter and wait for the testing, Pre-Feasibility Study (PFS) and the Lanxess decision, as the stock seems to have bottomed out for quite a while now:
The 2017early 2018 peak was caused by the extremely positive lithium sentiment in those days, but the most impressive feat in my opinion is that Standard Lithium managed to carry on diligently during the downturn, especially as mentioned raising another C$11.8 million in April this year, which was a major hurdle to overcome, as it enabled it to construct the demonstration plant. All eyes are now on the testing and the upcoming PFS, which, if positive, could likely result in a construction decision by Lanxess, which will be a major catalyst in my view.
3. Lithium
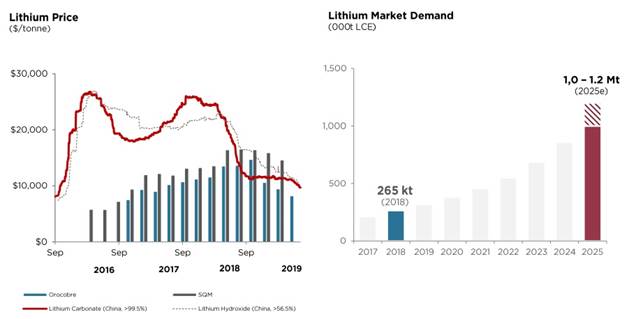
The market for lithium, and more precisely lithium products, isn’t a transparent one, as there are no central exchanges for this metal. There is a variety of contracts, ranging from spot to long term, and several organizations try to crystallize something of a credible pricing out of this. I view the long-term contract prices as most viable, as these are the large scale agreements between miners and converters (mostly in China), which is ultimately the price deck Standard Lithium will be dealing with when going into production. The best source so far for me is the presentation of Lithium Americas, combining spot and contract prices from Orocobre and SQM:
As can be seen, despite lowering lithium product prices, spot or contract, there is no lack of optimism with producers when estimating market demand, based on ongoing electrification of society, including electric vehicles. There are reasons for this.
The global market for battery chemical lithium is likely to remain fairly balanced for the next four to five years with supply rising to meet increased demand from electric vehicles. However, recent attempts by established brine producers to expand production in Chile have failed to materialize, owing to governmental, technical and environmental concerns. Recent increases in lithium chemical production have been fed by hard-rock producers in Australia, though these are currently entering a constrained growth phase, as almost all of the existing conversion capacity is being utilized.
This could be a very important aspect which Morgan Stanley, with probably the most bearish stance on lithium product pricing today, is overlooking. To be fair, the firm also brings in good points, as the likelihood of slowing down GDP growth and lower EV subsidies in China. It will be interesting to see which fundamentals will drive lithium product pricing for the next years. The durable/renewable energy paradigm shift isn’t going away anytime soon. A short note on fuel cells, which are on the rise in logistics, in case you are wondering about this (source): “hydrogen fuel cells offer a potentially very clean, energy dense and easy to recharge energy source for vehicles and other systems, but are currently complicated, expensive and dangerous to operate. In comparison, Lithium-ion batteries, although less energy dense and slower to recharge, are as clean, much cheaper, easier and safer to handle.” So it will take many years before fuel cells will solve safety issues before they can think of overtaking lithium-ion batteries, in my opinion, and potentially make a serious dent in lithium product demand. After discussing the outlook on lithium products, let’s have a look at the Lanxess project.
4. Lanxess Project
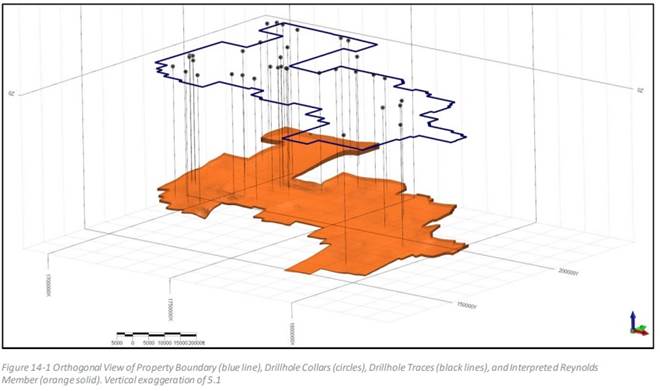
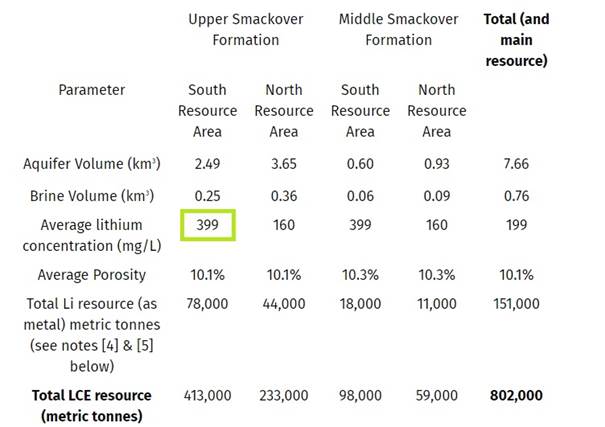
The Lanxess project is situated in southern Arkansas as part of the Smackover Formation. The Smackover Formation is a porous and permeable limestone aquifer that hosts large volumes of mineral-rich brines and hydrocarbons at great depths, starting from about 2100m, and about 50m thick on average. Its brines are currently the one of the largest sources of bromine in the world, but the brine also contains lithiumestimated to range from 150 to 500 mg/L.
The Lanxess operations consist of 150k acres land, 10k brine leases/surface agreements, 250 miles of pipelines, 61 brine supply/reinjection wells and three bromine processing plants. Around 500 people work at the plants, which produce about 6 billion gallons of brine annually. Lanxess owns the infrastructure 100%.
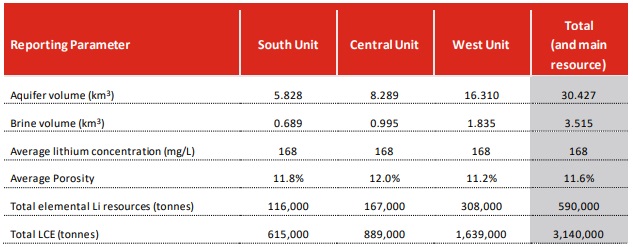
In 2017/2018 Standard Lithium conducted geochemical exploration on the land leased by Lanxess. The distribution of the brine samples collected included all brine distribution sample points (i.e., 24/26 brine supply wells, feed-brine and tail-brine from the South, Central and West bromine plants). Brine from the brine supply wells contained an average Li concentration of 164.9 mg/L Li. The main Inferred resource is estimated at 3,140kt Lithium Carbonate Equivalent (LCE) at the Indicated category.
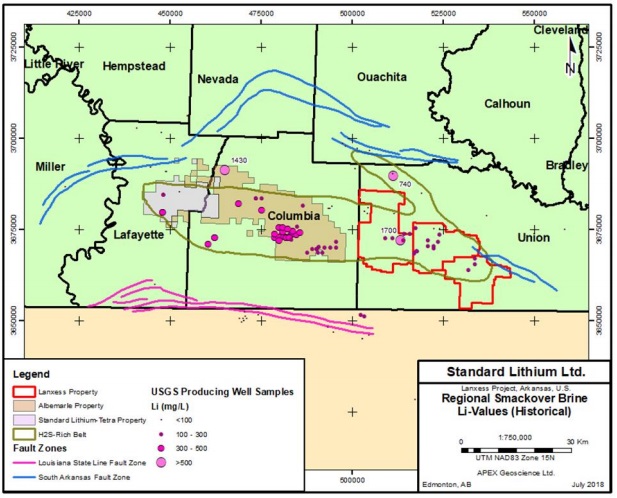
Standard Lithium has an option agreement with NYSE-listed Tetra Technologies (NYSE:TTI) on 27,000 acres of brine leases themselves; see the light pink colored area to the left at Lafayette (the red outlines are Lanxess owned):
The company has completed a maiden Inferred resource on the Tetra property of 800kt LCE, of which a large part is at a significantly higher grade compared to the Lanxess resource (168mg Li/L):
As a consequence, Standard Lithium is eager to add the best part of this resource to production after nameplate production is reached, more on this later.
Standard signed a term sheet with Lanxess in November 2018. The MOU as the basis of a potential future definitive agreement is binding until the completion of further development phases and more comprehensive agreement. Assuming the various milestones are adhered to, the MOU is exclusive and binding for a period of five years (until May 2023). Standard Lithium has paid an initial US$3 million reservation fee to Lanxess to locate and interconnect the lithium extraction pilot plant, to secure access to tail brine produced as part of Lanxess bromine extraction business and to provide logistics and other support required to operate the pilot plant with additional fees and obligations in the future (subject to certain conditions).
Compared to more traditional brine and hard rock projects, the Lanxess Project would require fewer steps in its development and especially less time given no additional drilling is needed, permitting is reduced to adjustments of existing Lanxess licensing agreements and no extensive infrastructure is needed either. Management estimates that in case of a construction decision in H2 of this year, commercial production could be achieved in H2, 2022, encompassing a total five-year timeline. This compares favorably to various other well-known projects:
Lithium Americas – Cauchari-Olaroz: 11 Years (20092020) from initial resource work to estimated start of commercial production;
Orocobre – Olaroz: 7 Years (20082015) from initial resource work to first commercial production; yet to achieve nameplate capacity;
Lithium Power International/Bearing/Borda Group – Maricunga: 12+ Years (20092021+) from initial work to earliest production;
Nemaska Lithium Whabouchi: 10+ years (20092020); yet to finalize last part of funding
Although introducing the concept of a new recovery method in lithium operations isn’t always met with the most enthusiasm of investors as mentioned in the introduction, as commercial viability isn’t an easy feat here, Standard Lithium certainly is very serious in its endeavors. It not only put together a management and advisory team consisting of a number of heavyweights in the finance-, lithium-, lithium extraction- and development space, as mentioned earlier. Standard Lithium also raised C$43 million in the last two years, of which a bought deal of C$11.8 million in April 2019, which was in my view very impressive considering the pretty subdued sentiment for lithium since the summer of 2018.
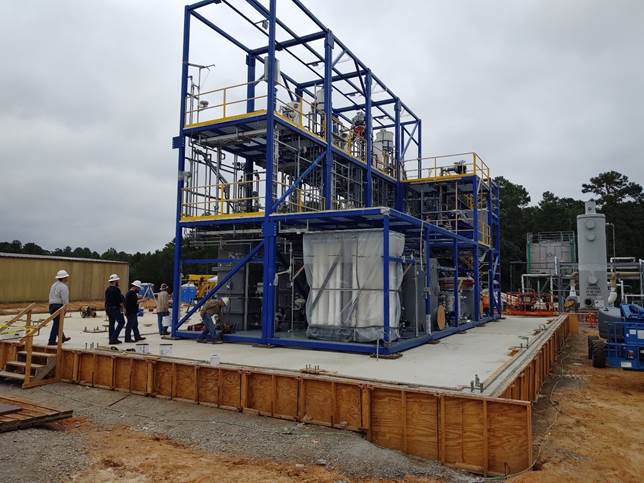
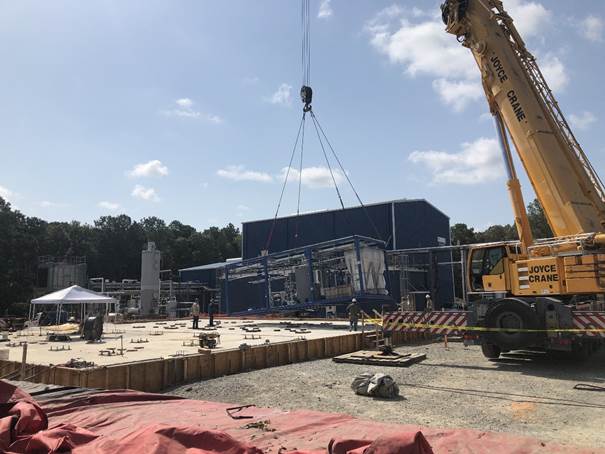
Most of this last raise was needed to advance the construction and installation of the industrial scale demonstration plant as it needs to be called legally, in order to test the all-important economic viability and scalability of its direct lithium extraction process, which is called LiSTR. The LiSTR direct extraction process has already gone through bench scale, batch mini pilot, and continuous pilot scale, and will soon be trialed onsite at demonstration scale, where it is assembled now:
Positive test results of the LiSTR demonstration plant are the proof that Lanxess needs in order to finance and construct the entire project. Testing the process at this scale isn’t just a matter of simply scaling up the earlier used set-ups. These smaller stage pilots aren’t economic, and this last demo phase aims at turning the entire process into a commercially viable one. Of course, if there wasn’t any sight at viability when designing the method on the drawing board, there was no use going through all these steps, but Lanxess has seen enough positives to give Standard the opportunity to use its sites as one big experimenting area, and outline a potential JV.
Additionally, Standard Lithium has developed a second complementary technology called SiFT, which is a continuous fractional lithium carbonate crystallization process, the last stage of producing Li2CO3, which has already gone through bench scale and prototype pilot scale, and engineering is underway for a pilot scale plant to be built in Q4. The testing of this SiFT plant isn’t crucial for Lanxess, as conventional methods are easy to obtain and apply, at higher costs, still rendering the project viable if needed. Notwithstanding this, both Standard and Lanxess are very interested in the potential optimization this SiFT plant could provide.
The LiSTR demonstration plant is fully funded throughout construction via the financing this past spring with construction now completed by ZETON in Ontario, Canada, one of the global leaders in pilot plant construction, and the delivery and installation of this plant at the Arkansas project is expected late Q3 2019. The SiFT plant isn’t fully funded yet, the company estimates about C$5 million is arranged, and another C$5 million is needed, plus another C$1 million for further optimization.
This is not all, after both plants are constructed and commissioned, management estimates another C$1520 million is needed to improve, run and test both plants for 1218 months, as there are always teething problems, and extensive optimization programs are already designed, to potentially improve economics further. Standard aims at commissioning the demonstration plant in October this year, and believes it will have enough testing data at the end of Q1 2020 to complete a Pre-Feasibility Study (PFS) in Q2, 2020. Lanxess will base a construction decision on this PFS, and this is planned for Q3, 2020, with construction following shortly afterwards.
Standard Lithium takes on the risks and cost of all process construction, testing, optimization and viability, the economic studies including recently announced Preliminary Economic Assessment (PEA) and the mentioned PFS, and also brings in 27,000 acres of greenfield brine leases it holds an option to in southern Arkansas to the JV. Lanxess brings in 150,000 acres of brine leases, three operating chemical plants, hundreds of miles of pipelines and dozens of production and disposal wells, permits, and most importantly has announced it will finance, build and operate the final commercial processing plants, and has committed to a 100% off-take agreement. Final terms of the JV are not yet announced, as they still need to be negotiated, depending on the test results and PFS. When all the terms and conditions are met for a commercial build and going into production, Standard Lithium is entitled to a 30% interest in the JV, meaning it will receive 30% of future net cash flows. Standard also has the potential to increase its JV ownership to 40% based upon achieving certain milestones.
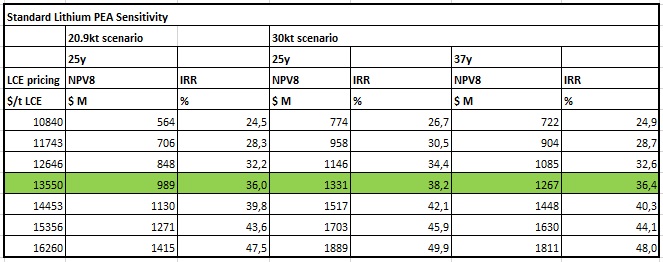
On June 19, 2019, the company announced the results of its PEA at the flagship project. The project has a staged build-out (three phases in five years planned), and aims at full nameplate production of 20,900t LCE annually. The final product lithium recovery is about 90%. Standard Lithium plans to produce battery-quality lithium carbonate as well, which sets them apart from a number of competitors that only manage to produce technical quality lithium carbonate. The economics indicate a pretty robust project, at a capex of US$437 million an operation can be constructed with an after-tax NPV8 of US$989 million and an after-tax IRR of 36%, based on an average long term LCE price of US$13,550/t. I viewed this base case price as high, as it was based on a three-year average, which is not very realistic in the lithium product realm. However, based on current LCE spot prices of about average US$11,500/t, after-tax figures would still come in economic, as I will show later on, and convinced me of the robustness of economics. Depending on successful testing, of course.
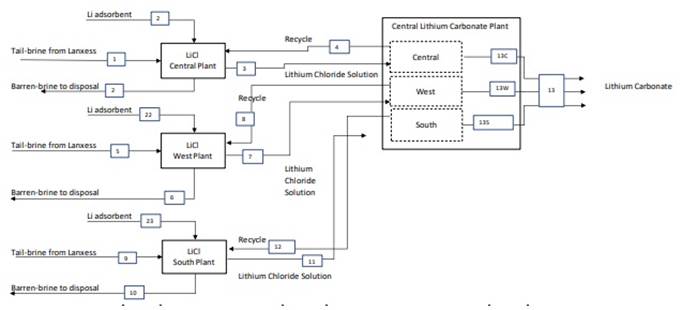
Standard Lithium’s objective is to produce battery-grade lithium carbonate from the tail-brine that exits the LANXESS bromine extraction operations. There are three bromine extraction operations that will be used for lithium extraction (South, Central and West). Each facility will have its own primary lithium chloride extraction plant, which will produce purified and concentrated lithium chloride solutions. These solutions will be conveyed, via pipelines, to one location (Central Plant) for further processing to the final product, which is lithium carbonate.
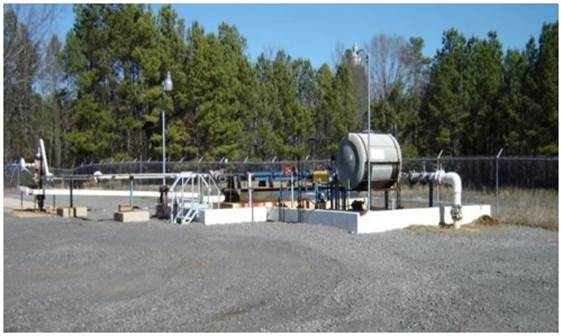
The tail brine is produced as part of Lanxess’ bromine extraction business. The brine is extracted from wells and the brine is transported to three processing plants through a network of pipelines. The spent de-brominated brine is then pumped back down into the ground through reinjection wells:
The project focuses on the 150k acres part of Lanxess’ land operations. The region is home to North America’s largest brine production and processing fairway. Southern Arkansas is seen as a business-friendly jurisdiction to be developing this project given its well-documented resource, large existing commercial brine production and ideal location with significant infrastructure, power, water, a skilled workforce and easy access to the Gulf of Mexico.
The lithium extraction process takes advantage of the fact that the brine leaves the bromine process heated at approximately 70°C. This means that no additional energy is required. The process can reduce the time required for lithium extraction from 1218 months (compared with the evaporation ponds) to hours and is capable of producing a high-purity lithium chloride (LiCl) solution for further processing towards battery-quality lithium carbonate. The combination of these unit operations represents a novel flowsheet with its inherent risks, of course.
Here is the technical description of the process taken from the PEA, for readers with interest in recovery tech:
“17.1.2 Lithium Extraction Process The key element of the production of purified lithium chloride solution is the selective lithium extraction process. The process includes mixing of the pre-treated tail-brine with a fine-grained, solid, ceramic powder adsorbent that selectively adsorbs lithium ions from the tail-brine. The adsorption process is carried out in two sequential loading reactors. Additional base (caustic or ammonia) is added to the loading reactors during the lithium extraction process to maintain the desired pH conditions. The lithium-depleted barren brine is separated from the loaded adsorbent slurry using submerged microfiltration (0.1 to 10 μm) membrane units. The lithium-loaded adsorbent solids are continuously removed as a slurry from the loading reactor. The adsorbent is washed with water in three (3) stages of counter-current decantation thickeners. The washed and thickened adsorbent is pumped as a slurry to a stripping operation.
17.1.3 Lithium Adsorbent Stripping and Regeneration Process Lithium loaded, and washed adsorbent is contacted with dilute hydrochloric acid in a stripping reactor. The stripping process generates lithium pregnant strip solution (PSS). The PSS is separated from the barren adsorbent in a thickener. The adsorbent is washed with fresh water in three (3) stages of countercurrent decantation thickeners. The washed adsorbent is recycled back to the lithium loading stage. After washing, the PSS has a high ratio of lithium to the sum of the other dissolved metals and contains 3-5 g/L of lithium. This lithium chloride solution is sent to further purification.”
Standard Lithium recognizes the aspect of risks accompanying the development of new recovery methods, and I asked CEO Mintak a few questions, in order to get a better understanding of things. First up was why he thought he would be successful with his new process, after Tenova and POSCO more or less have been testing into eternity.
Mintak: “We have successfully tested and scaled our direct extraction process at lab/bench scale >100x to a batch, and then continuous operating mini-pilot > now beginning installation of a 100X larger continuous operating industrial-scale demonstration plant (1/100 commercial scale). Both my partner Dr. Andy Robinson and I were with Pure Energy previously and have been working on direct extraction processing for a number of years. Without going into a long diatribe, the fundamental challenge overlooked by technology developers is they are trying to force a process on to the project. Our approach is that project drives the process. We have had the luxury of unlimited access to brine and production data since we started the project as Lanxess processes and reinjects approximately 20 million gallons of brine every day. We have been able to take thousands of gallons of brine to do process testing without the expense of exploration or permitting.
“We take a wholly different approach than Tenova Bateman, POSCO or any of the other extraction developers. Our core philosophy is again the project drives the process. Lithium extraction from brine is not the challenge, there are a number of ways that work but the project drives the selection of the appropriate process. Brine chemistry, access to water, cost of chemical reagents, permitting and re-injection, access to power and if required natural gas, just to name a few. We are also using equipment and processes already in use around the world (even at very large commercial-scale), so fortunately it is not all that experimental.”
I was wondering what the most likely scenario would be for Standard Lithium in the long run, could Lanxess choose to buy Standard outright after successful testing and an economic PFS satisfies their demands?
Mintak: “The JV as currently agreed between LXS and SLL is 70/30 in favor of LXS, with an option, subject to certain milestones, for SLL to achieve up to a 40% ownership. LXS has committed to project finance, no dilution for SLL. LXS has also committed to 100% of off-take. LXS will build and operate the plants. The likely scenario, if we are successful, is that LXS will choose to make more niche lithium compounds that may produce higher margins. The JV and MoU we have signed are built on battery quality lithium carbonate.
“We are proceeding on the project focused on successfully achieving the proof of concept on the LiSTR extraction process and delivering a positive PFS in a timely manner, which will then allow us to complete a definitive agreement and form the joint venture for commercial development. Of course along the way, as a publicly traded company, the acquisition of Standard Lithium is another scenario that could occur. But I would caution that it is upon us to demonstrate the LiSTR process works as we believe and at a competitive level near or better than our peers.”
Could there be any issues with permitting, despite being planned as an integrated part of Lanxess operations, located on their facilities?
Mintak: “As the project is by and large already fully permitted for commercial brine production and chemical processing, we expect to face little in the way of permits other than construction permits like electrical, storm water etc. Water and extraction rights are all in place with Lanxess. The project has been in production for more than 50 years.
“The contemplated commercial build of the project would fall largely under the existing permits held by LXS and by and large be within the fence of their existing operations. The brine is already flowing at a commercial scale, 6 billion gallons annually. Water for processing and other industrial use is already allocated under existing rights held by LXS. All three existing production facilities are located outside nearby city limits and are not subject to local planning and zoning ordinances. Union County does not regulate industrial siting and construction activities. Any modifications required to existing permits we anticipate no longer than 36 months. A fraction of the time an EIS or EA take.”
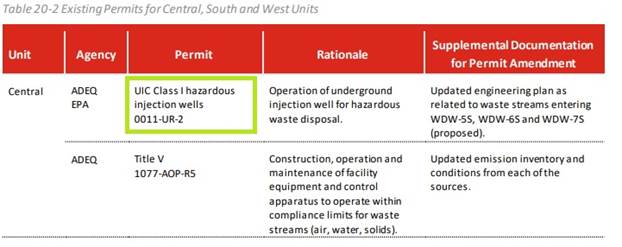
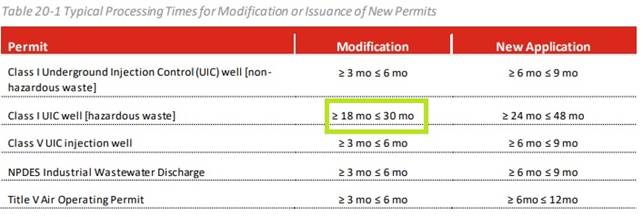
However, the PEA mentioned the following tables:
With the following modification periods:
CEO Mintak had the following to say about this, as there appears to be a few UIC Class I hazardous injection wells:
Mintak: “We do not foresee any modification to the hazardous waste permit as the extraction process is not introducing any new materials/chemicals to the final tail brine. Analysis from the demo plant brine post lithium extraction will be used to confirm this.”
We also talked about the optimization of brine for lithium, when will this take place and into how much improvement could this potentially result regarding economics?
Mintak: “The first stage of optimization will be on the extraction process, to optimize the opex and find efficiencies there. Once a PFS on the tail brine model has been completed and FEED (= optimization) work is underway we would look at the brine feed and well field optimization. We wouldn’t necessarily chase better economics, rather opportunities for a significant path to increased production as it could generate more cash flow.”
So the extraction optimization will be included in the PFS? If Lanxess makes a capex budgeting and construction decision based on the PFS, doesn’t mean increasing production afterwards that capex will need to be increased too?
Mintak: “Increased production would likely be a linear capex increase.”
You talked about increased brine production on the Lanxess claims, how much more production could be feasible if you can disclose? When could the Standard 27,000 acres come into play here, will this be at the end of LOM or before that, increasing production and increasing NPV?
Mintak: “The PEA considers a three-stage build out of a commercial operation over five years, So the earliest that the 27,000 acres of leases would be added for production would be at least five years. We will, however, be advancing the 27,000 acres with a PEA ourselves, then a PFS afterwards, likely reflecting an increased NPV. I would be speaking outside of my comfort zone by adding a certain number of tonnes to the total without a PEA on the 27,000 acres but 50% additional capacity would be a starting target point for us.”
As a newsletter writer I am not constrained by legal limitations on forward looking statements, and took the liberty to estimate calculations on an additional 9,100t LCE to come up with a rounded 30kt LOM annual production, in two scenarios: a prolonged one and one with increased production and linear increased capex:
In my estimates the larger operation is slightly more economic for IRR, as the additional cash flow in the early years (less discounted) is offset by the additional capex, compared to the no capex longer LOM, with larger discounts in the additional years of production. I have been very conservative with the NPV8, taking into account that management indicated to me that they expect a lot from optimization programs for brine and processing. As can be seen, the project economics hold up at current LCE prices of about US$11,500/t, but also at a US$10840/t LCE price, as I consider about 25% after-tax IRR as a minimum for lithium projects.
Notwithstanding these simple scenarios, there is more to this expansion concept, leaving some question marks.
Who will be paying which part of capex? What is the difference between the Lanxess acres and the Standard acres for economics? Do the JV terms also apply for the Standard acres? Aren’t these Standard acres more difficult to develop as they aren’t part of the current Lanxess production area, and need new wells, infrastructure, etc.? As a consequence, isn’t the Lanxess resource, despite the lower grade, much more efficient to add as a bolt on PFS scenario?
Mintak: “Upon the formation of the JV (subject to the proof of concept and positive PFS) the JV will assume all costs, with Lanxess having committed to funding the JV at the initial Lanxess project (150,000 acres). The future expanded production would be the responsibility of the JV company. Whether LXS continues to fund the JV for production at that point has not been discussed in detail yet and is at least five years out.
The 27,000 acres are greenfield and will involve drilling wells and installing the infrastructure, so capex would shift from piggybacking on the existing brine production but adding brine volume with higher-grade lithium will also improve opex, those numbers need to be quantified and qualified in a PEA, but we will be able to do that with the demonstration plant as we have access to significant volumes of brine from the area through agreements with regional oil and gas producers that have wells that perforate the Smackover formation.”
So it seems to be the same concept, except that Standard probably has to come to an agreement with Lanxess on land ownership and future additional infrastructure to transport any future LiCl to the central plant.
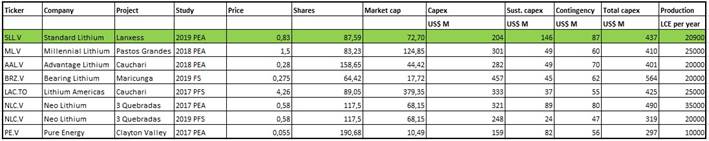
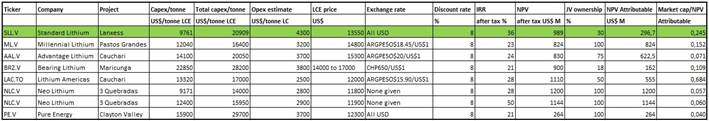
On a final note, I always like to see for myself where the subject of analysis stands regarding their peers, not in the least for determining future valuations. In this case, Standard Lithium doesn’t really have comparable peers in the mining field as it is more of a technical/chemical company, but most inputs for such a comparison are valid across the field of lithium juniors, so this resulted in the following tables:
And:
As can be seen, Standard Lithium already has quite a high market cap/attributable NPV ratio at the moment despite having completed just a PEA when comparing to others, but this can be explained by Standard having a far lower capex obligation in the JV (zero), being future part of a much larger operation, and them being relatively close to a financing decision, combined with strong funding efforts for their pilot/demonstration plants. Accounting for the staged development, they are actually priced for perfection at the moment in my view, as at US$11,500/t LCE the NPV8 for Standard is US$212 million, which is C$282 million.
The current market cap is C$71 million, which means about 25% of NPV8 at PEA stage, although I would like to discount for the staged development, meaning it will take a while until the project is at nameplate capacity and cash flows. Also take into account the C$1520 million that needs to be raised in the not-too-distant future. Therefore I view the current valuation at 50% of NPV8, which seems high for a PEA project when comparing to peers, but is in my view adequately representing the risk of a new recovery method combined with very low funding requirements for Standard, a very strong partner, good jurisdiction, short timeline to funding decision, and upside from optimization and more resources. The Standard Lithium thesis is all about the new recovery method in my view. If they succeed, and in this case it seems they have a significant chance, Lanxess will likely take care of everything else, and I can see this double from here when construction is on its way a year from now as the main risk has been taken away in that case.
6. Conclusion
Standard Lithium is a special case, as it takes on a new recovery method for lithium, something that has been tried for many years by large industrial players. However, considering its novel and research-driven academic approach and apparent ease regarding raising capital and arranging a JV with giant Lanxess, it seems something is different here. If the company manages to derisk this new method by successful testing and completing a positive PFS, Lanxess will probably not hesitate too long and fund construction. With Standard having more of a technical/chemical project, being in the backyard of Lanxess itself, it is likely that the project will see less extensive timelines and ramp-up issues compared to conventional brine operations. The upside isn’t huge but pretty decent in my view, but in about six months’ time we will see if it will be derisked significantly or not, and if so, barring a stock market crash or LCE prices dropping way below US$10,000/t, we are likely in for a re-rating. I like my chances here.
I hope you will find this article interesting and useful, and will have further interest in my upcoming articles on mining. To never miss a thing, please subscribe to my free newsletter on my website http://www.criticalinvestor.eu to get an email notice of my new articles soon after they are published.
The Critical Investor is a newsletter and comprehensive junior mining platform, providing analysis, blog and newsfeed and all sorts of information about junior mining. The editor is an avid and critical junior mining stock investor from The Netherlands, with an MSc background in construction/project management. Number cruncher at project economics, looking for high quality companies, mostly growth/turnaround/catalyst-driven to avoid too much dependence/influence of long-term commodity pricing/market sentiments, and often looking for long-term deep value. Getting burned in the past himself at junior mining investments by following overly positive sources that more often than not avoided to mention (hidden) risks or critical flaws, The Critical Investor learned his lesson well, and goes a few steps further ever since, providing a fresh, more in-depth, and critical vision on things, hence the name.
The Critical Investor Disclaimer: The author is not a registered investment advisor, and currently has a long position in this stock. Standard Lithium is a sponsoring company. All facts are to be checked by the reader. For more information go to www.standardlithium.com and read the company’s profile and official documents on www.sedar.com, also for important risk disclosures. This article is provided for information purposes only, and is not intended to be investment advice of any kind, and all readers are encouraged to do their own due diligence, and talk to their own licensed investment advisors prior to making any investment decisions.
Streetwise Reports Disclosure: 1) The Critical Investor’s disclosures are listed above. 2) The following companies mentioned in the article are sponsors of Streetwise Reports: None. Click here for important disclosures about sponsor fees. The information provided above is for informational purposes only and is not a recommendation to buy or sell any security. 3) Statements and opinions expressed are the opinions of the author and not of Streetwise Reports or its officers. The author is wholly responsible for the validity of the statements. The author was not paid by Streetwise Reports for this article. Streetwise Reports was not paid by the author to publish or syndicate this article. Streetwise Reports requires contributing authors to disclose any shareholdings in, or economic relationships with, companies that they write about. Streetwise Reports relies upon the authors to accurately provide this information and Streetwise Reports has no means of verifying its accuracy.
4) The article does not constitute investment advice. Each reader is encouraged to consult with his or her individual financial professional and any action a reader takes as a result of information presented here is his or her own responsibility. By opening this page, each reader accepts and agrees to Streetwise Reports’ terms of use and full legal disclaimer. This article is not a solicitation for investment. Streetwise Reports does not render general or specific investment advice and the information on Streetwise Reports should not be considered a recommendation to buy or sell any security. Streetwise Reports does not endorse or recommend the business, products, services or securities of any company mentioned on Streetwise Reports. 5) From time to time, Streetwise Reports LLC and its directors, officers, employees or members of their families, as well as persons interviewed for articles and interviews on the site, may have a long or short position in securities mentioned. Directors, officers, employees or members of their immediate families are prohibited from making purchases and/or sales of those securities in the open market or otherwise from the time of the interview or the decision to write an article until three business days after the publication of the interview or article. The foregoing prohibition does not apply to articles that in substance only restate previously published company releases.