USD Ending The Week At Highs

By Orbex

US Data on Watch

The US dollar is ending the week on a firm footing with the USD index rallying again over the European morning on Friday, trading 98.86 last.

Despite US Q2 GDP yesterday confirming a lower level of growth from Q1, USD remains well bid. Looking ahead today, the final US data prints of the week will be durable goods and PCE, both for August.
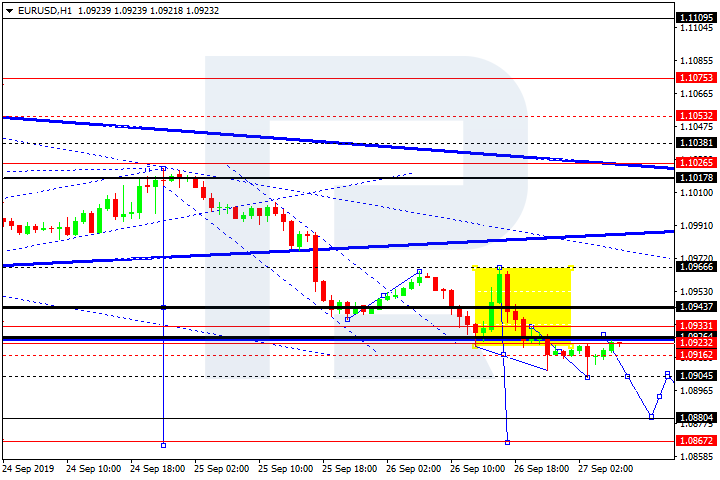
EUR Testing Support

EURUSD has posted a minor recovery over early trading on Friday, though ends the week firmly lower with price having tested below the 1.0914 level twice this week.

Data weakness in the eurozone has weighed heavily on sentiment across the week with a range of survey sets released this morning also undershooting expectations.

GBP Going Down

GBPUSD has ended the week on a negative note. Despite Johnson losing his Supreme Court case and parliament returning, uncertainty around Brexit is keeping GBP pressured.

Johnson has threatened to prorogue parliament once again, exacerbating fears. Meanwhile, reports today highlight BOE’s Saunders saying that ongoing Brexit uncertainty might require a rate cut to support the economy. GBPUSD trades 1.2286 last.

Risk Markest Rally on Friday

Risk assets have ended the week on a better note though many indexes are ending the week in the red. News of impeachment proceedings being launched against Trump knocked risk appetite earlier in the week.

However, optimism around the next round of US-China trade talks helped sentiment recover into the back of the week. SPX500 trades 2986 last, ending the week just below the open as of writing.

JPY & Gold Down

Safe havens have both been lower over the week under the pressure of a resurgent US dollar and better risk appetite into the end of the week. JPY and gold have both weakened against the USD.

XAUUSD trades 1492.41 last with the rejection from 1522.75 gathering pace now. USDJPY trades 108.45 last with price making ist way back towards last week’s highs.

Crude Stabilizes

Oil prices have ended the week lower though downside momentum has stalled over the second half of the week. The EIA reported a further build in US crude stores last week which weighed heavily on oil.

News of a further rise in US crude production added weight to the sell-off. However, optimism around the next round of US-China trade talks due on October 10th has stemmed the declines. Crude trades 56.46 last.

CAD Fights Back

USDCAD has been under pressure again today, despite weaker oil prices and a stronger USD. CAD seems to be deriving some support for trade deal optimism which improves the outlook for commodities. USDCAD trades 1.3253 last, sitting right in the middle of the 1.3207 – 1.33 range.

Aussie Ends Week Lower

AUDUSD has managed to stay in the green today (only just) though ends the week lower. Comments from RBA Governor Lowe over the week have increased expectations for a further RBA rate cut next week. The slide in gold prices this week has also hit the Aussie. AUDUSD trades .6749 last.

By Orbex


US stocks end lower on ebbing trade optimism

By IFCMarkets

Dollar strengthens as pending home sales rise

US stocks pulled back again on Thursday after reports US is unlikely to extend a waiver allowing American firms to do business with Chinese Huawei when it expires in November. The S&P 500 slipped 0.2% to 2977.62. The Dow Jones industrial average lost 0.3% to 26891.12. Nasdaq composite index fell 0.6% to 8030.66. The dollar strengthening continued after report US pending home sales index rose in August 2.5% over year, while the number of Americans applying for new unemployment benefits rose by 3,000 to 213,000 last week: the live dollar index data show the ICE US Dollar index, a measure of the dollar’s strength against a basket of six rival currencies, rose 0.2% to 99.20 and is higher currently. Stock index futures point to higher openings today.

FTSE 100 paces European indexes gains

European stocks recovered on Thursday after positive data. Both EUR/USD and GBP/USD continued falling yesterday with Pound moving higher currently against dollar while euro lower still. The Stoxx Europe 600 index ended 0.7% higher with utility shares pacing advancers. Germany’s DAX 30 advanced 0.4% to 12288.54 on GfK report German consumer confidence index rose for the first time in 2019 to come in at 9.9 for October following a reading of 9.7 for September. France’s CAC 40 rose 0.66% while UK’s FTSE 100 gained 0.8% to 7351.08 as UK car production rose for the first time in 15 months.

GB100 breached above MA(50)  09/27/2019 Market Overview IFC Markets chart

Nikkei falls ahead of sales tax

Asian stock indices are mixed today. Nikkei pulled back 0.8% to 21878.90 ahead of October 1 hike in Japan’s sales tax to 10% from the current 8% with yen little changed against the dollar. Chinese stocks are mixed after report China’s industrial profits dropped 2% in August from a year earlier: the Shanghai Composite Index is up 0.1% while Hong Kong’s Hang Seng Index is 0.4% lower. Australia’s All Ordinaries Index rebounded 0.6% erasing previous session loss despite resumed Australian dollar climb against the greenback.

Brent falls

Brent futures prices are edging lower today. Prices rose yesterday after news the US will deploy one “patriot battery, four sentinel RADARs and approximately 200 support personnel” to Saudi Arabia: November Brent gained 0.6% to $62.74 a barrel on Thursday.

Market Analysis provided by IFCMarkets

Note:
This overview has an informative and tutorial character and is published for free. All the data, included in the overview, are received from public sources, recognized as more or less reliable. Moreover, there is no guarantee that the indicated information is full and precise. Overviews are not updated. The whole information in each overview, including opinion, indicators, charts and anything else, is provided only for familiarization purposes and is not financial advice or а recommendation. The whole text and its any part, as well as the charts cannot be considered as an offer to make a deal with any asset. IFC Markets and its employees under any circumstances are not liable for any action taken by someone else during or after reading the overview.

CATTLE Analysis: Higher placements bullish for FCATTLE

By IFCMarkets

Higher placements bullish for FCATTLE

US cattle placements rose in August. Will the FCATTLE continue gaining?

According to the USDA Cattle on Feed Report for September released last Friday, placements in feedlots during August were higher compared to same period a year ago: 1.884 million head in total, 9 percent above August 2018. Cattle on feed over 90 days and over 120 days were well above last year, but both appear to be displaying the typical seasonal declines. Against the backdrop of the report indicating strong demand for beef, higher placements are bullish for FCATTLE.

FCATTLE rises above MA(200) 09/27/2019 Technical Analysis IFC Markets chart

On the daily timeframe the FCATTLE: D1 has closed above the 200-day moving average MA(200).

  • The Parabolic indicator gives a buy signal.
  • The Donchian channel indicates uptrend: it is widening up.
  • The MACD indicator gives a bullish signal: it is above the signal line and the gap is widening.
  • The RSI oscillator is near the overbought zone but has not crossed into it.

We believe the bullish momentum will continue after the price breaches above the upper boundary of Donchian channel at 143.19. This level can be used as an entry point for placing a pending order to buy. The stop loss can be placed below the lower Donchian boundary at 134.22. After placing the order, the stop loss is to be moved every day to the next fractal low, following Parabolic signals. Thus, we are changing the expected profit/loss ratio to the breakeven point. If the price meets the stop loss level (134.22) without reaching the order (143.19), we recommend cancelling the order: the market has undergone internal changes which were not taken into account.

Technical Analysis Summary

OrderBuy
Buy stopAbove 143.19
Stop lossBelow 134.22

Market Analysis provided by IFCMarkets

How To Use Technical Analysis To Trade Trends

By Orbex

There are many advantages to trend trading! Especially for retail forex traders who don’t have the time to sit in front of their trading platform all day.

It tends to be a lot safer, and provide better results in the long run.

Mostly this is because there is much more time to make a trading decision before risking assets on the forex market, so there is a better opportunity to collect more information about what’s going on.

Trend FX traders usually make a few trades a month, looking to capitalize on long-term moves in the forex markets. These days to months-long market shifts tend to be much more stable, and less likely to be interrupted by small news events.

So, having a good understanding of technical forex trading is valuable for every trend trader.

The Market is Technical

Many of the techniques developed for trend trading come from trading in commodities. This is because they tend to… well, trend.

This is why there is an appeal for commodity-based currencies among trend traders, such as the CAD, NZD, and AUD.

Many of the characteristics of trading commodities also apply to the forex markets, particularly one that is especially relevant to technical trading: the law of supply and demand.

Prices fluctuate based on the demand for and supply of a certain asset. Commodities trend because there is typically an offset between supply and demand. Currencies are similar, but the supply comes from central banks, usually in response to economic conditions.

Expectations surrounding supply and demand, therefore, push the price up and down in sweeping cycles.

Identifying the Key Spots

A currency pair will trend higher when there is more demand. And it’ll trend downward when there is more supply.

At any given moment, there is a certain number of forex traders who want to sell, and a certain number who want to buy.

If all the sellers manage to sell, then only buyers are left, and the currency will trend higher until the market becomes attractive for more people to sell. As the pair rises, more FX traders have made a profit with their trade, and want to exit.

Therefore, we want to be looking for instances when there is a disconnect between supply and demand, that show the start or end of a trend.

How the forex market behaves; the number of trades, the speed at which it moves, price fluctuations…  These all give us insight into the balance between supply and demand.

There are a host of technical indicators that are specifically designed to extract information on supply and demand from the market, and help you develop your forex trading strategy.

The Indicators

The most basic FX indicator when trend trading is a simple moving average. By averaging out the last trades over a period of time, it’s easier to cut out the noise in the market and identify the trend.

The most common indicator for trend trading is Fibonacci regression. It’s based on a mathematical progression that a lot of people believe is found in the market. And because enough people believe in it, it actually comes true. This helps find support and resistance levels where a lot of forex traders have put their take profit and stop-loss orders, which would set off a new trend.

Other indicators that are useful with trend trading include MACD and RSI. There are other articles that discuss how to get the most of those indicators when trend trading.

The Best Kind of Correct

Technically, you can trade on technicals alone. But the advantage of trend trading is having the time and opportunity to get the most information about the market as possible before trading.

Fundamentals underly currency movements and help drive technical aspects. But the best trading is done with as broad an understanding of the forex market as possible.

By Orbex


Forex Technical Analysis & Forecast 27.09.2019 (EURUSD, GBPUSD, USDCHF, USDJPY, AUDUSD, USDRUB, USDCAD, GOLD, BRENT, BTCUSD)

Article By RoboForex.com

EURUSD, “Euro vs US Dollar”

After reaching the downside target at 1.0920 and completing the correction towards 1.0966, EURUSD started another decline with the target at 1.0868 and has already broken 1.0922 to expand the range downwards. After that, the instrument may test 1.0922 from below and then resume trading inside the downtrend with the target at 1.0882.

EURUSD
Risk Warning: the result of previous trading operations do not guarantee the same results in the future

GBPUSD, “Great Britain Pound vs US Dollar”

GBPUSD is still consolidating around 1.2333. Possibly, today the pair may start a new decline towards 1.2283 and then resume trading upwards to return to 1.2333.

GBPUSD
Risk Warning: the result of previous trading operations do not guarantee the same results in the future

USDCHF, “US Dollar vs Swiss Franc”

After finishing the correction at 0.9910, USDCHF is forming one more ascending structure with the target at 0.9955. Later, the market may start a new decline towards 0.9920.

USDCHF
Risk Warning: the result of previous trading operations do not guarantee the same results in the future

USDJPY, “US Dollar vs Japanese Yen”

USDJPY has reached another upside target at 107.90; right now, it is moving downwards. Possibly, the pair may form a new descending structure towards 107.44 and then resume trading upwards with the target at 108.21.

USDJPY
Risk Warning: the result of previous trading operations do not guarantee the same results in the future

AUDUSD, “Australian Dollar vs US Dollar”

AUDUSD is still falling. Today, the pair may form a new descending structure towards 0.6735 and then start another correction with the target at 0.6817.

AUDUSD
Risk Warning: the result of previous trading operations do not guarantee the same results in the future

USDRUB, “US Dollar vs Russian Ruble”

USDRUB continues consolidating above 64.00. Possibly, the pair may fall to reach 63.90 and then start another growth towards 64.55 to complete the correction. Later, the market may resume trading inside the downtrend with the target at 63.30.

USDRUB
Risk Warning: the result of previous trading operations do not guarantee the same results in the future

USDCAD, “US Dollar vs Canadian Dollar”

USDCAD is consolidating above 1.3260. According to the main scenario, the instrument may fall to reach 1.3220 and then resume trading upwards with the target at 1.3300.

USDCAD
Risk Warning: the result of previous trading operations do not guarantee the same results in the future

XAUUSD, “Gold vs US Dollar”

Gold is consolidating 1504.44. The main scenario implies that the pair may form a new descending wave to reach 1496.55. After that, the instrument may start a new growth with the target at 1511.60.

GOLD
Risk Warning: the result of previous trading operations do not guarantee the same results in the future

BRENT

Brent is consolidating above 61.43. Possibly, the pair expand the range towards 60.70 and then form one more ascending structure to beak 63.36. Later, the market may continue trading upwards with the first target at 65.55.

BRENT
Risk Warning: the result of previous trading operations do not guarantee the same results in the future

BTCUSD, “Bitcoin vs US Dollar”

After breaking 8068.00, BTCUSD continues falling and forming a continuation pattern. Today, the pair may reach 7515.00 and then start a new growth to return to 8068.00. Later, the market may continue trading inside the downtrend with the target at 7373.00.

BTCUSD

Article By RoboForex.com

Attention!
Forecasts presented in this section only reflect the author’s private opinion and should not be considered as guidance for trading. RoboForex LP bears no responsibility for trading results based on trading recommendations described in these analytical reviews.

Fibonacci Retracements Analysis 27.09.2019 (BITCOIN, ETHEREUM)

Article By RoboForex.com

BTCUSD, “Bitcoin vs US Dollar”

As we can see in the daily chart, the pair is no longer trading inside the correctional Triangle; it has broken 50.0% fibo and right now is moving towards 61.8% and 76.0% fibo at 7350.00 and 5860.00 respectively. If the price breaks the current resistance level (38.2% fibo at 9840.00), BTCUSD will continue growing to reach the high at 13857.20.

BTCUSD
Risk Warning: the result of previous trading operations do not guarantee the same results in the future

In the H4 chart, the pair is moving to the downside to reach 61.8% fibo at 7350.00. However, after that, the price is expected to start a new pullback towards 50.0% fibo.

BITCOIN
Risk Warning: the result of previous trading operations do not guarantee the same results in the future

ETHUSD, “Ethereum vs. US Dollar”

As we can see in the H4 chart, the convergence made the pair complete the correctional uptrend at 38.2% fibo and start a new descending impulse. By now, the price has already updated the previous low and is currently moving towards the post-correctional extension area between 138.2% and 161.8% fibo at 140.40 and 125.85 respectively.

ETHUSD
Risk Warning: the result of previous trading operations do not guarantee the same results in the future

The H1 chart shows more detailed structure of the current decline and the correction. By now, the pair has already reached 23.6% fibo. Later, the price may continue growing towards 38.2% and 50.0% fibo at 179.80 and 188.40 respectively. The support is the low at 152.28.

ETHEREUN

Article By RoboForex.com

Attention!
Forecasts presented in this section only reflect the author’s private opinion and should not be considered as guidance for trading. RoboForex LP bears no responsibility for trading results based on trading recommendations described in these analytical reviews.

UK Prime Minister’s secret Brexit plans: Time to hard-Brexit proof investments

By George Prior

Boris Johnson’s reported secret plans to circumnavigate parliament and deliver Brexit means you should now consider hard Brexit-proofing your finances, warns the CEO of the world’s largest independent financial advisory organization.

The warning from deVere Group’s founder and chief executive, Nigel Green, comes as it is reported by City AM on Friday that the UK government believes it can get Brexit over the line on October 31 as the Article 50 deadline – European legislation – overrides any British attempt to stop it – in the form of the UK parliament’s Benn Act.

In addition, Sir John Major, the former Prime Minister, has warned that Boris Johnson could use ‘political chicanery’ to try to force No Deal Brexit at the end of October.

He said he worried the privy council’s powers could be abused to suspend the law designed to stop the UK crashing out.

Mr Green notes: “Under the Benn Act, Boris Johnson must ask the EU for an extension to Article 50 if no Brexit deal wins a pass through parliament by 19 October.

“The PM has said he would comply with this requirement – while at the same time saying the UK will definitely leave the EU on October 31.

“This sounds contradictory.  And maybe the reason he is saying this is his reported secret plan to use EU law to override British law and stick to the EU-imposed deadline of Halloween to deliver Brexit.”

He continues: “Mr Johnson seems determined to get Brexit done come what may – including allegedly lying to the Queen and unlawfully suspending parliament.

“So it will come as no surprise to many that he would also ride roughshod over British processes and somewhat ironically invoke European ones – to get it over the line.

“This raises the spectre considerably of a hard Brexit.”

He goes on to say: “With the pound likely to be further pummelled by crashing out, with UK financial assets – perhaps with the exception of real estate – taking a hit, and with the impact on international exports and global implications for international trade, it’s imperative that investors revise their portfolios.

“They need to ensure that they are properly diversified to mitigate the risks and are best-positioned to seize the important buying opportunities to grow their wealth.”

Mr Green concludes: “It can be expected that a growing number of UK and global investors will move their assets overseas as Britain stumbles towards a hard Brexit.”

About:

deVere Group is one of the world’s largest independent advisors of specialist global financial solutions to international, local mass affluent, and high-net-worth clients.  It has a network of more than 70 offices across the world, over 80,000 clients and $12bn under advisement.


The Analytical Overview of the Main Currency Pairs on 2019.09.27

by JustForex

The EUR/USD currency pair

Technical indicators of the currency pair:
  • Prev Open: 1.09426
  • Open: 1.09202
  • % chg. over the last day: -0.19
  • Day’s range: 1.09046 – 1.09256
  • 52 wk range: 1.0905 – 1.1652

The EUR/USD currency pair continues to show a negative trend. The trading instrument reached annual lows. Yesterday, the USD was supported by positive economic releases. Deputy Chairman of the Fed Richard Clarida said that the current economic situation in the United States is close to the goal of the Central Bank. At the moment, the EUR/USD quotes are testing local support and resistance levels of 1.09100 and 1.09400, respectively. We recommend that you keep track of up-to-date information regarding trade negotiations between Washington and Beijing. Positions must be opened from key levels.

The Economic News Feed for 27.09.2019:

  • – Orders on Durable Goods (US) – 15:30 (GMT+3:00);
  • – Personal Expenses (US) – 15:30 (GMT+3:00);
EUR/USD

Indicators signal the strength of sellers: the price has fixed below 50 MA and 100 MA.

The MACD histogram is in the negative zone, but above the signal line, which gives a weak signal to sell EUR/USD.

The Stochastic Oscillator is near the overbought zone, the %K line crossed the %D line. There are no signals at the moment.

Trading recommendations
  • Support levels: 1.09100, 1.08700
  • Resistance levels: 1.09400, 1.09650, 1.09900

If the price consolidates below 1.09100, expect a further drop toward 1.08800-1.08600.

Alternatively, the quotes could recover toward 1.09600-1.09800.

The GBP/USD currency pair

Technical indicators of the currency pair:
  • Prev Open: 1.23455
  • Open: 1.23188
  • % chg. over the last day: -0.18
  • Day’s range: 1.23148 – 1.23363
  • 52 wk range: 1.1995 – 1.3385

The GBP/USD currency pair has stabilized after a significant drop since the beginning of this week. Quotes are currently being consolidated. There is no defined trend. The key support and resistance levels are 1.23100 and 1.23650, respectively. The trading instrument has the potential to further decline. Today, investors will evaluate important economic reports from the United States. We also recommend keeping track of up-to-date information regarding the Brexit process. Positions must be opened from key levels.

The Economic News Feed for 27.09.2019 is calm.

  • – Economic Event (GB) – 00:00 (GMT+3:00);
  • – Economic Event (GB) – 00:00 (GMT+3:00);
  • – Economic Event (GB) – 00:00 (GMT+3:00);
GBP/USD

Indicators signal the strength of sellers: the price has fixed below 50 MA and 100 MA.

The MACD histogram is in the negative zone, but above the signal line, which gives a weak signal to sell GBP/USD.

The Stochastic Oscillator is near the overbought zone, the %K line crossed the %D line. There are no signals at the moment.

Trading recommendations
  • Support levels: 1.23100, 1.22600
  • Resistance levels: 1.23650, 1.24150, 1.24550

If the price consolidates below 1.23100, expect further drop toward 1.22700-1.22600.

Alternatively, the quotes could grow toward 1.24000.

The USD/CAD currency pair

Technical indicators of the currency pair:
  • Prev Open: 1.32657
  • Open: 1.32649
  • % chg. over the last day: -0.01
  • Day’s range: 1.32638 – 1.32784
  • 52 wk range: 1.2727 – 1.3664

The technical picture on the USD/CAD currency pair is still ambiguous. Looney is trading in a long flat. At the moment, the local support and resistance levels are 1.32550 and 1.32800, respectively. USD/CAD quotes have the potential to decline. Today, financial market participants will evaluate important economic releases from the United States. We also recommend that you pay attention to the dynamics of prices of “black gold”. Positions must be opened from key levels.

The Economic News Feed for 27.09.2019 is calm.

USD/CAD

Indicators do not give accurate signals: 50 MA crossed 100 MA.

The MACD histogram is in the positive zone, but below the signal line, which gives a weak signal to buy USD/CAD.

Stochastic Oscillator is in the neutral zone, the %K line crossed the %D line. There are no signals at the moment.

Trading recommendations
  • Support levels: 1.32550, 1.32350, 1.32100
  • Resistance levels: 1.32800, 1.33000

If the price consolidates below 1.32550, expect the quotes to fall toward 1.32350-1.32100.

Alternatively, the quotes can grow toward 1.33000-1.33100.

The USD/JPY currency pair

Technical indicators of the currency pair:
  • Prev Open: 107.738
  • Open: 107.827
  • % chg. over the last day: +0.05
  • Day’s range: 107.655 – 107.849
  • 52 wk range: 104.97 – 114.56

An ambiguous technical picture has developed on the USD/JPY currency pair. The trading instrument is in lateral movement. There is no defined trend. At the moment, the local support and resistance levels are 107.600 and 107.900, respectively. We are expecting important statistics from the USA. We also recommend monitoring the progress of trade negotiations between Washington and Beijing. Positions must be opened from key levels.

The Economic News Feed for 27.09.2019 is calm.

USD/JPY

Indicators do not give accurate signals: the price is consolidating near 50 MA and 100 MA.

The MACD histogram is in the positive zone, but below the signal line, which gives a weak signal to buy USD/JPY.

The Stochastic Oscillator is in the neutral zone, the %K line is above the %D line, which indicates a bullish sentiment.

Trading recommendations
  • Support levels: 107.600, 107.350, 107.000
  • Resistance levels: 107.900, 108.150, 108.350

If the price consolidates above 107.900, look for the entry points on the market since the price will rise toward 108.200-108.400.

Alternatively, the quotes could drop toward 107.350-107.100.

by JustForex

Is Gold At A Major Turning Point?

By Orbex

Gold

The yellow metal ended the week lower as a resurgent US dollar weighed on price.

Gold had initially been stronger in the week thanks to concerns over President Trump facing impeachment weighing on risk sentiment. Speaker of the House Nancy Pelosi launched impeachment proceedings over a phone conversation between Trump and the Ukrainian president regarding Joe Biden.

Following some initial weakness in equities, however, risk sentiment soon recovered.

Midweek, comments from Trump at the UN also supported risk sentiment. The President stated that a deal with China could come sooner than people think.

The market recently heard that the Trump administration was considering an “interim” deal with China which would see the US scaling back some of the current tariffs, as well as postponing others. This would be in exchange for China making commitments over intellectual property and US agricultural purchases.

Negotiators from both sides are due to meet in the US in under two weeks. For now, optimism around the meetings is keeping gold prices lower as risk sentiment remains buoyant.

The US dollar remained firm over the week despite US Q2 GDP coming in at an unchanged 2%, confirming slower growth over the quarter than Q1.

For now, the main story for the US dollar continues to be reduced expectations of further Fed easing. This will likely gain traction should we see progress with US-China trade talks, keeping USD supported.

Technical Perspective

xauusd

Gold prices tested the long term 1522.75 level once again this week and have reversed. For now, this move appears corrective and a further push to the upside is still in the outlook.

However, there is the risk of gold putting in a lower high now and this current move can extend a little lower towards the 1433.24 level. While we hold above the 1433.24 level though, focus is on a further grind to the upside. If we break below the 1433.24 level, the 1392.28 level is the next support zone to watch.

Silver

Silver prices have had a disappointing week also.

Tracking the moves in gold, silver started the week on a firm footing before reversing lower over the second half of the week. Silver has been caught in the crossfire recently between the ongoing US-China trade negotiations and expectations around further easing from the Fed.

Unlike gold, however, silver can still see some upside should an end to the trade war present itself. This is thanks to the support it derives from higher equities prices, particularly the industrials.

Technical Perspective

xagusd

Silver prices continue to range between the 17.3408 support and resistance at the 18.6397 level. Having retested the resistance level this week and reversed sharply lower. While the support level holds, focus remains on a further rotation higher.

However, If prices break down below the current support, the next major support level is down at the 16.2130 which also holds the retest of the broken long term bearish trend line. To the topside, the 18.6397 level remains the key marker to break.

By Orbex


The US Currency Continues to Grow. The Euro Is Declining

by JustForex

The US dollar strengthened against a basket of major currencies. The dollar index (#DX) closed yesterday’s trading session in the positive zone (+0.11%). Investors have not particularly responded to the news about the possible US President D. Trump impeachment, as they believe that he can avoid the procedure. Financial market participants paid more attention to news about the progress in trade negotiations between the US and China.

Mixed economic data from the US was published yesterday. Thus, GDP (q/q) counted to 2.0% in the second quarter, as experts expected. Initial jobless claims increased by 213K, while experts expected 212K. At the same time, the pending home sales index grew by 1.6% instead of the forecasted growth by 0.9%.

The Euro continues to decline against the US currency, despite the optimistic data published this week. The comments by ECB chief economist, Lane, also did not cheer up investors. He said that the stimulus package announced this month was not sufficient and the regulator would not be able to reach the limits of the quantitative easing program for a long period of time.

The “black gold” prices are consolidating. Currently, futures for the WTI crude oil are testing the $56.75 mark per barrel.

Market Indicators

Yesterday, the bearish sentiment was observed in the US stock markets: #SPY (-0.21%), #DIA (-0.26%), #QQQ (-0.37%).

The 10-year US government bonds yield is at 1.70-1.71%.

The Economic News Feed for 27.09.2019:
  • – Core durable goods orders in the US at 15:30 (GMT+3:00).

by JustForex