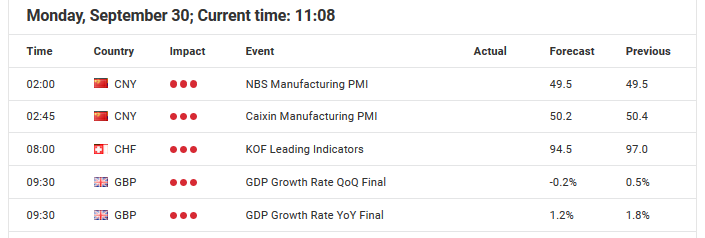
As we start the week, we want to take a look at the premiere German equity index, DAX30 CFD. But despite a packed economic calendar, no relevant data is published for equities.
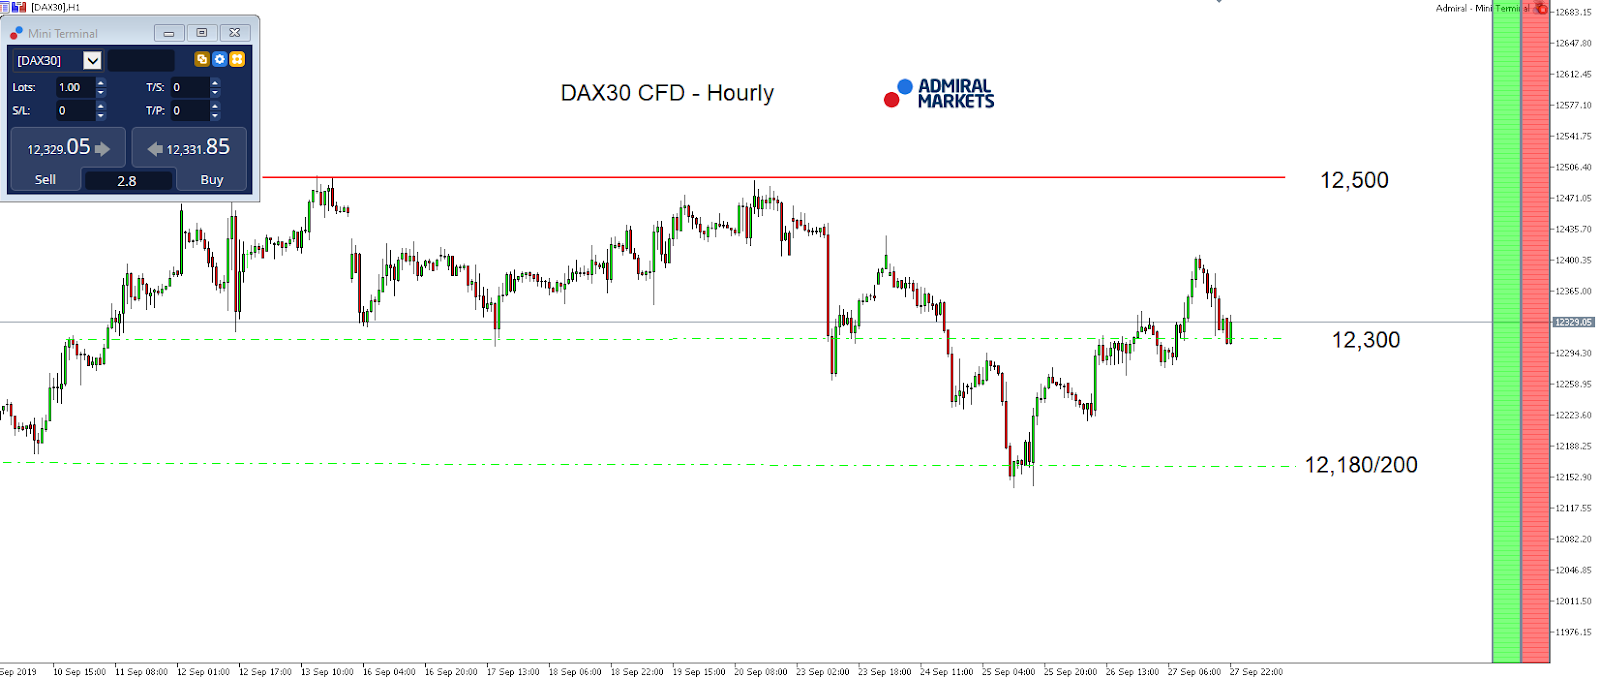
That’s why we want to focus primarily on the technical side in the DAX30 CFD today. After the last week of trading resulted in a sustainable drop below 12,300 points, the long sequence on H1 can be considered broken.
Nevertheless, the DAX30 CFD saw a drift back, and a weekly close clearly above 12,300 points. With the upcoming German bank holiday on Thursday, October 3 (for an update of the trading hours in Cash and Futures Index CFDs, check our News section on the website HERE), it seems likely that the German index continues with its drift higher and we get to see a test of the current September highs around 12,500 points.
This is especially true as long as no new tensions in the trade dispute between the US and China arise.
Another short pullback against 12,300 should be carefully watched since this region could act as an attractive Long trigger.
Only a drop below the pre-weekly lows around 12,140/150 points would significantly darken the picture and switch our focus on the psychological relevant region around 12,000 points:
Source: Admiral Markets MT5 with MT5-SE Add-on DAX30 CFD Hourly chart (between September 9, 2019, to September 27, 2019). Accessed: September 27, 2019, at 10:00pm GMT
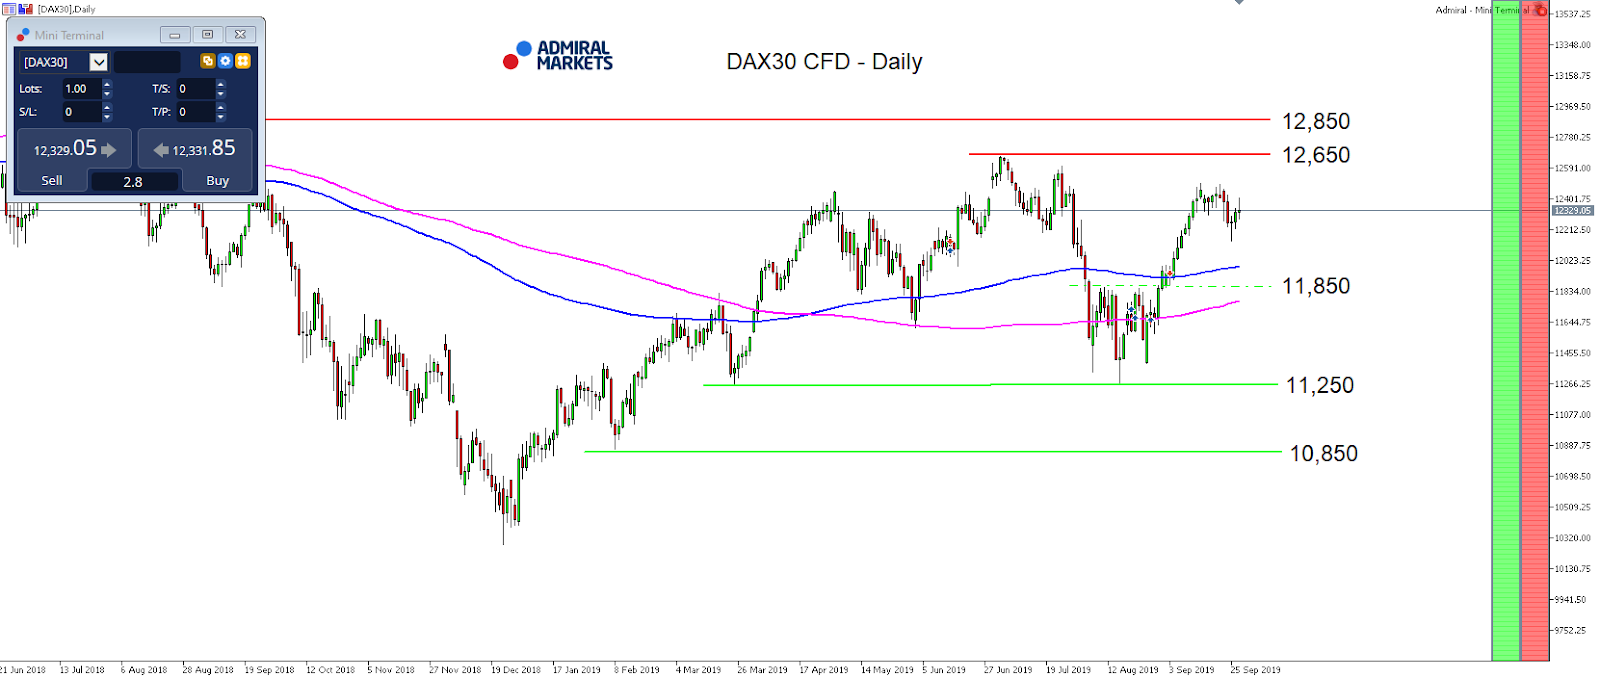
Source: Admiral Markets MT5 with MT5-SE Add-on DAX30 CFD Daily chart (between June 21, 2018, to September 27, 2019). Accessed: September 27, 2019, at 10:00pm GMT – Please note: Past performance is not a reliable indicator of future results, or future performance.
In 2014, the value of the DAX30 CFD increased by 2.65%, in 2015, it increased by 9.56%, in 2016, it increased by 6.87%, in 2017, it increased by 12.51%, in 2018, it fell by 18.26%, meaning that after five years, it was up by 10.5%.
Discover the world’s #1 multi-asset platform
Admiral Markets offers professional traders the ability to trade with a custom, upgraded version of MetaTrader 5, allowing you to experience trading at a significantly higher, more rewarding level. Experience benefits such as the addition of the Market Heat Map, so you can compare various currency pairs to see which ones might be lucrative investments, access real-time trading data, and so much more. Click the banner below to start your FREE download of MT5 Supreme Edition!
Disclaimer: The given data provides additional information regarding all analysis, estimates, prognosis, forecasts or other similar assessments or information (hereinafter “Analysis”) published on the website of Admiral Markets. Before making any investment decisions please pay close attention to the following:
This is a marketing communication. The analysis is published for informative purposes only and are in no way to be construed as investment advice or recommendation. It has not been prepared in accordance with legal requirements designed to promote the independence of investment research, and that it is not subject to any prohibition on dealing ahead of the dissemination of investment research.
Any investment decision is made by each client alone whereas Admiral Markets shall not be responsible for any loss or damage arising from any such decision, whether or not based on the Analysis.
Each of the Analysis is prepared by an independent analyst (Jens Klatt, Professional Trader and Analyst, hereinafter “Author”) based on the Author’s personal estimations.
To ensure that the interests of the clients would be protected and objectivity of the Analysis would not be damaged Admiral Markets has established relevant internal procedures for prevention and management of conflicts of interest.
Whilst every reasonable effort is taken to ensure that all sources of the Analysis are reliable and that all information is presented, as much as possible, in an understandable, timely, precise and complete manner, Admiral Markets does not guarantee the accuracy or completeness of any information contained within the Analysis. The presented figures refer that refer to any past performance is not a reliable indicator of future results.
The contents of the Analysis should not be construed as an express or implied promise, guarantee or implication by Admiral Markets that the client shall profit from the strategies therein or that losses in connection therewith may or shall be limited.
Any kind of previous or modeled performance of financial instruments indicated within the Publication should not be construed as an express or implied promise, guarantee or implication by Admiral Markets for any future performance. The value of the financial instrument may both increase and decrease and the preservation of the asset value is not guaranteed.
The projections included in the Analysis may be subject to additional fees, taxes or other charges, depending on the subject of the Publication. The price list applicable to the services provided by Admiral Markets is publicly available from the website of Admiral Markets.
Leveraged products (including contracts for difference) are speculative in nature and may result in losses or profit. Before you start trading, you should make sure that you understand all the risks.
By Hussein Sayed, Chief Market Strategist (Gulf & MENA), ForexTime
The US did not confirm plans to ban Chinese companies’ listings
Investors awaiting NFP report to assess the Fed’s next move
Reserve Bank of Australia expected to lower interest rates
Sterling volatility to increase in the weeks ahead
Equity markets in Asia kicked off the week mixed after the S&P 500 posted a 0.5% decline on Friday following the latest developments in politics and trade. Reports suggesting the US administration is considering measures to limit flows into China, through delisting Chinese companies from US stock exchanges and restricting pension funds investments in Chinese markets, hit sentiment. While no confirmation was received on this front, the idea of the trade war moving into a war on capital flows will lead to a risk-off environment. Whether the White House would implement such restrictions or just use them as a tool to gain leverage in the upcoming trade negotiations, the message sent was not received well by financial markets.
US capital markets are considered some of the most open markets globally. Any signs of restricting access to foreigners would indicate that Chinese companies may need to consider alternative options to raise capital. This gives the US a disadvantage against its competitors and will eventually lead to less financial capital inflows.
The week ahead
Investors have a busy week to digest with Friday’s non-farm payrolls report likely to be the main risk event of the week. Having cut interest rates for a second time this year, the Federal Reserve is watching economic data very closely to decide its next move. Last month, US jobs growth slowed to its lowest level since May and came up short of expectations. However, when looking at the overall report it wasn’t terribly bad. Wage growth continued to expand at 3.2% and the unemployment rate remained steady at 3.7%. Another miss on the headline number may send a warning sign to Fed policymakers, who have so far ruled out further rate cuts in 2019 and 2020. However, markets are still convinced that another cut is on the way this year, so any positive or negative surprise readings will likely lead to big moves in the US Dollar.
Euro traders will keep a close eye on manufacturing PMIs which dropped to the lowest level in a decade in Germany last week. The ongoing US-China trade dispute has clearly hit global manufacturing and if the PMI release confirms the flash figures, we may see further pressure on the Euro.
Currency traders are also watching the Australian Dollar closely with the Reserve Bank of Australia expected to cut interest rates to a new record low of 0.75% on Tuesday. The slowdown in China appears to be a major factor impacting growth and employment in Australia; though policymakers may be worried that cheap credit will fuel a new bubble in the housing market. This is likely to complicate the RBA’s decision which means if the bank decides to stay on hold, we would expect to see a bounce in the Aussie.
The Pound was the worst-performing G10 currency last week, declining 1.3% against the Greenback. After a sharp fall on Wednesday, Sterling continued to move lower towards the end of week driven by comments from MPC member Michael Saunders who suggested the Bank of England may have to cut interest rates even if there is a Brexit deal. Sterling is likely to be the most difficult currency to trade in the weeks ahead as Brexit newsflow will be the dominant factor. However, expect to see bigger swings either way as we approach the October 31 deadline.
Disclaimer: The content in this article comprises personal opinions and should not be construed as containing personal and/or other investment advice and/or an offer of and/or solicitation for any transactions in financial instruments and/or a guarantee and/or prediction of future performance. ForexTime (FXTM), its affiliates, agents, directors, officers or employees do not guarantee the accuracy, validity, timeliness or completeness, of any information or data made available and assume no liability as to any loss arising from any investment based on the same.
On Friday the 27th of September, the euro made significant gains against the US dollar as traders partially cashed in on their positions ahead of the weekend. The British pound took a dive against the dollar and euro following hints from one of the Bank of England’s MPC members Michael Saunders that the regulator would ease its monetary policy if Brexit uncertainty continues.
11:30 UK: current account (Q2), GDP (Q2), net lending to individuals (Aug), M4 Money supply (Aug).
12:00 Eurozone: unemployment rate (Aug).
15:00 Germany: harmonised index of consumer prices (Sep).
15:30 Canada: industrial product price (Aug).
16:45 US: Chicago PMI (Sep).
Current situation:
Friday’s expectations were met. The pair bounced from 1.0907, recovering initially to the LB balance line, and then pushing further to the 45th degree (1.0957). From a high of 1.0959, the pair corrected to the balance line. The pair is currently trading at 1.0944 in today’s European session. Today, the rate should continue upwards to within a range of 1.0975 (the upper line of the channel) to 1.0983 (67th degree). First, though, we need to break through 1.0953 (upper line of the downwards channel.
We may see the rate fluctuate from around 11:30 to 15:00 (GMT+3) in the aftermath of German and British data publications. The sharper the breakout of 1.0953, the higher the probability of reaching 1.0980 and 1.1011.
Dollar weakening resumes after weak inflation data
US stocks retreat widened on Friday on reports White House is considering curbs on US portfolio investments into China. The S&P 500 lost 0.5% to 2961.79, falling 1.0% for the week. Dow Jones industrial slid 0.3% to 26820.25. The Nasdaq fell 1.1% to 7939.63. The dollar resumed weakening on weaker than expected core personal-consumption expenditure (PCE) inflation report: the live dollar index data show the ICE US Dollar index, a measure of the dollar’s strength against a basket of six rival currencies, slipped 0.1% to 98.09 and is lower currently. Stock index futures point to mixed openings today.
FTSE 100 leads European indexes movement
European stocks extended gains on Friday led by mining shares. The EUR/USD turned higher Friday while GBP/USD continued sliding with both pairs higher currently. The Stoxx Europe 600 Index gained 0.3%. The DAX 30 rose 0.8% Friday to 12380.94. France’s CAC 40 advanced 0.4% and UK’s FTSE 100 rallied 1.0% to 7426.21.
Shanghai Composite leads Asian indexes losses
Asian stock indices are mostly lower today. Nikkei lost 0.6% to 21755.84 with yen little changed against the dollar. China’s markets are mixed despite data showing China’s manufacturing improved in September: the Shanghai Composite Index is down 0.9% while Hong Kong’s Hang Seng Index is 0.4% higher. Australia’s All Ordinaries Index pulled back 0.4% despite the Australian dollar’s slide against the greenback.
Brent futures prices are extending losses today. Prices slipped on Friday: Brent for November settlement ended 1.3% lower at $61.91 a barrel Friday, posting 3.7% loss for the week.
Note: This overview has an informative and tutorial character and is published for free. All the data, included in the overview, are received from public sources, recognized as more or less reliable. Moreover, there is no guarantee that the indicated information is full and precise. Overviews are not updated. The whole information in each overview, including opinion, indicators, charts and anything else, is provided only for familiarization purposes and is not financial advice or а recommendation. The whole text and its any part, as well as the charts cannot be considered as an offer to make a deal with any asset. IFC Markets and its employees under any circumstances are not liable for any action taken by someone else during or after reading the overview.
Marinus Pharmaceuticals reported positive top-line results for ganaxolone in its Phase 2 refractory status epilepticus trial with all patients achieving the primary endpoint.
This morning Marinus Pharmaceuticals Inc. (MRNS:NASDAQ), a pharmaceutical firm dedicated to the development of innovative therapeutics to treat epilepsy, depression and other neuropsychiatric disorders, announced that it has completed the top-line analysis of the open-label, dose-finding Phase 2 study evaluating intravenous (IV) ganaxolone in patients with refractory status epilepticus (RSE).
The company reported that ganaxolone met the primary endpoint in the study with none of the 17 enrolled patients progressing to IV anesthetics within 24 hours of treatment initiation and that ganaxolone had an acceptable safety and tolerability profile for the RSE patient population in all dose groups. Marinus further advised that the data has been accepted for an oral platform presentation at the Neurocritical Care Society meeting in Vancouver, Canada, scheduled for October 16, 2019.
Lawrence Hirsch, M.D., professor of neurology, chief, Division of Epilepsy and EEG, and co-director of the Yale Comprehensive Epilepsy Center and Critical Care EEG Monitoring Program, commented, “Maintaining control of status epilepticus without progressing to additional IV anesthetics or antiepileptic drugs (AEDs) is a remarkable clinical response to IV ganaxolone treatment. This outcome is particularly impressive given all study participants, with diverse disease etiology, had failed up to four prior AEDs. The rapid onset of activity is equally important in this patient population as a number of published studies support that stopping status earlier is a key factor in improving both short and long-term patient outcomes.”
Dr. Scott Braunstein, CEO of Marinus, added, “All patients who received the target dose of ganaxolone, regardless of underlying cause of status, experienced status cessation without progression to additional second line AEDs or third line anesthesia…These data give us confidence in our IV dose selection as we make preparations for advancing into Phase 3 with our first hospital-based ganaxolone indication.”
Marinus advised that it is making preparations for an End-of-Phase 2 meeting with the FDA to discuss next steps towards a potential Phase 3 pivotal study and it is also evaluating a new ready-to-use dose formulation that does not require compounding, mixing or diluting, which would enable immediate administration at the bedside and ensure patients receive the benefits of treatment as rapidly as possible. The new formulation will be evaluated in a few additional patients and the data will be included in the End-of-Phase 2 meeting anticipated to take place in Q1/20.
The firm explains that status epilepticus (SE) is a rare epileptic seizure of prolonged duration, lasting more than five minutes for convulsive seizures or 30 minutes for non-convulsive. SE is believed to affect approximately 75,000 patients yearly in the U.S. and is a true medical emergency that can cause permanent damage to the brain and even death if not quickly brought under control. SE is first treated with IV benzodiazepines then IV anti-epileptic drugs. Patients that fail second line treatment with IV AEDs are considered to be in refractory status epilepticus (RSE). There are currently no indicated treatments for refractory RSE.
Marinus Pharmaceuticals is headquartered in Radnor, Penn., and describes itself as a pharmaceutical company dedicated to improving the lives of patients suffering from epilepsy and depression. The firm is developing ganaxolone, which it claims offers a new mechanism of action, demonstrated efficacy and safety, and convenient dosing. The firm indicates that ganaxolone is a positive allosteric modulator of GABAA that acts on a well-characterized target in the brain known to have anti-seizure, anti-depressant and anti-anxiety effects. Ganaxolone is being developed in IV and oral dose forms intended to maximize therapeutic reach to adult and pediatric patient populations in both acute and chronic care settings. Marinus is conducting the first ever pivotal studies in children with CDKL5 deficiency disorder and PCDH19-related epilepsy and has recently released top-line data from Phase 2 studies in women with postpartum depression and patients with RSE.
MRNS shares opened much higher today at $1.94 (+$0.57, +41.61%) over yesterday’s $1.37 closing price. The stock has traded today between $1.49 and $2.00/share and closed the day at $1.69 (+$0.32, +23.36%) on more than 25 times average daily volume.
Disclosure: 1) Stephen Hytha compiled this article for Streetwise Reports LLC and provides services to Streetwise Reports as an independent contractor. He or members of his household own securities of the following companies mentioned in the article: None. He or members of his household are paid by the following companies mentioned in this article: None. 2) The following companies mentioned in this article are billboard sponsors of Streetwise Reports: None. Click here for important disclosures about sponsor fees. 3) Comments and opinions expressed are those of the specific experts and not of Streetwise Reports or its officers. The information provided above is for informational purposes only and is not a recommendation to buy or sell any security. 4) The article does not constitute investment advice. Each reader is encouraged to consult with his or her individual financial professional and any action a reader takes as a result of information presented here is his or her own responsibility. By opening this page, each reader accepts and agrees to Streetwise Reports’ terms of use and full legal disclaimer. This article is not a solicitation for investment. Streetwise Reports does not render general or specific investment advice and the information on Streetwise Reports should not be considered a recommendation to buy or sell any security. Streetwise Reports does not endorse or recommend the business, products, services or securities of any company mentioned on Streetwise Reports. 5) From time to time, Streetwise Reports LLC and its directors, officers, employees or members of their families, as well as persons interviewed for articles and interviews on the site, may have a long or short position in securities mentioned. Directors, officers, employees or members of their immediate families are prohibited from making purchases and/or sales of those securities in the open market or otherwise from the time of the interview or the decision to write an article until three business days after the publication of the interview or article. The foregoing prohibition does not apply to articles that in substance only restate previously published company releases. 6) This article does not constitute medical advice. Officers, employees and contributors to Streetwise Reports are not licensed medical professionals. Readers should always contact their healthcare professionals for medical advice.
In this interview with Maurice Jackson of Proven and Probable, Aben Resources’ CEO explores the ramifications of recent analytical results from the company’s flagship project.
Maurice Jackson: Joining us for a conversation is James Pettit, the president, CEO and director of Aben Resources Ltd. (ABN:TSX.V; ABNAF:OTCQB). Before we delve into today’s interview, Mr. Pettit, please introduce us to Aben Resources and the opportunity you present to the market.
James Pettit: Aben Resources is a gold exploration company, and we’re focused in really safe jurisdictions in Canada. Our flagship Forrest Kerr Gold Project is in the Golden Triangle, which is the northwest quarter of British Columbia. That is a very notable area where people are going. It’s got a strong history, with some very high-grade discoveries in the past, and currently too.
Maurice Jackson: Mr. Pettit, take us to your flagship Forrest Kerr gold project, and let’s visit the North Boundary Zone, where Aben Resources just released an exciting press release regarding analytical results from the ongoing 2019 drill exploration program.
James Pettit: Aben Resources has released eight holes on the season. I do believe we’re on hole 23, actually still drilling. And those holes were drilled just south of the high-grade part of the North Boundary Zone, trying to connect the dots between the high-grade zone in the North Boundary and the old Noranda hole, about 30 years old, which was a very high-grade hole. . .let’s abbreviate it to 10 meters of 38 grams. Well over an ounce. That’s never been duplicated there. [Noranda] is 300 meters south of the North Boundary Zone and we want to try to connect the dots, see if there’s anything there in between them and then see what’s around the Noranda hole.
[This will] give us some extension of the high grade, and so far it’s got us a little bit baffled. You know, when we came out with our initial results, the market kind of sold off. People were expecting high grade because last year we hit a spectacular hole in our first hole of the season. And this year it’s more along the lines of what you would expect from exploration in many cases. Rarely is an explorer lucky to hit super high-grade stuff constantly, but we’re hitting a lot of mineralization. What we’re seeing so far is a little lower grade than what we’ve done the last two years, concentrating around that North Boundary Zone.
But what we do know is when you put 30 some-odd holes into one area, you pretty much got it contained. And so our best opportunity is now to move south through the Noranda zone. Aben has been able to identify that the chemical alteration is changing and it’s becoming actually better. As an explorer this is what you want to see. Important to note, you get this QSP, it’s called. That’s, from an explorer point of view, nirvana! The potassic influence there means we’re getting closer to a heat source. We’re in an environment that’s heavily mineralized with high grade and lots of low to mid grade.
It’s a big area. The boundary zone itself is about four kilometers long, two kilometers wide. Aben is going to start drilling according to the alteration, the geochem and the new geophysics that we’ve received, which is really quite something. And there’s plenty of anomalies to work with, which we feel are intrusives just down below that could be feeding the system. As we get a little further along in our drilling and get the analytics back, shareholders are going to know more and more and more. The potassic environment that we’re in, along with the alteration, leads us to believe there’s probably a feeder zone, generally within a thousand meters.
We believe this is one of the best exploration programs around. We know we’re still in a hydrothermal environment as opposed to a porphyry environment. But I’m not adverse to finding out that there’s a big porphyry down below, because we do know we’ve got hydrothermal above. Could be very exciting.
Maurice Jackson: Well, the feeling is mutual on the merits of the future of Aben Resources. The company just reported on drill results identified as FK19-47 through FK19-54. What were you able to identify for shareholders? (Click here for full details of FK19-47 through FK19-54.)
James Pettit: The drill holes FK19-47 through FK19-54 have provided Aben a pretty good read based on the alteration, and we can see a bit of a change in the mineralization. We can confirm it is a little more polymetallic. We are not just getting gold and copper, but we’re getting silver in there as well. And I know, in some of the holes that we haven’t even reported on yet, we can see zinc as well. Aben’s primary interest is the precious metals. We did hit some high-grade sections in these holes. They weren’t spectacular, as our previous success on one meter of 300 gram stuff. We did have an 18 gramthose are really goodand that’s keeping the hope alive. But I think we will hit more high grade as we go forward.
Those particular holes were drilled around the area that the old Noranda hole was drilled. And so the five of them, I think, is what we’ve done. One of them was oriented toward the south of the Noranda hole. Therefore, we have confidence that this mineralization is extended. We keep hitting. Obviously, we’d like to hit the high grade more often, of course, but we’ll take what we get as long as we learned and know more and more and more.
Maurice Jackson: Well, there’s nothing wrong with continuity either.
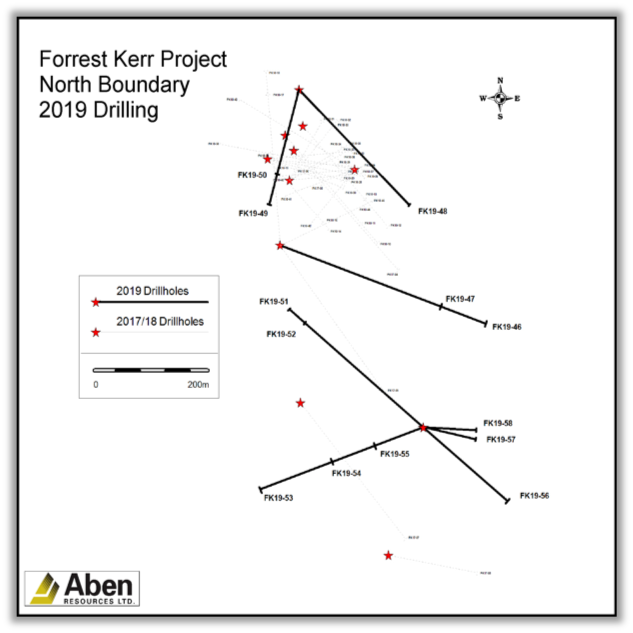
James Pettit: The second map on our news release shows the mineralized event in each holeyou can kind of see the trend. I mean it is widely mineralized. The whole area we’re in is [approximately] about 500600 meters long and every hole is full of mineralization.
Maurice Jackson: Mr. Pettit, while you’re actually referencing that, can you walk us through the map please?
James Pettit: The first one that we’re looking at is the whole area, the Golden Triangle. We are the long, narrow yellow property in the middle. Its long and narrow because it’s following a major fault. You can see the major fault from space, it’s that pronounced and it’s considered one of the engines of the whole area. Having this massive structural feature is paramount, and that generates a lot of fluids into the area, and the fluids bring the gold, the precious metals, with them. Aben has staked three large claim packages. That’s what they look like when they’re all put together.
The map above indicates drill holes. The first, you can see the upside-down V at the top. We are trying to fill a gap there in the North Boundary Zone. It didn’t come out how we thought it would. Therefore, we believe we’ve hit the outer limits of that North Boundary Zone. The red dots are where we drilled from the platforms and inside that is the guts of the really high grade that we hit the last couple of years. And then, as you move south, that long narrow line is actually two holes, one below the other, and that cuts across the Noranda zone.
The drill holes on the bottom half of what appears like a sideways-looking Vthose are following up on some alteration and touching on again into the Noranda hole down below it.
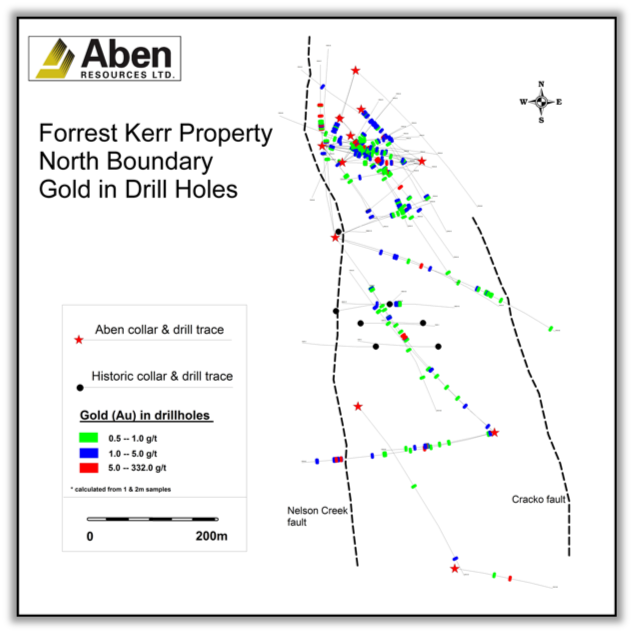
And when you review the third map on our press release, you can see that all the holes are mineralizedeverything’s mineralized, it’s really quite impressive. The green is lower grade, but extends over the length of the hole.
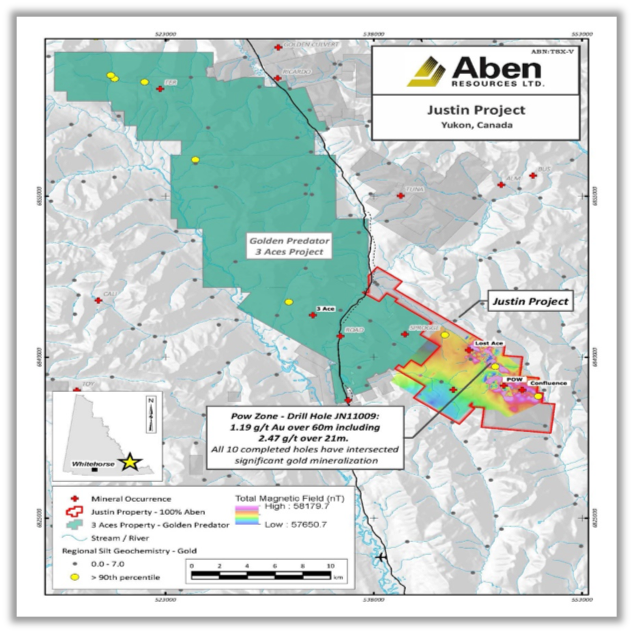
Maurice Jackson: Well, before we leave your project portfolio, are there any updates on the Justin and Chico projects that you’d like to share with us?
James Pettit: Well, other than what we put out, I’ve got to tell you, I wasn’t overjoyed by the results. The RAB drill we were using, which is a rotary air blast drill, can give you results relatively cheaply. The one thing about these percussion type of drills, it’s got to be dry, and the environment we were drilling in, it turned out [there was] a lot of alluvial water underneath and that might have made it a little more difficult for us to get proper assays. If there’s water in there, it all drifts to the bottom and it’s difficult to achieve representative values in those cores. It needs to be dry, because this isn’t solid core, it’s crushed and pulverized.
I’ve accomplished a number of RAB drills in Nevada over the years and it works great. Then every now and again, when you need geology, you’d put a diamond drill hole in and it gives you some really good geology of what you’ve been drilling. And then we also conducted diamond core drilling up there. We did four holes, which one of them was exactly what we’re looking for. The other three were not as good, but that one shows us that there is life therebecause we did drill it in 2012 and there’s a big intrusion-related gold system. That’s what we found back then with this area that we’re using the percussion drill in. That’s an area that’s much olderorogenic in nature, so it’s much older. And that intrusion-related system came up through it. We thought there’d be a connection between the two. But unfortunately the RAB drill didn’t really work for us the way we wanted it to.
We may give it another shot, or somebody else [may]. We may auction the property and somebody else can do that. Aben is pretty focused on the Forrest Kerr. And then the Chicowe haven’t done anything for going on a year and a half now because we got all set up to do some drilling there. We really would like to go back, but we ran into a little influence from the Natives. They’re having band elections and I guess they were pretty sensitive, even though all the communications we had with them didn’t seem to make any difference. So they wanted us out of there, so we left. And now they’re asking us to come back.
So that’s something I’m going to analyze going into the new year, because that’s something we can drill in the winter. We’ll see where that goes. In the meantime, I’ve got a few other very-good-potential-looking projects that could be year-round for us. So we’ll just wait and see how those play out for us.
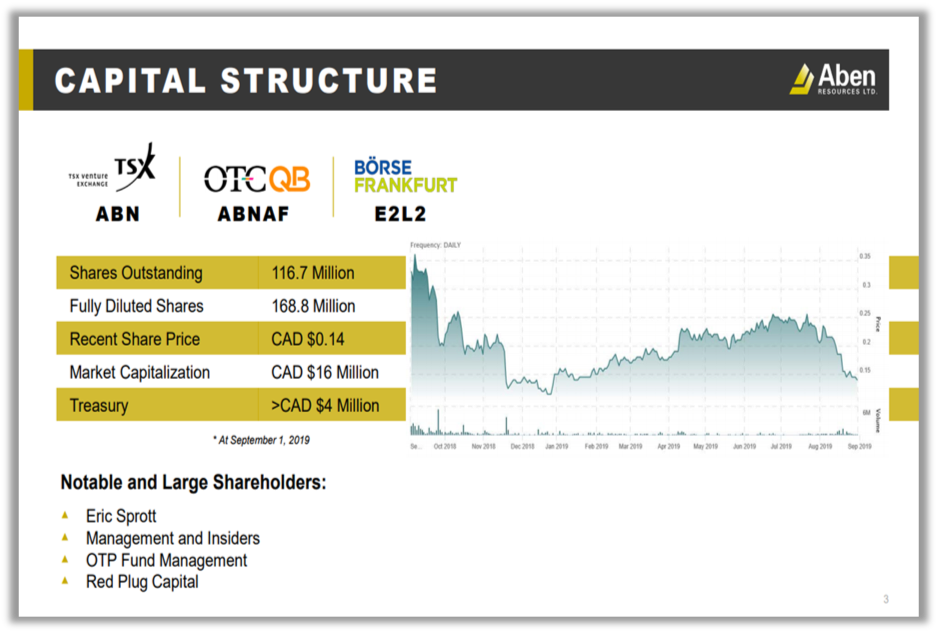
Maurice Jackson: Switching gears, Mr. Pettit, what does the current capital structure look like for Aben Resources?
James Pettit: Issued and outstanding, we’re about 117 million shares right now, and as of two days ago we got $3 million in the till. This year’s drill program is basically three quarters paid for already. Aben is going to end the season in good shape. Fully diluted we are at 137 million shares, and that could bring in a substantial amount of money. Should we hit a high-grade hole on the pending drill results, as we have about 17, 18 more holes to report on, we could easily get a lot more money taken down in warrants.
Maurice Jackson: Readers should note, a buying opportunity is when the thesis makes sense and the price is low, and that’s exactly what we have in Aben Resources. The company recently had a sell-off for no material reason, and we look to be active buyers at these prices. Did you want to make any comments regarding the current movement?
James Pettit: Well, most of the calls I’m getting, you know. . .yes, it did sell off when we put out the original, initial news this season on the first three holes, because they didn’t stand up to last year’s first couple of holes. And that’s. . .this is exploration. Most of the calls I’m getting right now are asking me not why did itthey know why it came down. They’re asking if this is when they should be in the market buying, and we’re getting in at basically December prices. And I would say yeah, because nothing’s changed. Zero.
Maurice Jackson: Sir, in closing, what is the next unanswered question for Aben Resources and when should we expect a response, and what will determine success?
James Pettit: Well, the unanswered question is vectoring into that heat source that we’re now aware of from the alteration. That’s the unanswered question. Where is it? We’ll know a lot more at the end of this season. And along the way we could well hit, when we get our assays back. There is core in the lab that Aben sent in on rush, but the lab will not take any more rush orders because they’re so backed up. Therefore, we’re waiting patiently for the next batch and the next batch and the next batch. We’ll be putting out news well into November.
Maurice Jackson: The last question I have for you, sir, and that is my favorite one, and that is, what did I forget to ask?
James Pettit: Well, you know, we could have talked a little bit about the current gold market.
Maurice Jackson: Let’s touch on that.
James Pettit: It’s exciting! The price of gold is up $300 since the middle of May. That’s increased expectations out there, in particular in the retail market, not so much institutional. The retail market expectations are way up. Could be why the market’s sold off the way it did. The retail market wants good news and then there’s way more of retail buyers in the market. And most of the people that are calling me are asking me, is this the time that I should be in the buying in the market? I’m not advising anybody, but if you are not a shareholder, consider that we are trading at CA$0.10 per share. Why wouldn’t you be?
That kind of heightened awareness is creating a bit of a frenzy, you know, but the juniors, they’re not really getting the glory yet. That’ll come. The midtiers are starting to move and the majors are getting, you know, big price swings up.
Maurice Jackson: Well, prudent capital is moving your way, sir, because I’m heading your way to buy additional shares. I said this earlier, we’re looking to be active buyers at these prices. Mr. Pettit, for someone listening who wants to get more information about Aben Resources, please share the website address.
James Pettit: It’s abenresources.com. It’s a really good website, too. There’s a lot of info on it.
Maurice Jackson: For additional inquiries about admin resources, please call Don Meyers at (604) 639-3851, or you may e-mail [email protected]. Aben Resources trades on the TSX.V: ABN | OTCQB: ABNAF. Aben Resources is a sponsor of Proven and Probable and we are proud shareholders for the virtues conveyed in today’s message.
Before you make your next bullion purchase, be sure you call me. I’m a licensed representative for Miles Franklin, precious metals investments where we provide a number of options to expand your precious metals portfolio from physical delivery, offshore depositories, precious metal IRAs and private blockchain distributed ledger technology. Call me directly at (855) 505-1900 or you may email [email protected].
Finally, please subscribe to provenandprobable.com, where we deliver mining insights and bullion sales. Mr. Pettit, thank you for joining us today on Proven and Probable.
Maurice Jackson is the founder of Proven and Probable, a site that aims to enrich its subscribers through education in precious metals and junior mining companies that will enrich the world.
Disclosure: 1) James Pettit: I, or members of my immediate household or family, own shares of the following companies mentioned in this article: Aben Resources. I personally am, or members of my immediate household or family are, paid by the following companies mentioned in this article: Aben Resources. 2) Maurice Jackson: I, or members of my immediate household or family, own shares of the following companies mentioned in this article: Aben Resources. I personally am, or members of my immediate household or family are, paid by the following companies mentioned in this article: None. My company has a financial relationship with the following companies mentioned in this article: Aben Resources is a sponsor of Proven and Probable. Proven and Probable disclosures are listed below. 3) The following companies mentioned in this article are billboard sponsors of Streetwise Reports: Aben Resources. Click here for important disclosures about sponsor fees. As of the date of this article, an affiliate of Streetwise Reports has a consulting relationship with Aben Resources. Please click here for more information. 4) Statements and opinions expressed are the opinions of the author and not of Streetwise Reports or its officers. The author is wholly responsible for the validity of the statements. The author was not paid by Streetwise Reports for this article. Streetwise Reports was not paid by the author to publish or syndicate this article. The information provided above is for informational purposes only and is not a recommendation to buy or sell any security. Streetwise Reports requires contributing authors to disclose any shareholdings in, or economic relationships with, companies that they write about. Streetwise Reports relies upon the authors to accurately provide this information and Streetwise Reports has no means of verifying its accuracy. 5) This article does not constitute investment advice. Each reader is encouraged to consult with his or her individual financial professional and any action a reader takes as a result of information presented here is his or her own responsibility. By opening this page, each reader accepts and agrees to Streetwise Reports’ terms of use and full legal disclaimer. This article is not a solicitation for investment. Streetwise Reports does not render general or specific investment advice and the information on Streetwise Reports should not be considered a recommendation to buy or sell any security. Streetwise Reports does not endorse or recommend the business, products, services or securities of any company mentioned on Streetwise Reports. 6) From time to time, Streetwise Reports LLC and its directors, officers, employees or members of their families, as well as persons interviewed for articles and interviews on the site, may have a long or short position in securities mentioned. Directors, officers, employees or members of their immediate families are prohibited from making purchases and/or sales of those securities in the open market or otherwise from the time of the interview or the decision to write an article until three business days after the publication of the interview or article. The foregoing prohibition does not apply to articles that in substance only restate previously published company releases. As of the date of this article, officers and/or employees of Streetwise Reports LLC (including members of their household) own securities of Aben Resources and Pretium Resources, companies mentioned in this article.
Proven and Probable LLC receives financial compensation from its sponsors. The compensation is used is to fund both sponsor-specific activities and general report activities, website, and general and administrative costs. Sponsor-specific activities may include aggregating content and publishing that content on the Proven and Probable website, creating and maintaining company landing pages, interviewing key management, posting a banner/billboard, and/or issuing press releases. The fees also cover the costs for Proven and Probable to publish sector-specific information on our site, and also to create content by interviewing experts in the sector. Monthly sponsorship fees range from $1,000 to $4,000 per month. Proven and Probable LLC does accept stock for payment of sponsorship fees. Sponsor pages may be considered advertising for the purposes of 18 U.S.C. 1734.
The Information presented in Proven and Probable is provided for educational and informational purposes only, without any express or implied warranty of any kind, including warranties of accuracy, completeness, or fitness for any particular purpose. The Information contained in or provided from or through this forum is not intended to be and does not constitute financial advice, investment advice, trading advice or any other advice. The Information on this forum and provided from or through this forum is general in nature and is not specific to you the User or anyone else. You should not make any decision, financial, investments, trading or otherwise, based on any of the information presented on this forum without undertaking independent due diligence and consultation with a professional broker or competent financial advisor. You understand that you are using any and all Information available on or through this forum at your own risk.
The synergies, potential and realized, that resulted from combining these two companies’ Nevada assets are discussed in a BMO Capital Markets report.
In a Sept. 23 research note, BMO Capital Markets analyst Andrew Kaip reported his impressions from 2.5 days spent with the management of both Nevada Gold Mines and Barrick Gold Corp. (ABX:TSX; GOLD:NYSE) “reviewing integration efforts at the Nevada operations.”
Nevada Gold Mines is the joint venture (JV) between Barrick, the operator and 61.5% owner, and Newmont Goldcorp Corp. (NEM:NYSE), which owns 38.5%. The JV forecasts H2/19 production of 3.53.8 million ounces (3.53.8 Moz) of gold annually over the next five years.
Kaip highlighted the various synergies Nevada Gold Mines already made or identified since the JV transaction closed earlier this year.
To date, the “easy wins,” as Kaip calls them, amounted to about $240 million. They came primarily from consolidating regional general and administrative expenses, integrating Turquoise Ridge into Twin Creeks and eliminating the toll milling agreement. Already the JV attained $70 million in savings from supply chain cost reductions, and another $28 million are expected to be achieved soon.
Also, management started seeking ways to improve efficiencies within each segment of the business, expecting to ultimately realize about $450500 million worth of synergies and do so in the specific time frame.
Nevada Gold Mines is realizing synergies, too, much faster and easier than anticipated, Kaip noted, from having optimized the routing of ore. For instance, “at Carlin, roaster feed has been realigned with ore from the north mines going to Goldstrike and ore from the southern area and from Cortez going to Mill 6,” he explained.
Finally, another effort to yield savings is relocation of the collective mining fleet. For instance, larger equipment from Goldstrike is being moved to Gold Quarry to accelerate mining at lower costs. “In our view, this will lead to reserve increases at the 4.5 Moz ounce deposit,” Kaip indicated.
In the underground, Nevada Gold Mines is considering increasing stope sizing and switching to long hole stoping where feasible. The aim in doing so is to reduce costs and more rapidly advance new production areas such as Rita K at Leeville, to ultimately boost mine flexibility.
Kaip pointed out that the JV having made or planning to make some of these changes presented new opportunities for exploration. For instance, removing the Carlin property boundaries opened the margins along the Goldstrike open pit for identifying more ore. The same is happening underground.
“One of the biggest surprises from our perspective was the Little Boulder basin target lying between Leeville to the east and Genesis and Goldstrike to the west,” wrote Kaip. Historically, the area was largely ignored because it was near the previous property boundary and the mineralization there was considered deep.
However, after the boundary was erased, the JV’s geological team reassessed the basin area, determining that mineralization is likely closer to surface in the southern part, Thus, Nevada Gold Mines launched a drill program there. “It is early days, but the Little Boulder basin could easily be hiding the next discovery,” the analyst commented.
Disclosure: 1) Doresa Banning compiled this article for Streetwise Reports LLC and provides services to Streetwise Reports as an independent contractor. She or members of her household own securities of the following companies mentioned in the article: None. She or members of her household are paid by the following companies mentioned in this article: None. 2) The following companies mentioned in this article are billboard sponsors of Streetwise Reports: None. Click here for important disclosures about sponsor fees. 3) Comments and opinions expressed are those of the specific experts and not of Streetwise Reports or its officers. The information provided above is for informational purposes only and is not a recommendation to buy or sell any security. 4) The article does not constitute investment advice. Each reader is encouraged to consult with his or her individual financial professional and any action a reader takes as a result of information presented here is his or her own responsibility. By opening this page, each reader accepts and agrees to Streetwise Reports’ terms of use and full legal disclaimer. This article is not a solicitation for investment. Streetwise Reports does not render general or specific investment advice and the information on Streetwise Reports should not be considered a recommendation to buy or sell any security. Streetwise Reports does not endorse or recommend the business, products, services or securities of any company mentioned on Streetwise Reports. 5) From time to time, Streetwise Reports LLC and its directors, officers, employees or members of their families, as well as persons interviewed for articles and interviews on the site, may have a long or short position in securities mentioned. Directors, officers, employees or members of their immediate families are prohibited from making purchases and/or sales of those securities in the open market or otherwise from the time of the interview or the decision to write an article until three business days after the publication of the interview or article. The foregoing prohibition does not apply to articles that in substance only restate previously published company releases. As of the date of this interview, officers and/or employees of Streetwise Reports LLC (including members of their household) own securities of Newmont Goldcorp, a company mentioned in this article.
Here are the latest links to our coverage of the Commitment of Traders data changes.
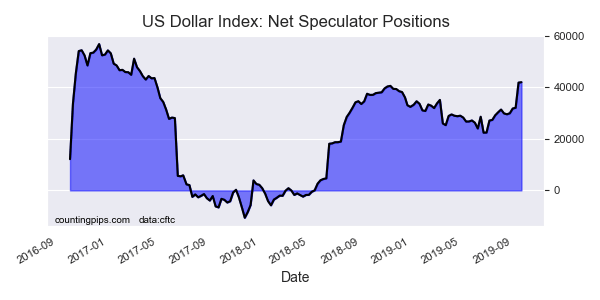
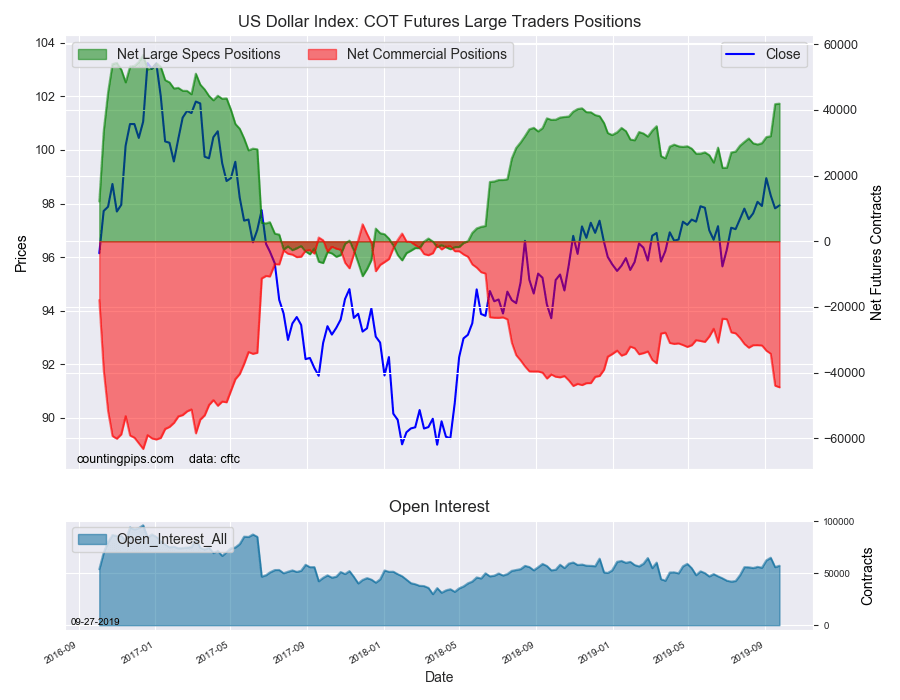
This week in the COT data, currency speculators once again increased their US Dollar Index bullish positions for a fifth straight week and pushed the current USD standing to the best level in 126 weeks.
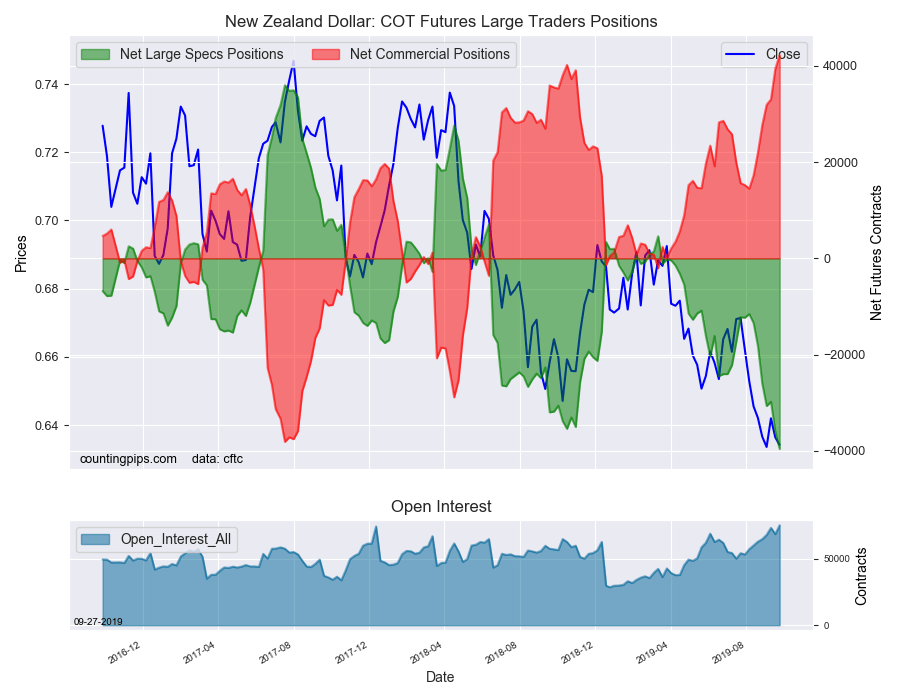
Japanese yen speculators cooled their bullish bets after a strong August that brought net positions into a bullish level. Speculators also pushed their New Zealand dollar bets to a new all-time record bearish level for a second straight week at over -39,598 contracts.
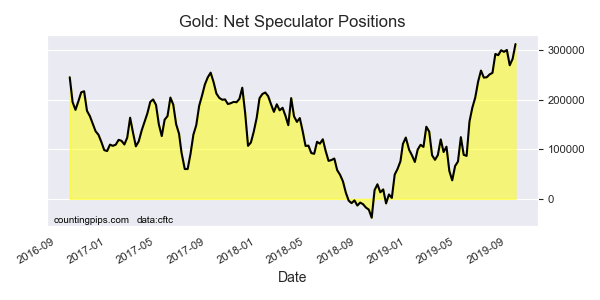
Precious metals speculators boosted their Gold bullish positions higher for a second week and to the highest level since July of 2016 (to above the +312,000 net contract level).
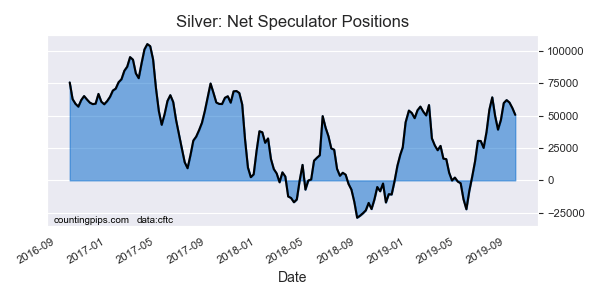
Silver speculator bets fell again this week for a third straight week. However, the recent pullbacks have been relatively modest and the silver position remains over the +50,000 net contract level for a fifth consecutive week.
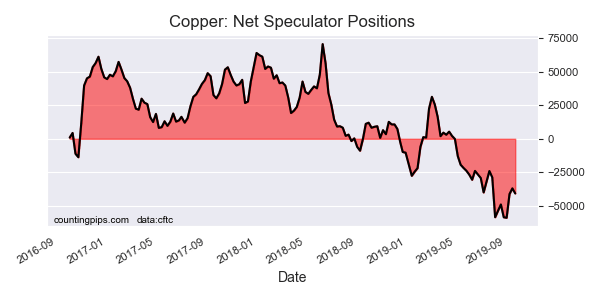
Copper speculators re-upped their bearish positions slightly this week after two weeks of declining bearish bets. Net positions are back above the -40,000 net contract level but still a ways off the record level (-58,841 contracts) of August 3rd.
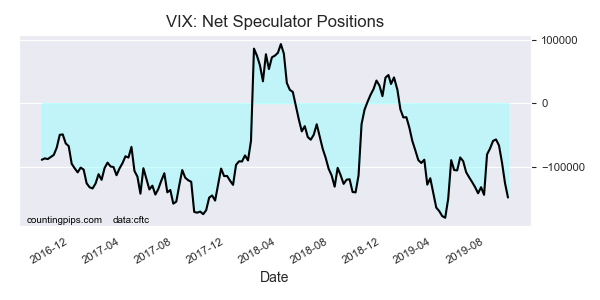
VIX speculators continued to sharply add to their bearish positions for a fourth consecutive week. This was also the third straight week with bearish positions increasing by at least -22,000 contracts. The VIX spec position is now at the most bearish level since May 7th.
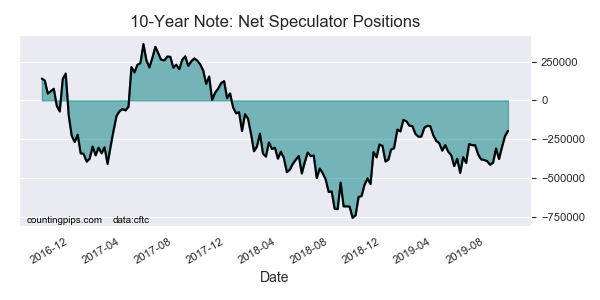
The 10-Year Bond speculators reduced their bearish bets this week for the fifth time out of the past six weeks. Specs have dropped their bearish positions by a total of 218,040 contracts in the past six weeks and the current level is now at the least bearish level since March.
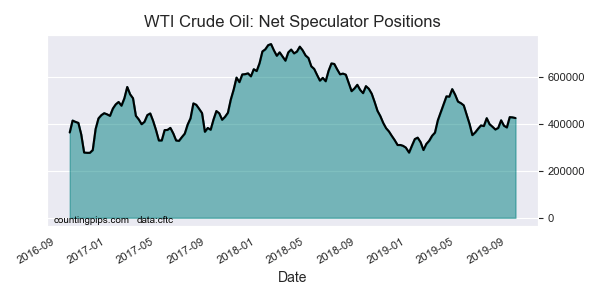
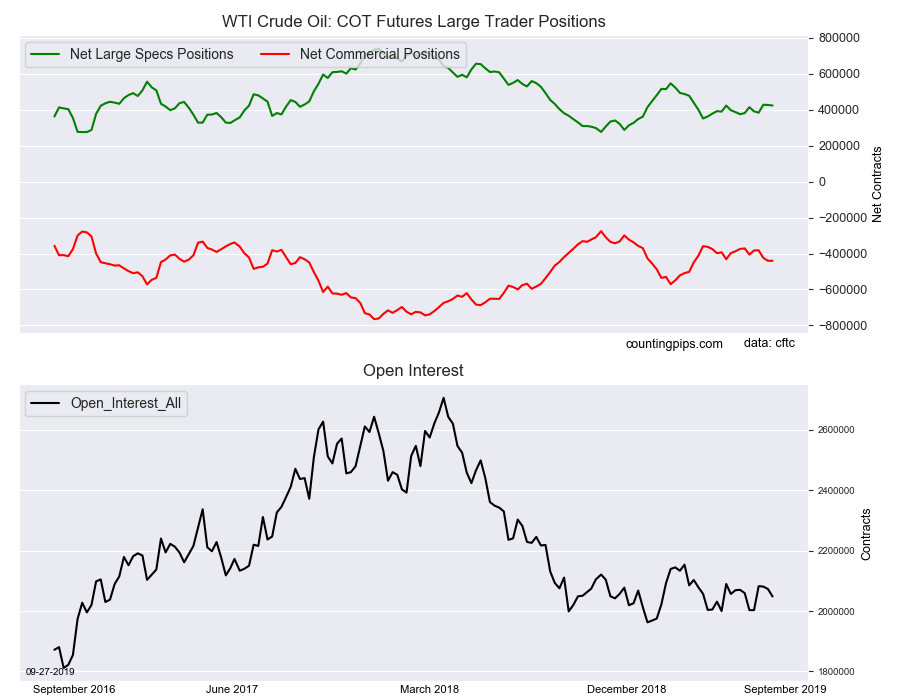
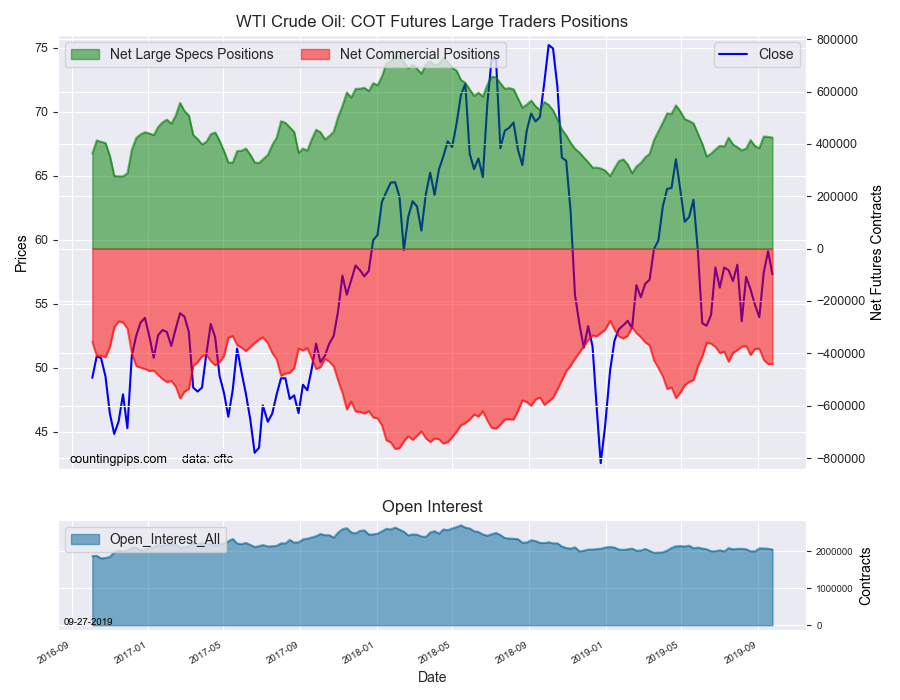
Finally, the WTI Crude Oil speculators edged their bullish bets lower again this week and for the fourth time in five weeks. Despite the recent declines, crude bets do remain above the +400,000 contracts for a third straight week.
Large currency speculators boosted their net positions in the US Dollar Index futures markets this week, according to the latest Commitment of Traders (COT) data released by the Commodity Futures Trading Commission (CFTC) on Friday. See full article.
The large speculator contracts of WTI crude futures totaled a net position of 424,162 contracts, according to the latest data this week. This was a change of -2,943 contracts from the previous weekly total. See full article.
Large speculator contracts of the 10-Year Bond futures totaled a net position of -196,306 contracts, according to the latest data this week. This was a change of 33,657 contracts from the previous weekly total. See full article.
Large precious metals speculator contracts of the Gold futures totaled a net position of 312,444 contracts, according to the latest data this week. This was a change of 29,845 contracts from the previous weekly total. See full article.
Large stock market volatility speculator contracts of the VIX futures totaled a net position of -148,519 contracts, according to the latest data this week. This was a change of -22,868 contracts from the previous weekly total. See full article.
Large precious metals speculator contracts of the silver futures totaled a net position of 50,729 contracts, according to the latest data this week. This was a change of -5,249 contracts from the previous weekly total. See full article.
Metals speculator contracts of the copper futures totaled a net position of -40,739 contracts, according to the latest data this week. This was a change of -3,789 contracts from the previous weekly total. See full article.
*COT Report: The COT data, released weekly to the public each Friday, is updated through the most recent Tuesday (data is 3 days old) and shows a quick view of how large speculators or non-commercials (for-profit traders) were positioned in the futures markets.
The CFTC categorizes trader positions according to commercial hedgers (traders who use futures contracts for hedging as part of the business), non-commercials (large traders who speculate to realize trading profits) and nonreportable traders (usually small traders/speculators).
Large currency speculators slightly increased their bullish net positions in the US Dollar Index futures markets this week, according to the latest Commitment of Traders (COT) data released by the Commodity Futures Trading Commission (CFTC) on Friday.
The non-commercial futures contracts of US Dollar Index futures, traded by large speculators and hedge funds, totaled a net position of 41,939 contracts in the data reported through Tuesday September 24th. This was a weekly uptick of 165 contracts from the previous week which had a total of 41,774 net contracts.
This week’s net position was the result of the gross bullish position (longs) gaining by 687 contracts (to a weekly total of 50,313 contracts) which just eclipsed the gross bearish position (shorts) which rose by 522 contracts on the week (to a total of 8,374 contracts).
US Dollar Index speculators advanced their bullish bets for a fifth straight week and for the eleventh time out of the past thirteen weeks. The gain this week brings the current bullish standing to the most bullish level since April 25th of 2017, a span of one hundred and twenty-six weeks.
Individual Currencies Data this week: New Zealand dollar at record bearish position
In the other major currency contracts data, we saw three substantial changes (+ or – 10,000 contracts) in the speculators category this week and one new record position.
Japanese yen bullish positions dropped sharply this week by over -11,000 contracts. This was a second straight weekly decline and the third in the past four weeks. Yen bets had recently crossed over from net bearish to bullish on August 6th and reached a 2019 high of +33,607 contracts on August 27th before trending lower.
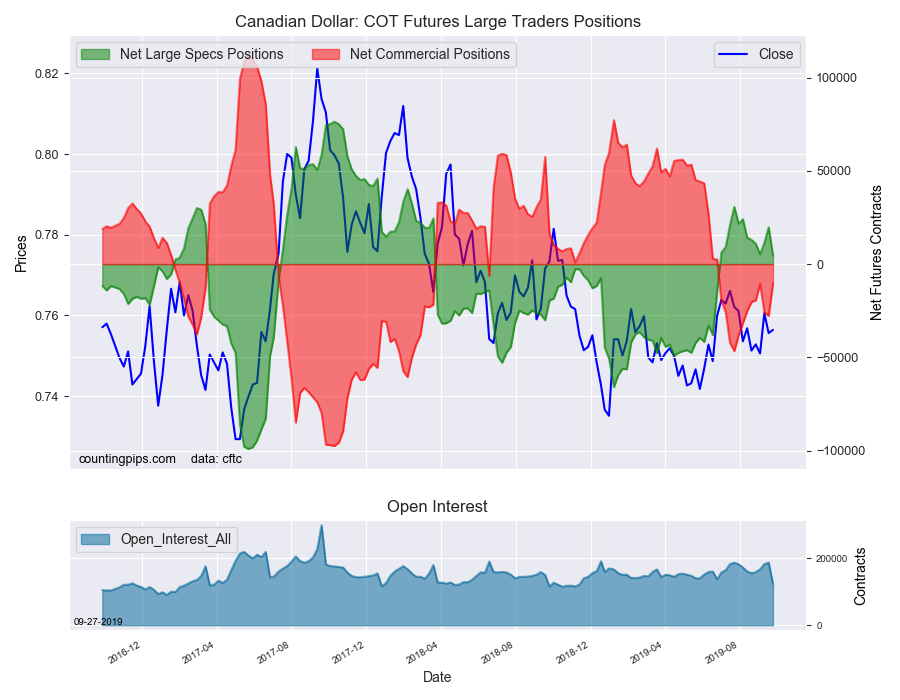
Canadian dollar bullish positions fell by over -15,000 contracts this week after a couple of gaining weeks. The CAD position remains in bullish territory overall but is now at the least bullish level since July 2nd which was the first time bets had turned bullish after sixty-six straight weeks in bearish territory.
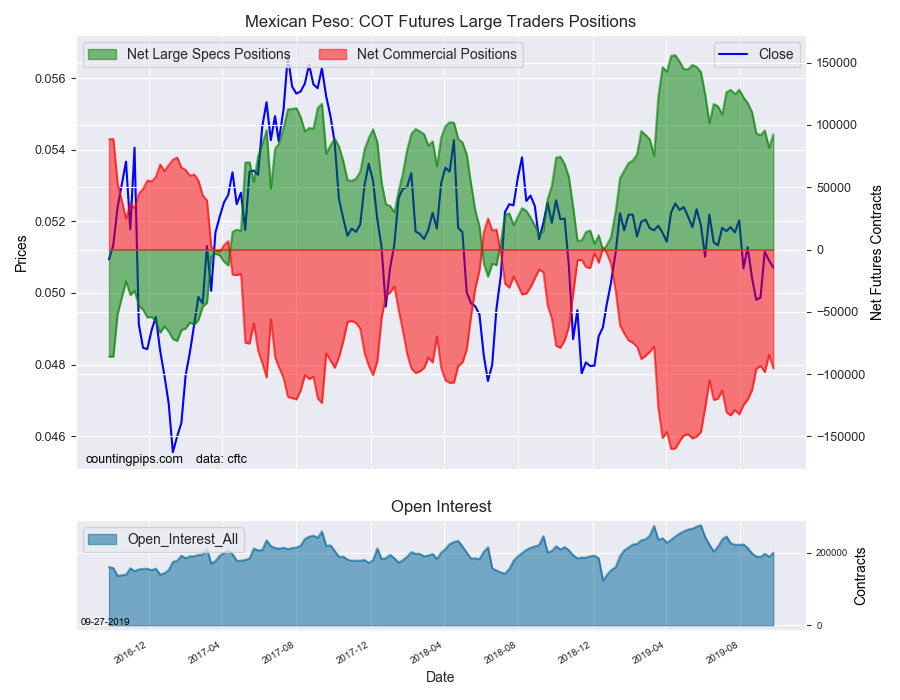
Mexican peso bets rebounded this week after a sharp decline last week by over -14,000 contracts. Peso positions have been shedding bullish bets in recent weeks and months with weekly positions falling in nine out of the past fourteen weeks. The current bullish level is now under the +100,000 contract level for the fifth straight week following a streak of twenty-three consecutive weeks above this level (peso bets hit a record high on April 16th at +156,030 contracts).
New Zealand dollar bets hit a new record high bearish level this week after setting a previous record last week as well. The rise in bearish bets has accelerated in the past few months as bearish positions have gained in seven out of the past nine weeks and by a total of -27,373 contracts over that span of time. Overall, NZD positions have now been in bearish territory for twenty-eight straight weeks dating back to March 19th.
Overall, the major currencies that saw improving speculator positions this week were the US dollar index (165 weekly change in contracts), euro (7,837 contracts), British pound sterling (5,329 contracts) and the Mexican peso (10,788 contracts).
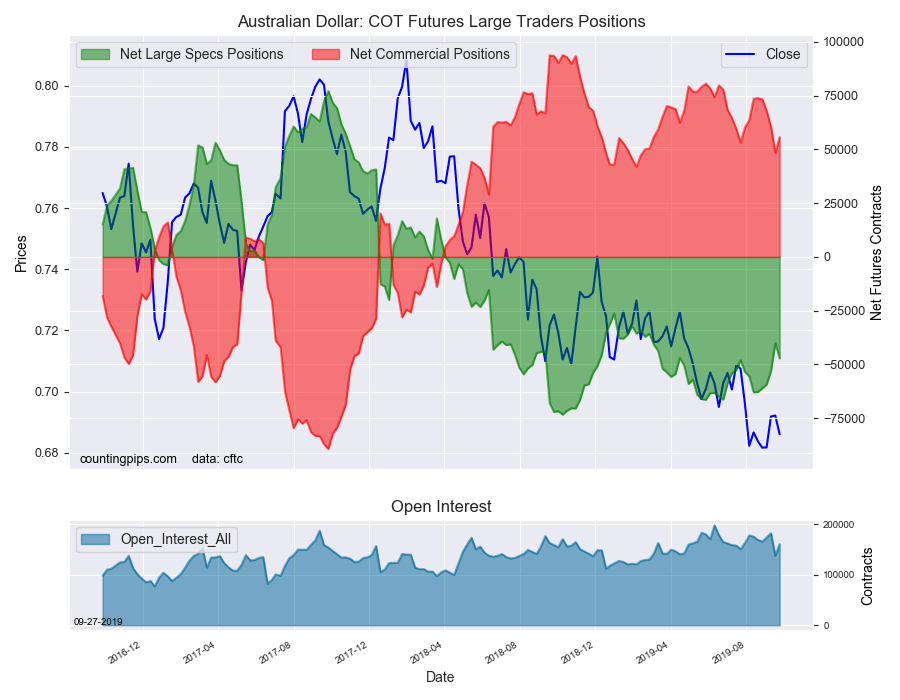
The currencies whose speculative bets declined this week were the Japanese yen (-11,079 weekly change in contracts), Swiss franc (-5,996 contracts), Canadian dollar (-15,231 contracts), Australian dollar (-7,073 contracts) and the New Zealand dollar (-3,555 contracts).
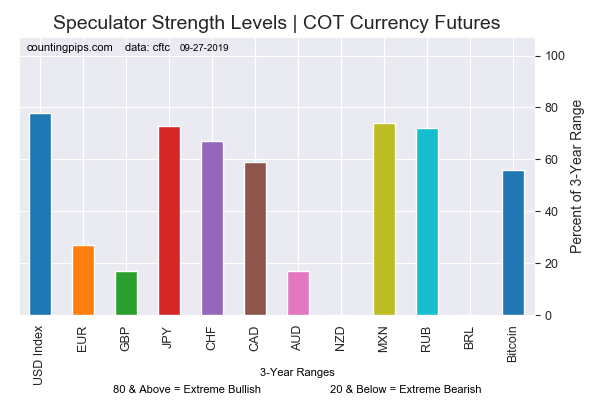
Chart: Current Strength of Each Currency compared to their 3-Year Range
See the table and individual currency charts below.
Table of Large Speculator Levels & Weekly Changes:
Currency
Net Speculator Position
Specs Weekly Change
USD Index
41,939
165
EuroFx
-60,722
7,837
GBP
-80,795
5,329
JPY
12,783
-11,079
CHF
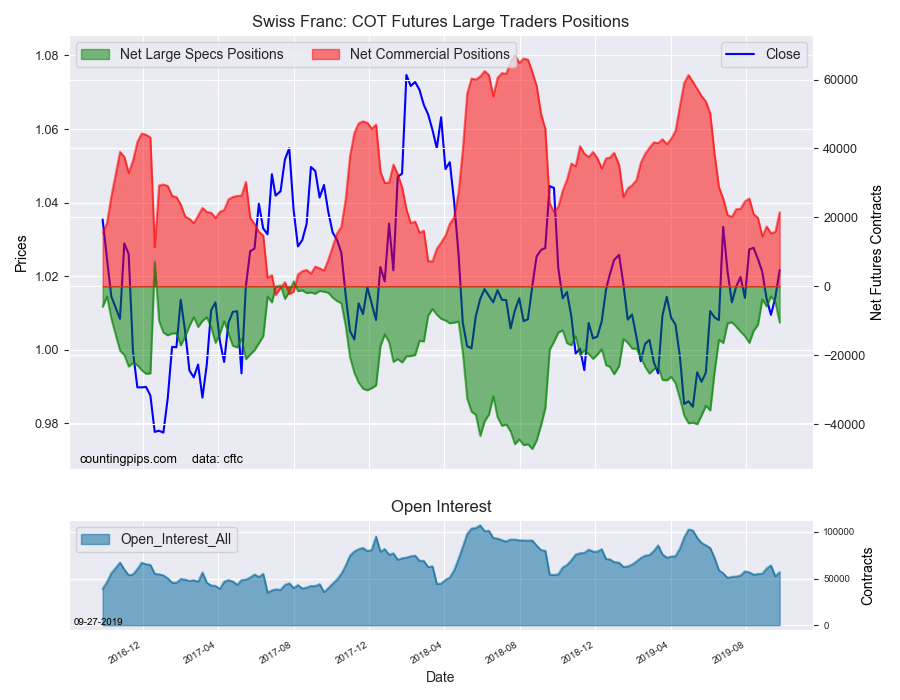
-10,552
-5,996
CAD
4,592
-15,231
AUD
-47,155
-7,073
NZD
-39,598
-3,555
MXN
92,414
10,788
This latest COT data is through Tuesday and shows a quick view of how large speculators or non-commercials (for-profit traders) were positioned in the futures markets. All currency positions are in direct relation to the US dollar where, for example, a bet for the euro is a bet that the euro will rise versus the dollar while a bet against the euro will be a bet that the dollar will gain versus the euro.
Weekly Charts: Large Trader Weekly Positions vs Price
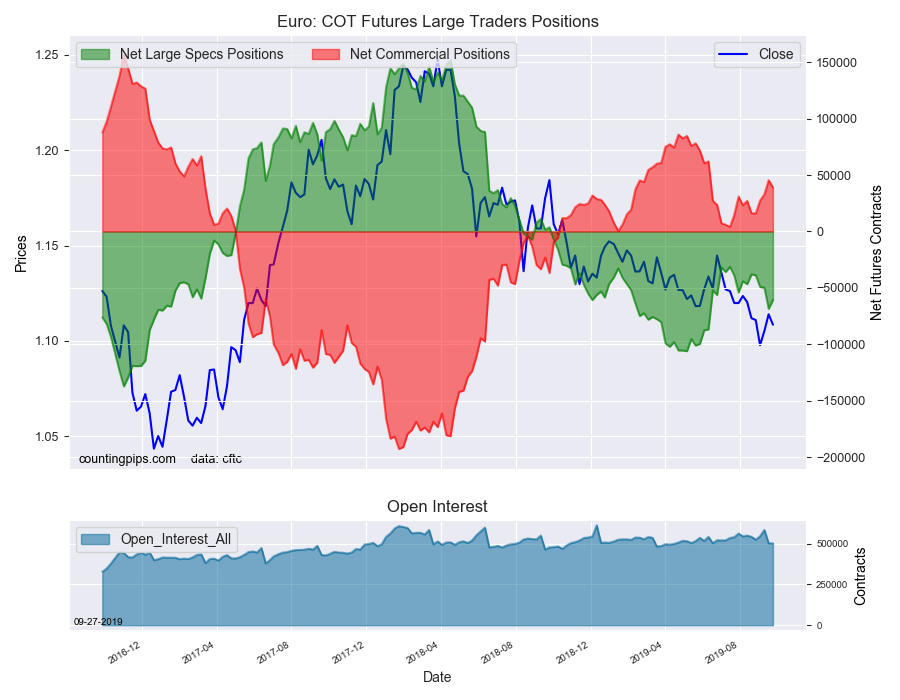
EuroFX:
The Euro large speculator standing this week equaled a net position of -60,722 contracts in the data reported through Tuesday. This was a weekly gain of 7,837 contracts from the previous week which had a total of -68,559 net contracts.
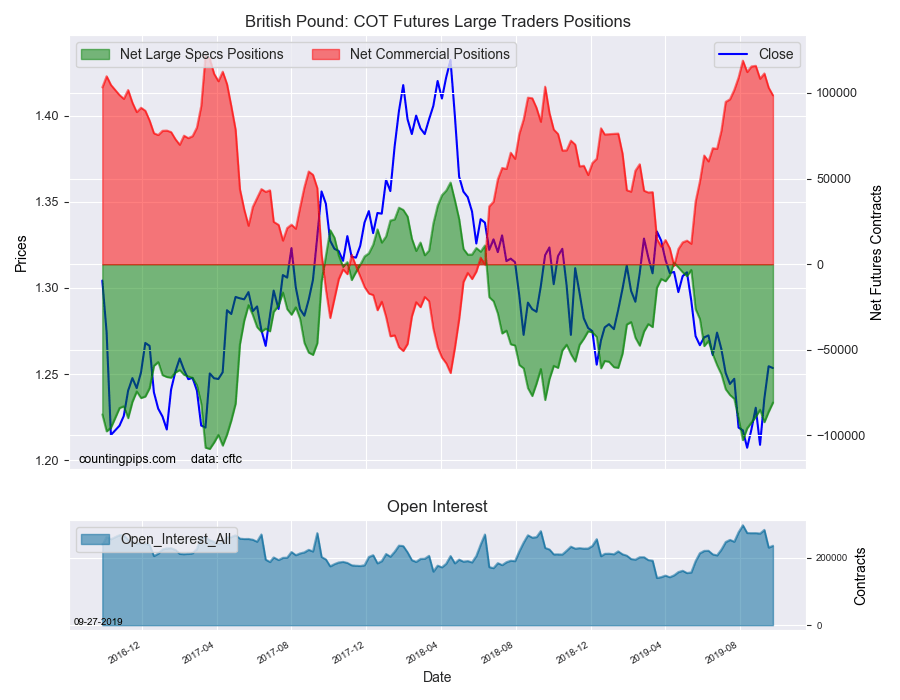
British Pound Sterling:
The large British pound sterling speculator level recorded a net position of -80,795 contracts in the data reported this week. This was a weekly lift of 5,329 contracts from the previous week which had a total of -86,124 net contracts.
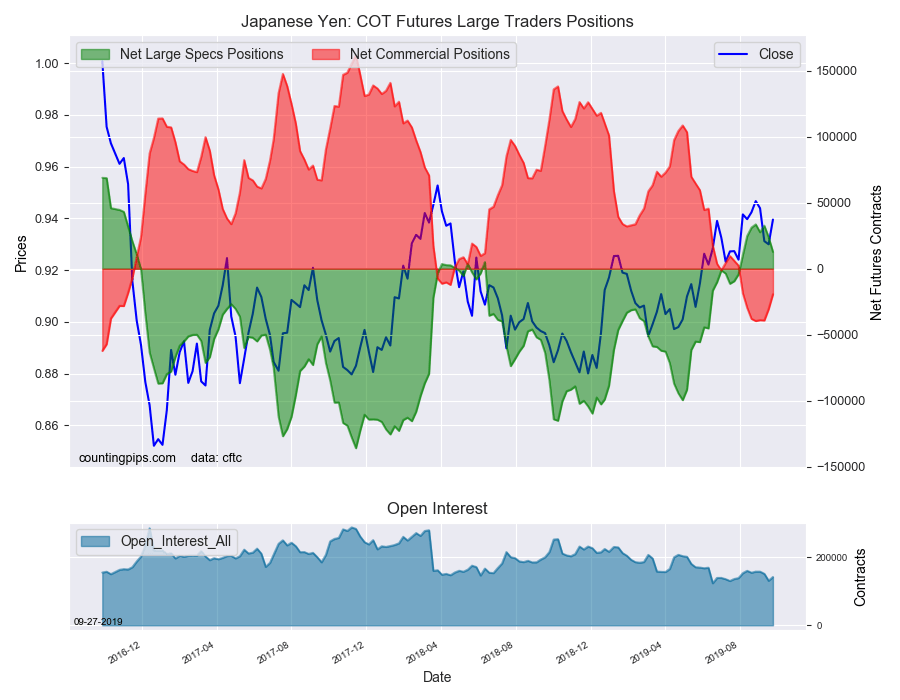
Japanese Yen:
Large Japanese yen speculators recorded a net position of 12,783 contracts in this week’s data. This was a weekly lowering of -11,079 contracts from the previous week which had a total of 23,862 net contracts.
Swiss Franc:
The Swiss franc speculator standing this week reached a net position of -10,552 contracts in the data through Tuesday. This was a weekly fall of -5,996 contracts from the previous week which had a total of -4,556 net contracts.
Canadian Dollar:
Canadian dollar speculators reached a net position of 4,592 contracts this week. This was a decrease of -15,231 contracts from the previous week which had a total of 19,823 net contracts.
Australian Dollar:
The large speculator positions in Australian dollar futures came in at a net position of -47,155 contracts this week in the data ending Tuesday. This was a weekly reduction of -7,073 contracts from the previous week which had a total of -40,082 net contracts.
New Zealand Dollar:
The New Zealand dollar speculative standing resulted in a net position of -39,598 contracts this week in the latest COT data. This was a weekly decrease of -3,555 contracts from the previous week which had a total of -36,043 net contracts.
Mexican Peso:
Mexican peso speculators equaled a net position of 92,414 contracts this week. This was a weekly boost of 10,788 contracts from the previous week which had a total of 81,626 net contracts.
Article By CountingPips.com – Receive our weekly COT Reports by Email *COT Report: The COT data, released weekly to the public each Friday, is updated through the most recent Tuesday (data is 3 days old) and shows a quick view of how large speculators or non-commercials (for-profit traders) were positioned in the futures markets.
The CFTC categorizes trader positions according to commercial hedgers (traders who use futures contracts for hedging as part of the business), non-commercials (large traders who speculate to realize trading profits) and nonreportable traders (usually small traders/speculators).
Large energy speculators decreased their bullish net positions in the WTI Crude Oil futures markets this week, according to the latest Commitment of Traders (COT) data released by the Commodity Futures Trading Commission (CFTC) on Friday.
The non-commercial futures contracts of WTI Crude Oil futures, traded by large speculators and hedge funds, totaled a net position of 424,162 contracts in the data reported through Tuesday September 24th. This was a weekly reduction of -2,943 net contracts from the previous week which had a total of 427,105 net contracts.
The week’s net position was the result of the gross bullish position (longs) lowering by -1,864 contracts (to a weekly total of 528,493 contracts) while the gross bearish position (shorts) advanced by just 1,079 contracts for the week (to a total of 104,331 contracts).
Crude oil speculators slightly trimmed their bullish bets for a second straight week and for the fourth time in the past five weeks. Overall, the current standing of bullish positions now remains over the +400,000 net contract level for a third consecutive week. Previously, the crude spec position had only been above that level in two out of the prior thirteen weeks.
WTI Crude Oil Commercial Positions:
The commercial traders position, hedgers or traders engaged in buying and selling for business purposes, totaled a net position of -440,254 contracts on the week. This was a weekly advance of 29 contracts from the total net of -440,283 contracts reported the previous week.
WTI Crude Oil Futures:
Over the same weekly reporting time-frame, from Tuesday to Tuesday, the WTI Crude Oil Futures (Front Month) closed at approximately $57.29 which was a shortfall of $-1.81 from the previous close of $59.10, according to unofficial market data.
*COT Report: The COT data, released weekly to the public each Friday, is updated through the most recent Tuesday (data is 3 days old) and shows a quick view of how large speculators or non-commercials (for-profit traders) as well as the commercial traders (hedgers & traders for business purposes) were positioned in the futures markets.
The CFTC categorizes trader positions according to commercial hedgers (traders who use futures contracts for hedging as part of the business), non-commercials (large traders who speculate to realize trading profits) and nonreportable traders (usually small traders/speculators).