News is traveling fast about the Corona Virus that originated in Wuhan, China. Two new confirmed cases in the US, one in Europe and hundreds in China. As we learn more about this potential pandemic outbreak, we are learning that China did very little to contain this problem from the start. Now, quarantining two cities and trying to control the potential outbreak, may become a futile effort.
In most of Asia, the Chinese New Year is already in full swing. Hong Kong, China, Singapore, Malaysia, India and a host of other countries are already starting to celebrate the 7 to 10 day long New Year. Millions of people have already traveled hundreds of thousands of miles to visit family throughout this massive celebration. We are certain that hundreds or thousands have traveled to all parts of the world by now. The potential for exponential growth in the threat from this virus could be just days or weeks away.
Far too many people are too young to have any knowledge of the 1855 Third Plague Pandemic that originated in China. This outbreak quickly spread to India and Hong Kong and claimed 15 million victims. It lasted until the 1960s when active cases of the Plague dropped below a couple hundred.
If we consider the broader scope of this issue, we have to take into consideration the results it may have on the broader global economy, commodities and consumer activity as skilled traders.
The world is much bigger than it was in 1855. We have more technology, more capability and faster response capabilities related to this potential pandemic. Yet, we also have a much greater heightened inter-connected global economy, currency, and commodity markets. What happened in China can, and may, result in some crisis events throughout the planet. It is not the same world as it was in 1855. (Source: history.com)
It is far too early to speculate on any future economic outcomes related to this potential outbreak, but it is fairly certain that China, most of Asia, India and potentially Africa could see extensive economic damage related to a contraction in consumer and industrial economic demand as a consequence of this outbreak. Once the Chinese New Year ends, in about 10 to 15+ days, people will return back to their home cities and we’ll begin to understand the total scope of this problem. If the problem continues to be isolated in China, Asia and within that general region, then we may see economic consequences isolated to these regions. If not, then we could see a much bigger and broader global economic consequence setting up.
The 1855 Plague Pandemic lasted for nearly 100 years and wiped out 1.25% of the total global population. This was at a time when air travel was very limited and global economics was a much smaller component of the total global economy. Everything is somewhat isolated at that time. In today’s world, a similar type of event could wipe our 1% to 5% of the total global population before we have any means to attempt to control it.
Bill Gates believes this outbreak could kill more than 30 million people within 6 months (Source: businessinsider.com)
It is time to get real about this and prepare for how the global markets will interpret this potential outbreak.
We’ve been warning that the market was “Rallying To A Peak” recently and believe this outbreak has changed the minds of traders. This could the catalyst that breaks the bullish trend for quite a while. Skilled traders will be trying to get ahead of this rotation in the markets and attempt to deleverage risk. As retail traders, we should be doing the same thing – deleveraging risk, buying metals, trimming open long positions and hedging into inverted ETFs.
Daily ES Chart
This Daily ES chart highlights a very real support level near 3050 that also aligns with the longer-term Moving Average. A downside move like this would represent a -10 to -11% downside price reversion and take us back to December 2019 price levels. It could happen very quickly.
Transportation Index Chart
This Transportation Index chart highlights a potential downside price reversion of -11% to -12% – targeting the 9,750 level. We’ve recently authored an article about the weakness in the Transportation Index and how we believe it could be setting up for a downward price move. If a breakdown move like this happens in TRAN, it would suggest a massive contraction in the global economy is taking place.
DOW JONES (YM) Daily Chart
This last YM chart highlights support near 28,000 which would be an immediate downside target if the Dow Jones Industrials revert lower. And, again, this would put us back to December 2019 price levels. If this 28,000 level is broken, then we start looking at levels closer to 26,000 (roughly -20%).
Concluding Thoughts:
Right now, consider this situation as you are a captain of a ship sailing into a storm. You can either prepare for it and navigate through it to the best of your ability or ignore the warnings and hope for the best. It is far too early to panic at this point, but a certain degree of “preparation” is certainly in order.
We’ll know more in about 7+ days as we learn how far and how wide this problem has actually extended. In the meantime, watch your investments. Protect your assets. Prepare for the storm. Best case, you can always reposition your capital for clearer skies in a few weeks.
As a technical analysis and trader since 1997 I have been through a few bull/bear market cycles, I have a good pulse on the market and timing key turning points for both short-term swing trading and long-term investment capital. The opportunities are massive/life-changing if handled properly.
Join my Wealth Building Newsletter if you want winning ETF swing trade alerts every month? Then ride my coattails as I make money while others will struggle and lose money as the markets correct and become more volatile.
NOTICE: Our free research does not constitute a trade recommendation or solicitation for our readers to take any action regarding this research. It is provided for educational purposes only. Our research team produces these research articles to share information with our followers/readers in an effort to try to keep you well informed. Visit our web site (www.thetechnicaltraders.com) to learn how to take advantage of our members-only research and trading signals.
Welcome to this week’s Market Wrap Podcast, I’m Mike Gleason.
Coming up Michael Pento joins me for a tremendous interview on a range of topics. Michael goes through his checklist of data points and the events that, once taken place, will fuel the next big rally in precious metals. He also talks about the key warning sign that we can be looking for that will indicate when the economic bubble to end all bubbles is about to burst. So don’t miss another fantastic interview with Michael Pento of Pento Portfolio Strategies, coming up after this week’s market update.
Gold and silver markets are once again getting overshadowed by wild price moves in lesser known metals – in particular, palladium and rhodium. Both are used mainly in emissions control devices for automobiles. And both are in extremely short supply.
A liquidity crunch over the past few days has driven an explosive spike in rhodium to nearly $10,000 per ounce. That’s nearly $4,000 higher than where it started the year and ten times higher than where it traded just a few years ago.
The rhodium, palladium, and platinum markets are heavily dependent on South African mines for supply. But recurring power outages and other dysfunctions in the country are crimping mining output.
Palladium prices shot up to $2,500 an ounce mid week in volatile trading and currently come in at $2,425 – up 5.2% since last Friday’s close and up nearly 25% so far in the early going of 2020.
As palladium continues to set records, so does its rising premium over its sister metal platinum. Palladium now sells for nearly 2.4 times the price of platinum. The opportunity for it to narrow in favor of platinum appears good given that one can often be substituted for the other in catalytic converters. When that starts to happen in a big way is another question.
But the trade has become so lopsided that a powerful squeeze on the platinum market could be triggered at any time. As of this Friday, platinum trades at $1,011 per ounce and shows a weekly decline of 1.5%.
Gold is up now by 1.0% for week to trade at $1,574. And finally, silver is unchanged for the week at $18.11 as of this Friday morning recording.
So can gold and silver investors look forward to a massive price spike in the near future like the one playing out in palladium and rhodium? Very likely, their day will come.
As central bankers continue to monetize ever-growing sums of debt and pursue negative real interest rates, the value of paper currency will go down versus hard money.
It’s a point reiterated this week by billionaire asset manager Ray Dalio. In an interview with CNBC from Davos, Dalio declared that cash is not where he wants to be.
Ray Dalio: What do you jump into when you jump off the train? And the issue is you can’t jump into cash. Cash is trash, because they’re going to print money. What do you do? You get out.
CNBC Interviewer #1: So what do you do?
Ray Dalio: So what you have to do is you have to have a well diversified portfolio. I think that you have to have a certain amount of gold in your portfolio, or you have to have something that’s hard. I know I’m going to come out of here (and everyone will be) like “Ray Dalio’s wild on gold.”
CNBC Interviewer #2: I’m going to say “cash is trash” is your headline.
Ray Dalio: But cash is trash.
There is no doubt that cash will depreciate over time. What is less certain is which assets Federal Reserve notes will depreciate against the most.
In recent years, the stock market has fared well while most commodities have not. However, even as food and energy costs have been held down, healthcare, education, insurance, housing, and other costs of living continue to move relentlessly higher.
We can only imagine what things would be like for consumers if crude oil and grain prices were going parabolic like palladium is. Since palladium only represents a small portion of the total cost of an automobile, most consumers feel no direct impact.
But they would be wise to pay attention to what’s happening in the palladium market – because it may be a precursor to what will happen in other markets in the years ahead. Declining oil rig counts and chronic under-investment in copper mines, for example, could lead to supply crunches that put enormous upward price pressure on all manufactured goods.
A reemergence of inflation fears would, in turn, drive safe-haven investment for gold and silver. As we’ve said before, it will take more than a geopolitical scare to drive a major trend.
The big scare this week: the deadly Coronavirus in China. It has the potential to spread rapidly and perhaps even drag down the global economy if it is not contained. There is currently no vaccine for the virus. As investors weighed the risks of a possible global pandemic, the stock market experienced some gyrations.
Whether the Coronavirus remains a front page story in the weeks ahead remains to be seen. But long-term precious metals investors can benefit from focusing on the underlying drivers for gold and silver that the mainstream media isn’t yet covering.
Well now, for more on what the mainstream financial media isn’t covering because they’ve blackballed guests like the man I talked to this week, let’s get right to the week’s exclusive interview.
Mike Gleason: It is my privilege now to welcome back Michael Pento, President and founder of Pento Portfolio Strategies. Michael’s a well-known money manager, market commentator and author of the book, The Coming Bond Market Collapse: How to Survive the Demise of the U.S. Debt Market. He’s been a regular guest with us over the years and we always love getting his fantastic insights.
Michael, thanks for the time again today, and welcome back.
Michael Pento: It’s always a pleasure to be on with you. Thank you for inviting me back on the program.
Mike Gleason: Well, we’re having a hard time seeing a big move higher in metals prices until one of two things happen. We’ll start here. The first would be a pickup and safe haven demand. In our view there is too much investor complacency given the circumstances as has been the case for a while now, equity market valuations are sky high. Now we’ve got an election coming up, and there is at least some chance our next president will be an avowed socialist. This does not seem like the time for investors to be all in on risk trades, but we suppose the only thing that really matters is the Fed. They are going to do whatever it takes to keep the party in the stock markets going.
But what are your thoughts? Are we likely to see the markets get a wakeup call anytime soon or is the Fed likely to maintain complete control for the foreseeable future? Let’s start there.
Michael Pento: What a great question. Geez, you hit me over the head with a, a big anvil. That’s the $20 trillion question. I mean, can the market continue to defy gravity – and it is defying gravity, make no mistake about it. If you look at the total market cap to GDP, I look at the Wilshire 5000, that doesn’t have 5,000 stocks anymore. I think it’s like 3,500 but it’s the widest measurement of stocks, their market cap, to the underlying economy. That ratio is now 155%. Outside of March of 2000 when it was 145 or 148 around there, it’s never been near this. The average ratio is 0.8%… 80% or 0.8 in the ratio. So 155%, 1.55% above where the underlying supporting economy is. I mean it’s never been anywhere near this outside of that epic bubble in the NASDAQ debacle where the NASDAQ lost 80% of its value.
So that is where we are. We have S&P 500, year-over-year earnings are going to be negative. Margins are shrinking. Four quarters in a row of negative earnings per share growth, and profit margins are shrinking. You have the most overvalued market on the planet, that the planet has ever seen, and yet you wonder how much longer can it go? Well, think about it. The Fed said they were going to raise rates in December of 2018. Do you remember Jerome Powell said, “Hey, we raise rates and we’re going to 3.5% on the Fed funds rate, and we’re going to continue to drain our balance sheet. We’re going to continue quantitative tightening.” How long did that last, Mike?
They did a panic about face, took rates down to 1.5% on the overnight borrowing costs for banks, and they went back into QE. They’re doing $60 billion worth of money printing every month, and they have a repo facility on top of that. Hundreds of billions of dollars trying to keep the money markets liquid. So the Fed’s balance sheet was going to be drained back to normal, it went from 400 trillion from 800 billion. It was supposed to go back down to 800 billion or around there, but guess what? It’s now increased by a half a trillion dollars since mid-September.
So why is the market in a bubble? Why is the bubble getting bigger? Is because the Federal Reserve, and the ECB, and the Bank of Japan, and the Bank of India, and the People’s Bank of China, they’re all in a frantic to keep this artificial bubble alive. The only question I have is, you asked me, when is it going to end?
I’ll tell you when it’s going to end. I can’t tell you the date but I have a model that lets me know when to short the market, and believe me when I tell you, this crash is going to be something like we’ve never seen before. It could even dwarf the NASDAQ debacle of 2000, from 2000 to 2002.
I’m looking for a bust in junk bond yields. When junk bond yields implode, because that’s the nucleus of the crisis, that is when you’ll see me go net short the market in my portfolio, in the inflation/deflation and economic cycle model. And when will the junk bond market implode? Whenever the U.S. enters a recession and/or, because it could be both, and/or inflation begins to run intractable. That is when the market will implode. That is when we’ll have our reality check. That is when hopefully we make a lot of money for our investors while the chaos runs rampant around the world.
Mike Gleason: Sticking with the stock market theme here, you just published a note talking about Zombie Companies. What we’re seeing in the stock markets is truly amazing. You talk about defying gravity. That’s a great way of explaining it. You observed, in this piece, that stocks are at an all-time record highs, but at the same time we have 40%, nearly half of listed companies losing money. And 97% of CFOs in a survey published by Deloitte say a slowdown is either already started or will start this year. Talk a bit about the total and complete disconnect between stock prices and reality.
Michael Pento: Well, as you mentioned, there’s a record number of IPOs that don’t make any money. So, if you look at the trailing 12-month earnings, 40% of listed U.S. shares don’t make any money. And if you go back, it’s not just 12 months, if you go back three years, 30% of all listed companies haven’t made a nickel in the last three years and nobody seems to care.
This is the truth… Central Banks on a global basis have the global economy and global markets in the ICU unit, and they are on the life support system of money printing. I’ll give you an example. So, let’s look at the global debt scenario. Global debt is now $255 trillion, Mike, that’s up 50% since 2008. Government debt is up 80%, nearly 80% since 2008, the great credit crisis. But you ask yourself, what is the Portuguese, for example? The Portuguese 10-year note yields in this tsunami of new debt that’s been issued?
You know, back in 2000 as well, the PIGS, remember the PIG countries, their debt, Greek debt, the yield was 40%, Portugal and they were up at double digits. Italy, Greece, Ireland, Spain. The Portuguese 10-year note yield is 0.4%. Now on what planet does that make any sense at all? I mean, let’s just do a thought experiment for a second, Mike. Let’s just say that you knew that tomorrow the ECB, the Bank of Japan, and the Fed were going to make announcement. The announcement is that we will be ending QE and we will not buy when the assets mature… we will not roll over any more of that debt, corporate debt, sovereign debt, all that will be rolled off. What do you think would happen to the stock market? I think that it would be lock limit down.
Circuit breakers would be hit for many consecutive days, shutting down the exchange eventually. That’s what will happen. That’s the truth. So central banks have no choice, they’re trapped. They have no choice because, the world was ending in 2008, instead of taking our medicine then and allowing for a deflationary depression to wipe out all the imbalances, we levered up on everything. We increased debt on the government side by 80%, as I mentioned, $255 trillion, 330% of global GDP, total debt. We’ve created a massive corporate bond bubble, which I’d love to touch on in a second, unprecedented in the history of the planet. And interest rates, instead of being at five and a quarter percent like they were in the start of the crisis in 2008, they’ve gone to zero around the world, and in some cases negative, and have stayed there for a decade or more. And, of course, the consequences of that are massive intractable asset bubbles.
So, they’re trapped, there’s nothing they can do. They’re going to keep on printing money because they have no choice until the market decides that fiat currencies no longer deserve our trust, that inflation will run intractable, and then the junk bond market will implode.
And when that happens, what are you going to say to the central bank? You’ve reached your asinine 2% inflation target, even though we’re already there, that’s not good enough for them. The way they measure it, they want it at three or four, then they’ll be happy. Of course, by that time inflation will be running their double digits, and then they’re going to say, okay, we have intractable inflation and bond yields they’re starting to go crazy. They’re spiking uncontrollably. And the central banks are going to do what about that, exactly?
Are they going to print more money to combat an inflation problem? Are they going to then purchase every single fixed income asset in the globe? Corporate debt, municipal bonds, all sovereign debt. It doesn’t make any sense. That’s where we’re headed.
So, the problem here is you have to be on the vanguard, very vigilant for a recession in the United States, or for inflation to run intractable, that is when this thing will end. And it will end, it will go supernova. It’s not going to end in a quiet whimper.
Mike Gleason: Obviously the bigger the bubbles get the worse the bursting of that bubble if and when that does come, and it’s probably more a matter of when, not if at this point.
How about metals? Michael gold had nearly a 20% gain last year. Silver lagged a bit but still was up about 15%. Do you envision 2020 being better or worse or what compared to 2019 in the metals?
Michael Pento: Well, you had a big rise in the dollar, about two years ago starting. And then we see it had a nice run in 2019, but it is starting to top out and rollover. When I look at gold, I look at three factors. I want to see rising debt as a percentage of GDP. Check. I want to see a dollar that is rolling over, or at least topping out. Check, you’re getting that. And then, of course the most important thing is falling real interest rates. And usually these things are all part and parcel with a U.S. economy that is faltering. Right now I have 10% of the portfolio in physical gold doing very well, I’m happy with that. But you want to add miners to that when you see all those three things I just mentioned taking place.
So, the missing piece for me to get really heavy into miners, and even increase my position into physical gold, is I want to see the U.S. economy really take a dive to the South. So I’m going to need to see not only the manufacturing ISM, which is already plunging, I want to see the service sector ISM catch up with that.
I’d like to see that the initial unemployment claims spike above the 200,000 level where they’ve been for a long time. And that is when I’ll know… and I have eight more components to my economic cycle model… but those type of things will let me know when it’s time to not only get net short the stock market in the portfolio, but also to increase my exposure to gold and the miners.
Mike Gleason: Well, as we begin to wrap up here, Michael, any final comments? Some other things that you’re looking for that you think investors ought to be thinking about and watching for? Let’s hear some of that before we close.
Michael Pento: Well, I mean I just want to mention, the middle-class continues to be eviscerated. I don’t think the central banks of the world quite are on their side. They’re on the side of (JPMorgan chairman and CEO) Jamie Dimon, et al. So if you look at the combined assets and liabilities of the bottom, 50% of Americans, for example, it’s now become negative. 80% of Americans now live paycheck to paycheck because they spend so much of their income on food, clothing, shelter, energy. But the richest among us get to enjoy multiple homes and big stock portfolios. So that’s a trench in gap is getting wider and wider.
And I just want to say a couple of things about corporate debt. I mean, business debt surged by 60% since 2008. Triple B, the tranche of investment grade debt that’s on the lowest rung, comprises 50% of all investment grade. That yield is just above 3%. It’s never been this low in history. The construction of corporate debt, the record net debt as a percentage of EBITDA, so it’s the worst composition of corporate debt. The amount has surged, the levels of debt has surged, and the yields have never been lower. So, that’s the nucleus of next crisis.
Please keep in mind, if you’re not with me as an investor… also, you know, you can become a podcast subscriber, so I’ll let you know about a lot of this stuff on a higher level…. but please keep a close eye on the investment grade and junk bond corporate debt market, not only here in the United States but around the world. That is what you should be myopically focused upon, that’ll be your warning sign. That’ll be the canary in the coal mine to let you know when it’s time to sprint for the very narrow emergency exit.
Mike Gleason: Well, we’ll leave it there for today. Thanks so much again, Michael. We certainly appreciate the time and look forward to following these markets with you as we go through the year here in 2020. Now before we let you go, please tell people a little bit more about Pento Portfolio Strategies, where they can get the podcast, for instance, and follow you more closely.
Michael Pento: Sure. The podcast and my website is Michael Pento:. On that website you’ll be able to avail yourself of a free trial, five-week trial of my podcast called the Mid-Week Reality Check. I give you a whole bunch of data that Wall Street isn’t very proud of so they don’t tell you about it. But it’s all real, it’s all there.
I give you some high-level functionality on that analysis so you can understand when you should be long stocks, and when you should be out of the market. And of course, if you have a $100,000 or around that, you can join me in my firm and I’ll take care of your money personally. And my goal here is to participate in the bubble while it lasts, but most importantly to protect and profit.
I will personally make sure, and do the best I can, to make sure you’re not only protected when this crisis comes, but you actually make money when the reality check comes. And believe me, for this great nation, the sooner this occurs, the better off it will be for all involved.
Mike Gleason: Yeah, very well put. Michael’s obviously got a fantastic handle on these markets and he’s not one of these cheerleaders for the mainstream financial media. That’s, I guess, the reason why they’ve blackballed him on places like CNBC, but we’re very happy to have him on our podcast here on a regular basis.
Michael Pento: Mike, you probably have more viewers and listeners so, I’m happy to be with you.
Mike Gleason: Well we appreciate it. All the best to you in the new year, Michael, and thanks again. Have a great weekend, my friend.
Michael Pento: Thank you.
Mike Gleason: Well, that will wrap it up for this week. Thanks again to Michael Pento of Pento Portfolio Strategies. For more info please visit Michael Pento:. You can sign up for his free email list, get a free trial of his weekly podcast, and get his fantastic market commentaries on a regular basis. Again just go to Michael Pento:.
Well, I hope you enjoyed the replay of that interview with Guy Christopher as much as I did. It was always a real joy to speak with Guy and he will be truly missed, but his wisdom lives on.
And don’t forget to tune in here next Friday for next Weekly Market Wrap Podcast, until then this has been Mike Gleason with Money Metals Exchange, thanks for listening and have a great weekend everybody.
The Money Metals News Service provides market news and crisp commentary for investors following the precious metals markets.
Fasten your seatbelts and brace for potential Pound volatility in the week ahead as the Bank of England (BoE) meet and UK officially leaves the European Union on January 31.
A pressing question on the mind of many investors is whether the BoE will cut interest rates for the first time since 2016. The endless Brexit drama has certainly not been kind to the UK economy over the past few years with Sterling still nursing deep wounds inflicted by the endless uncertainty. UK data continues to paint a mixed and confusing picture over the economic landscape, with this theme clearly illustrated over the past few weeks.
Economic reports from UK cooled rate cut bets this week as flash manufacturing and services PMI numbers exceeded market expectations. Although the probability of rate cut has dropped to below 50%, will the data be enough to sway the BoE from cutting interest rates in January?
At the end of the day, it’s a new year but the same story with Brexit. More drama and uncertainty will most likely be on the cards during the 11-month transition period, which could result in fresh pain and punishment for the British Pound. The BoE may decide to leave interest rates unchanged next week but leave the doors wide open for a potential rate cut March after reviewing more UK economic data.
However, if the BoE decides to pull the trigger on a rate cut this month, the Pound is poised to weaken against the Dollar and other G10 currencies.
Focusing on the technical picture, the GBPUSD remains in a 150-pip range on the daily charts with resistance at 1.3150 and support at 1.3000. There is a classic breakout setup in the making with the BoE policy meeting acting as a potential catalyst to trigger the move. A breakdown below 1.3000 could open a path towards 1.2830. However, a rebound and breakout above 1.3150 should open a path towards 1.3250.
Disclaimer: The content in this article comprises personal opinions and should not be construed as containing personal and/or other investment advice and/or an offer of and/or solicitation for any transactions in financial instruments and/or a guarantee and/or prediction of future performance. ForexTime (FXTM), its affiliates, agents, directors, officers or employees do not guarantee the accuracy, validity, timeliness or completeness, of any information or data made available and assume no liability as to any loss arising from any investment based on the same.
Italian politics has lurched back into the spotlight this week. Ahead of regional elections due over the weekend and into next week, there are fresh concerns for the political situation in the country.
5SM Leader Resigns
Luigi Di Maio, the head of the populist 5 Star Movement announced that he is standing down as the party leader.
5SM, which became known for its anti-establishment message, exploded in popularity over recent years. The party gained the most support in the 2018 elections.
However, following two consecutive coalition governments, the success of the party has visibly waned. Di Maio stated that he feels “an era is coming to an end”.
Regional Italian Elections This Weekend
The northern region of Emilia-Romagna will go to the polls on Sunday.
The expectation is that right-wing nationalists will oust the current center-left leaders there, which have been in place for decades. Such a result would mark a significant shift in voter sentiment. It would also cast jeopardy over the future of the government which is currently a coalition between center-left and the 5SM.
Di Maio’s resignation speech, which he gave in front of Hadrian’s temple in Rome, was emotive.
Di Maio said the 5SM was a “visionary project never achieved before and with no equal anywhere in the world.” He went onto say that Italy needs “to have time to sort out the mess made by those in power for the past 30 years.”
5SM Support Dwindling in Polls
Di Maio’s resignation is likely well-timed. Recent opinion polls ahead of Sunday’s elections have been reflecting a deterioration in support for the 5SM leader.
The 5SM is currently third in the polls with La League currently running roughly even with the ruling Democratic party.
The Democrats have been in control there for the last 75 years. Removing them from power would, therefore, be a significant achievement. It would also be a key turning point for the league party led by Matteo Salvini.
Democrats Downplay Talks Of Crisis
Despite the shock announcement this week, the ruling democratic party is keen to downplay fears of political crisis.
Speaking with CNBC, the Italian economy minister Roberto Gualtieri said:
“Not at all, it is not a political crisis, it is not affecting neither the government — by the way, Mr. Di Maio will remain foreign (affairs) minister — nor the majority, which is actually quite broad in the Parliament.”
Salvini’s La League party, which has a firm anti-immigration stance, is on the verge of a historic result in the upcoming elections. There are fears that such a result would help bolster broader support for the party putting the future of Italian politics in question.
Technical Perspective
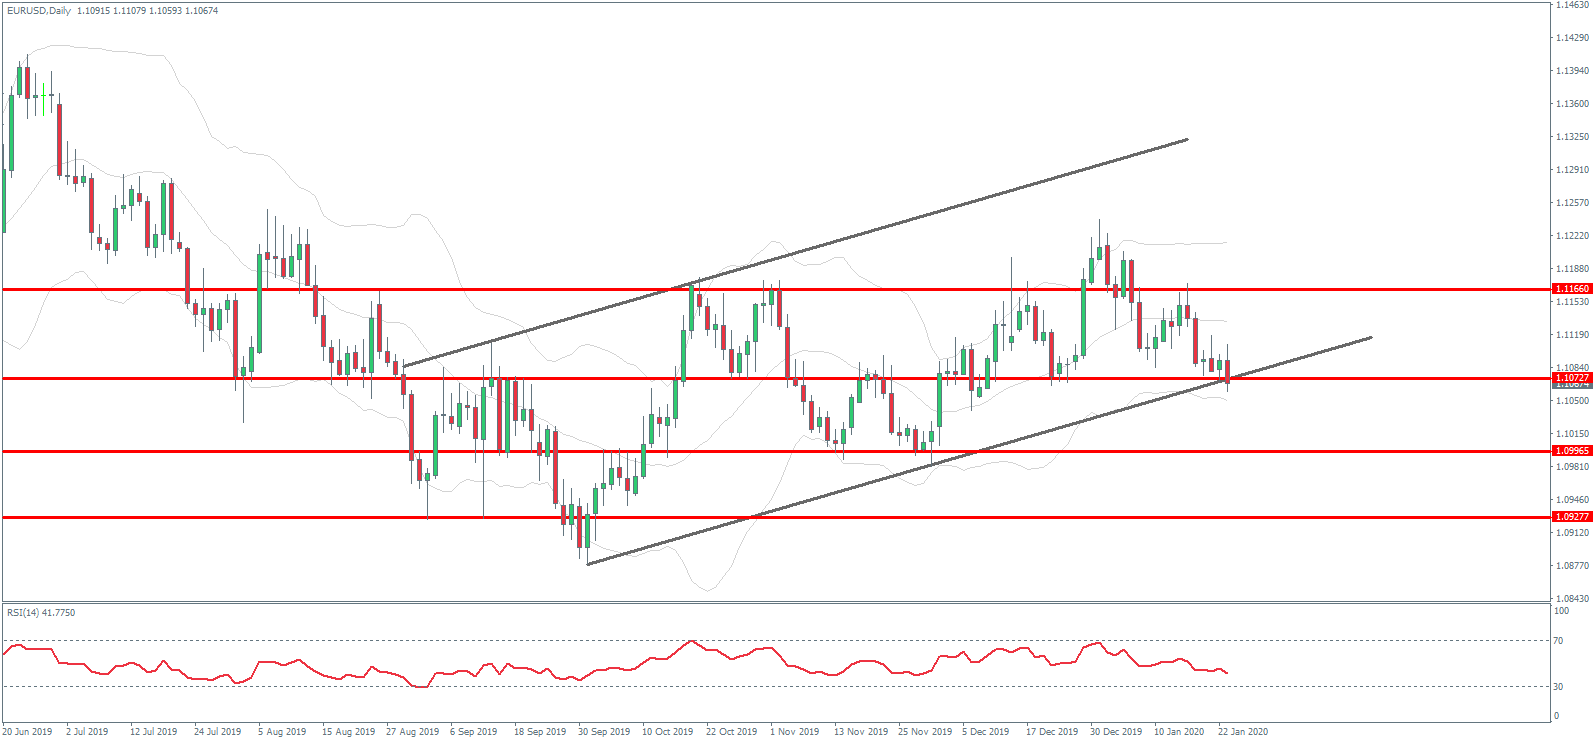
EURUSD has been under pressure this week. Price is currently testing the rising trend line of the corrective bear flag pattern.
A break here would open the way for a run down to deeper support at the 1.0996 and 1.0927 levels next. To negate this view, bulls will need to see price hold current support and make its way back above the 1.1166 level.
Neurotrope’s shares traded higher today after reporting results from its Phase 2 “203” clinical trial of Byrostatin-1 for treatment of moderately severe to severe Alzheimer’s patients. The firm has also been awarded a $2.7 million grant from the National Institutes of Health to conduct additional clinical research for patients with advanced Alzheimer’s disease.
Clinical-stage biopharmaceutical company Neurotrope Inc. (NTRP:NASDAQ), which is focused on developing novel therapies for neurodegenerative diseases, today announced its corporate update pertaining to recent developments at the company.
The company indicated that it has completed the analysis of the data from its recently reported Phase 2 confirmatory clinical (“203 study”) trial, which is examining moderately severe to severe Alzheimer’s disease patients treated with Byrostatin-1 in the absence of memantine/Namenda.
In reference to the 203 study, the company’s President and Chief Scientific Officer Dr. Daniel Alkon commented, “A significant imbalance (4.8 points) in the baseline Severe Impairment Battery (SIB) scores occurred, by chance, between the Bryostatin-1 treatment group and placebo group…After consulting with our Scientific Advisory Board and statistical experts, we were advised that, in a small study such as this, a baseline imbalance could prevent a definitive analysis of Bryostatin-1 treatment versus placebo in SIB scores at the primary (Week #13) and secondary endpoints as provided in the original Statistical Analysis Plan (SAP).”
Kazem Kazempour, CEO of Amarex Inc., the biostatistician retained to analyze the data from the 203 study under the SAP added, “Due to the baseline imbalance observed in the study, and because a clear signal of benefit could be observed in the raw data from the pre-specified Moderate Stratum, we conducted a post-hoc analysis using paired data for individual patients, with each patient as his/her own control…A total of 65 patients had both baseline and week 13 values, from which there were 32 patients in the Bryostatin-1 treatment group and 33 patients in the placebo group. There was a statistically significant improvement over baseline (4.8 points) in the mean SIB at week 13 for subjects in the Bryostatin-1 treatment group.”
The firm additionally reported that “it was awarded a $2.7 million grant from the National Institutes of Health (NIH) to support an additional Phase 2 clinical study focused on the Moderate Stratum for which the company saw improvement in the 203 study.”
Dr. Marwan Sabbagh, director of the Cleveland Clinic Lou Ruvo Center for Brain Health and advisor on the design of the 203 trial, remarked, “I am encouraged by the NIH funding…The data suggests that Bryostatin may still be considered a new approach to Alzheimer’s treatment.”
Neurotrope is headquartered in New York City and began the day with a market capitalization of around $18.9 million with approximately 13.07 million shares outstanding and a short interest of about 4.1%. NTRP shares opened almost 56% higher today at $2.26 (+$0.8102, +55.88%) over yesterday’s $1.4498 closing price. The stock has traded today between $2.25 and $3.85 per share and is currently trading at $3.09 (+$1.64, +113.13%).
Disclosure: 1) Stephen Hytha compiled this article for Streetwise Reports LLC and provides services to Streetwise Reports as an independent contractor. He or members of his household own securities of the following companies mentioned in the article: None. He or members of his household are paid by the following companies mentioned in this article: None. 2) The following companies mentioned in this article are billboard sponsors of Streetwise Reports: None. Click here for important disclosures about sponsor fees. 3) Comments and opinions expressed are those of the specific experts and not of Streetwise Reports or its officers. The information provided above is for informational purposes only and is not a recommendation to buy or sell any security. 4) The article does not constitute investment advice. Each reader is encouraged to consult with his or her individual financial professional and any action a reader takes as a result of information presented here is his or her own responsibility. By opening this page, each reader accepts and agrees to Streetwise Reports’ terms of use and full legal disclaimer. This article is not a solicitation for investment. Streetwise Reports does not render general or specific investment advice and the information on Streetwise Reports should not be considered a recommendation to buy or sell any security. Streetwise Reports does not endorse or recommend the business, products, services or securities of any company mentioned on Streetwise Reports. 5) From time to time, Streetwise Reports LLC and its directors, officers, employees or members of their families, as well as persons interviewed for articles and interviews on the site, may have a long or short position in securities mentioned. Directors, officers, employees or members of their immediate families are prohibited from making purchases and/or sales of those securities in the open market or otherwise from the time of the interview or the decision to write an article until three business days after the publication of the interview or article. The foregoing prohibition does not apply to articles that in substance only restate previously published company releases. 6) This article does not constitute medical advice. Officers, employees and contributors to Streetwise Reports are not licensed medical professionals. Readers should always contact their healthcare professionals for medical advice.
The latest report from the Energy Information Administration has added further downside pressure for crude prices this week.
The EIA update showed that US crude inventories fell by 400k barrels last week.
News of a drawdown is typically positive. However, on the back of last week’s 2.5 million barrel drawdown, the market had been expecting a 1 million barrel decline. Therefore, it was disappointed by the news of a weaker than expected draw.
Gasoline Inventories Increase
Other elements of the report were also more obviously bearish.
The data showed that gasoline inventories were higher by 1.75 million barrels over the week. This increase was above the expected 1 million barrel level.
However, distillate stockpiles were far lower than expected. These dropped by 1.2 million barrels over the week versus an expected build of 3 million barrels.
Crude prices have been weighed down due to the outbreak of the Wuhan virus in China. This has already claimed the lives of nearly 20 people while infecting a further several hundred.
The virus has already spread across Asia, with one confirmed case in America and further possible cases identified as far as Scotland.
Wuhan Virus Causing Concern
A wave of reduced risk appetite has hit the markets. Traders are fearing a SARS-like outbreak which could cause widespread economic damage and reduced fuel demand.
The SARS outbreak in 2003 caused a sharp drop in fuel demand. It also sparked a recession in Hong Kong and a sharp economic hit to China.
If the outbreak continues to intensify, there are fears that the local economy, already in the throes of a downturn, will suffer significantly.
EIA Forecasts Lower Prices
In its January short-term energy outlook, the EIA forecast crude prices to fall over 2020.
The driver behind this projection is the passing of geopolitical risks such as the tension between the US and Iran.
However, there are several factors providing upward pressure. These include the progress being made towards ending the US/China trade war, the greater clarity around Brexit and the increase in OPEC production cuts announced in December.
Technical Perspective
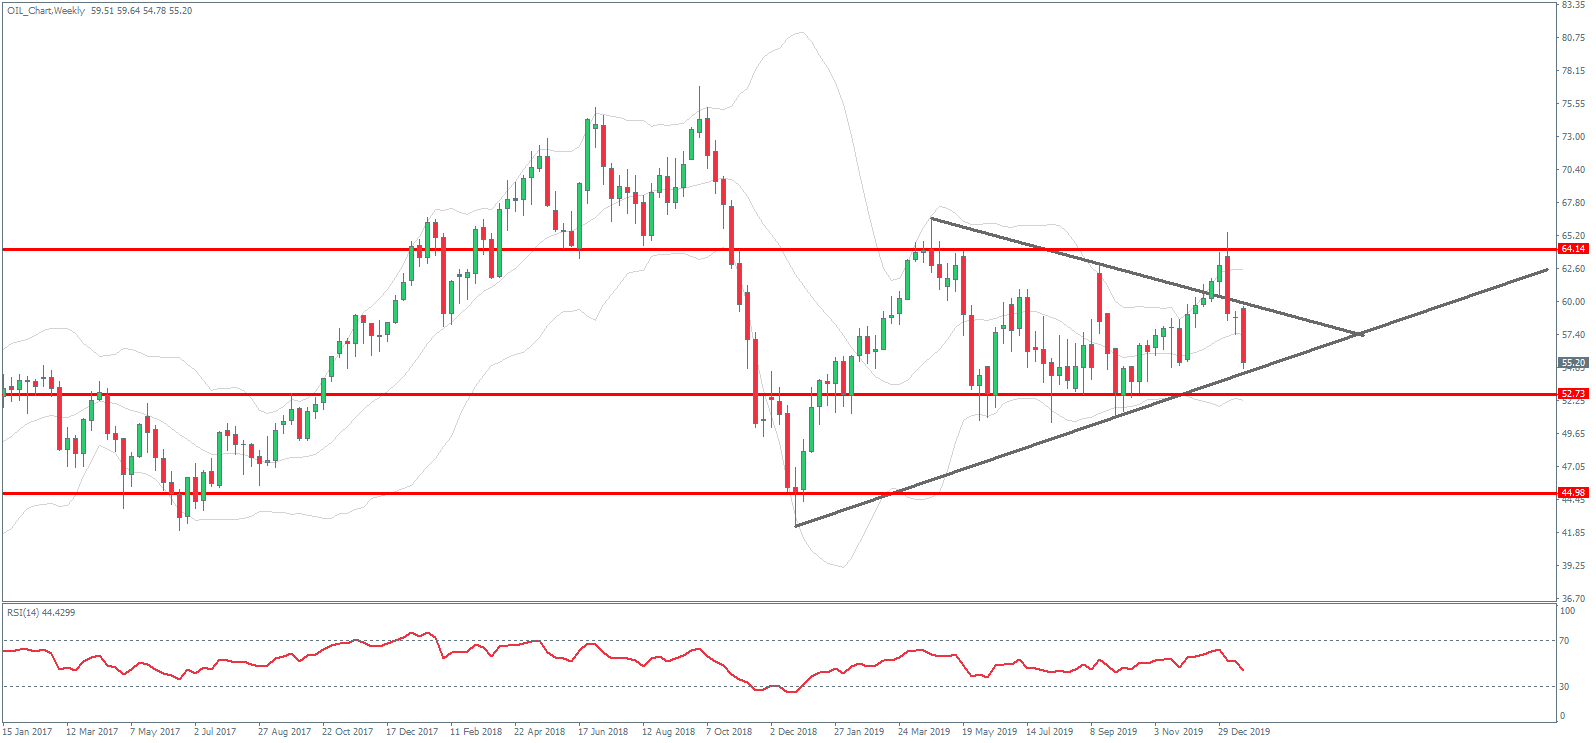
Frustratingly for crude traders, if we look at the higher timeframe you can see that not much has changed.
Price is essentially trading where it was a year ago. Despite having broken above 64, the reversal has brought price right back down into the middle of the range which framed much of last year’s price action.
Crude is currently challenging the rising trend line from last year’s lows. If we break here, the next level to watch will be the 57 mark, with the 2018 lows below that as the main downside marker.
The short answer is, yes. The Chinese Lunar New Year routinely has an effect on the price of gold.
But just as important is why, and what that means for people who are interested in trading the precious metal.
So how much of an effect is it? And can we expect the effect to keep happening?
China’s Gold Obsession
It’s not surprising that the most populous country in the world would be a large consumer of any given product.
But gold is a special case in China, even more than the second-largest importer of gold, India. There are traditional, historic and simple practical reasons for this.
Let’s get an idea of scale. China produces over a third of the world’s gold, but even so is still the largest importer.
This isn’t just the government and financial institutions building reserves, but Chinese citizens are the largest holders of gold on a per capita basis.
It’s More than a Tradition
There is a long tradition of saving in China, but at the same time significant distrust of official currency.
Seeking safe places to store value has given rise to the demand for foreign investments, and fueled the housing market. But the most practical way to store value is to buy gold. And Chinese people who can afford to will put a sizable portion of their savings into jewelry or simple bullion.
The first recorded instance of paper money is from China, which also implies the longest history of worrying about the value of fiat currencies.
With tight government control over currency, which is subject to political control, gold also offers an alternative for freer exchange.
The Special Date
The Lunar New Year is a week-long holiday period in which the Chinese will meet with relatives, and exchange gifts. By far the most popular gift is some form of gold.
In anticipation of this demand, gold prices in the entire world can start rising in the months leading up to the Lunar New Year, as Chinese firms build inventory.
As China has increased in wealth thanks to its booming economy, millions of Chinese are now able to afford gold, and the consequent demand for what is, in the end, a finite resource, has skyrocketed.
The Future
With the Chinese economy continuing to grow and the reasons to want gold not likely to go away, it’s likely that the Lunar New Year will continue to be a significant factor in the price of gold going forward, possibly increasing the effect on the market.
China’s notorious lack of transparency makes it hard to know exactly how much gold is held by Chinese citizens.
Another event that overlaps with the demand for gold from China is the start of the wedding season in India. Indian weddings are characterized by gold being used as a sign of wealth.
The building of inventory for these events also starts along with the Lunar New Year, with both combining to make the start of the year a good time to have gold in your portfolio.
On the daily timeframe HK50: D1 is testing Fibonacci 38.2 level, above the 200-day moving average MA(200), which is declining.
We believe the bearish momentum will continue after the price breaches below the lower boundary of Donchian channel at 27563. A level below this can be used as an entry point for placing a pending order to sell. The stop loss can be placed above Fibonacci 23.6 level at 28374.1. After placing the order, the stop loss is to be moved every day to the next fractal high, following Parabolic signals. Thus, we are changing the expected profit/loss ratio to the breakeven point. If the price meets the stop loss level (28374.1) without reaching the order (27563), we recommend cancelling the order: the market has undergone internal changes which were not taken into account.
Hong Kong economy performance has been deteriorating in recent weeks. Will the HK50 decline?
> Hong Kong economic data in the last couple of weeks were weak. Retail sales decline continued: sales declined 25.4% over year in November after 26.4% fall in previous month. The private sector contraction continued the 21st straight month in December. Businesses pessimism continued in the first quarter of 2020 though it eased. And unemployment ticked up to 3.3% in December from 3.2% a month ago. And couple of days ago Moody’s downgraded the territory’s credit rating. Deteriorating economic data are bearish for HK50.
The US dollar has been firmer over the last 24 hours with the USD index breaking above the 97.42 level yesterday. For now, momentum has stalled and price is sitting just above this level. The absence of any key US data this week means that moves have been light. However, USD sentiment is generally positive and further upside looks likely.
Euro Lower Following ECB
EURUSD has been firmly lower today. The ECB launched its strategy review at yesterday’s policy meeting though warned markets that while the review is underway, its monetary policy approach will not be on auto-pilot. EURUSD has broken through the 1.1072 level now and is trading 1.1049 last.
GBP Down Despite Better Data
GBPUSD reversed sharply from initial highs on the session above the 1.3150 level to trade 1.3119 last. The UK manufacturing PMI released today was seen rising to a nine-month high, though still below the 50-level at 49.8, the reaction in GBP has been firmly bearish.
Risk Assets Recovering
Risk assets have had a tricky week. The outbreak of the Wuhan virus in China weighed on equities initially though late in the week we saw a shift in sentiment with the SPX500 rallying off the week’s lows to trade back up towards recent highs.
JPY & Gold Lower
Safe havens have been lower today with both the Japanese yen and gold trading lower against the USD in light of the rally in both USD and equities. XAUUSD trades 1559.69 last, sitting atop the 1554.69 level into the end of the week. USDJPY is trading back beneath the 109.71 level today at 109.68 last.
EIA Reports Inventories Drawdown
Oil prices have been lower again today, ending the week firmly in the red. While crude saw some mild recovery yesterday on news of an EIA inventories drawdown, the move has been shallow compared to the declines suffered over the week on fears that the Wuhan virus will negatively impact crude demand. Crude trades 55.64 last.
BOC Sends Dovish Signals
USDCAD has been lower today. Despite the weakness in crude and the strength in USD over the week, the loonie has fallen back below the 1.3145 level to trade 1.3125 on Friday. At the BOC meeting this week the bank struck a more dovish tone, citing weakness in the domestic and global economy and the potential need for easing in the near future.
Aussies Rallies On Risk Recovery
AUDUSD has been a little higher today, benefitting from the recovery in risk appetite. Aussie employment data this week was better than expected with the unemployment rate falling to 5.1%. However, the market is still anticipating an RBA rate cut in response to bushfires which have been raging over the last month. AUDUSD trades .6853 last, sitting back above the .6850 level for now.
Equity markets were seen trading rather flat for the third consecutive day. The rally looks to be pausing for the moment as the earnings season gets underway.
The declines were attributed to mostly weaker banking stocks leading the way. On the economic front, data from the US was rather quiet.
Euro Falls on Dovish ECB Comments
The European Central Bank held its monetary policy meeting on Thursday. The central bank left interest rates unchanged as widely expected. The central bank also announced that it would begin a strategic review of its monetary policy.
At the press conference, ECB Chief Lagarde cited that downside risks for the euro still remain. This saw the markets reacting negatively to the comments.
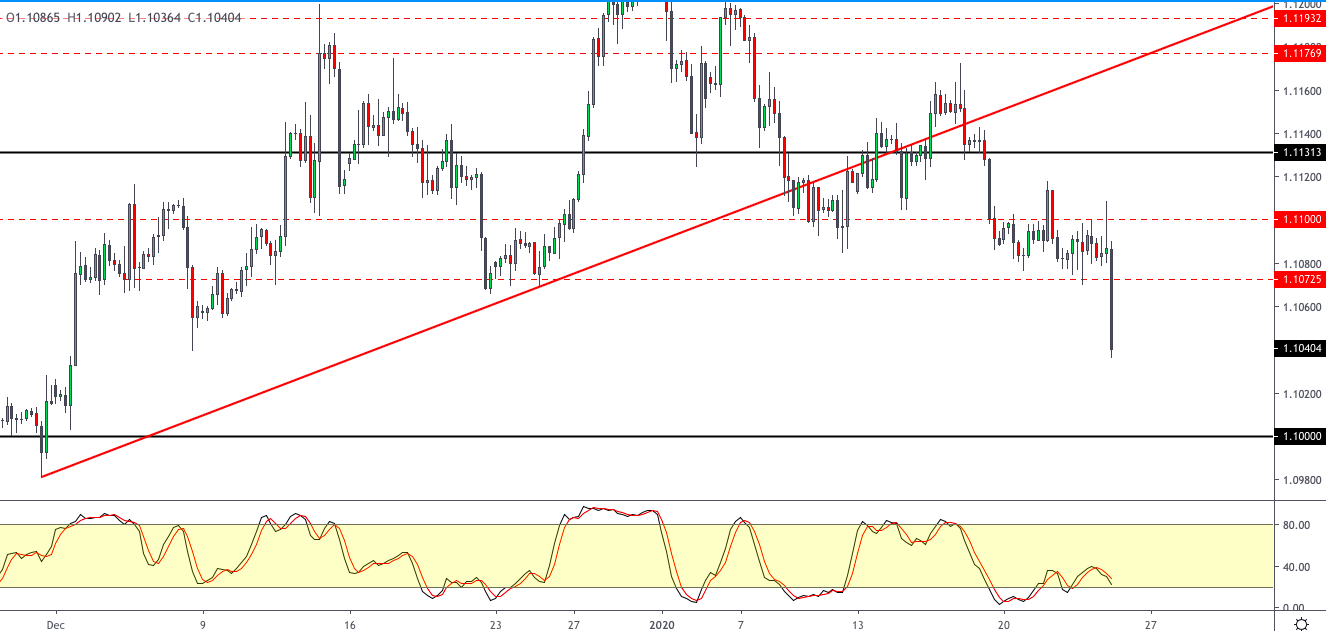
EURUSD Breaks Out to the Downside
The euro broke past its sideways range to the downside. Losing over 0.4% on the intraday basis, EURUSD is now likely to continue to drift lower. The next major support area is at the 1.1000 region, which offers psychological support.
In the near term, the currency pair might retrace losses and retest the 1.1072 level to establish resistance.
Sterling Falls as Brexit Becomes Official
The pound sterling reacted negatively to the news after UK lawmakers officially passed legislation to make the Brexit deal official.
It is now pending with the European Union officials, who have until next week to pave the way for the UK’s exit from the EU. Following the agreement in the parliament, the legislation received the royal assent.
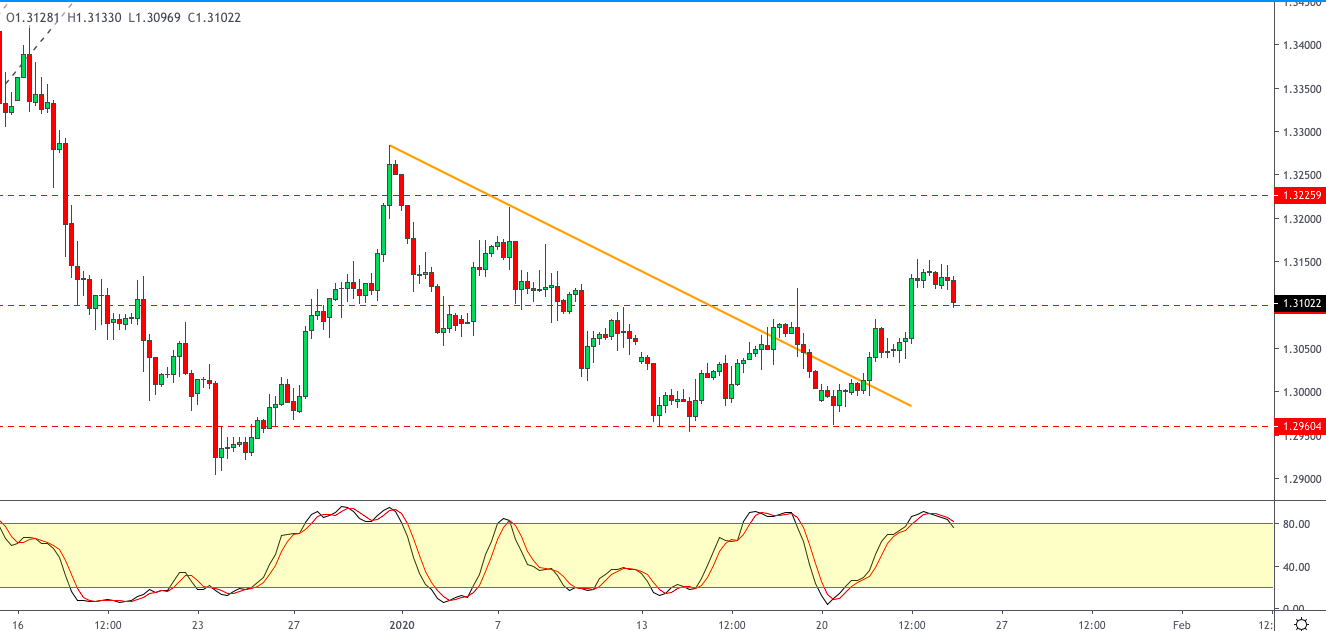
GBPUSD Declines to be Limited for Now
The current declines in the GBPUSD coincide after the currency pair broke past the 1.3100 level. The retracement will see the GBP testing the level of 1.3100 where support could now be forming.
As long as this level holds, GBPUSD remains biased to the upside with 1.3226 being the next target.
Gold Prices Continue to Consolidate
The precious metal continues to remain trading flat, albeit close to the seven-year highs. The dovish ECB message saw some bounce in the precious metal, which faded over the intraday session.
Gold prices were also muted to the weekly jobless claims report. With the Fed meeting due next, we expect this flat trading to continue.
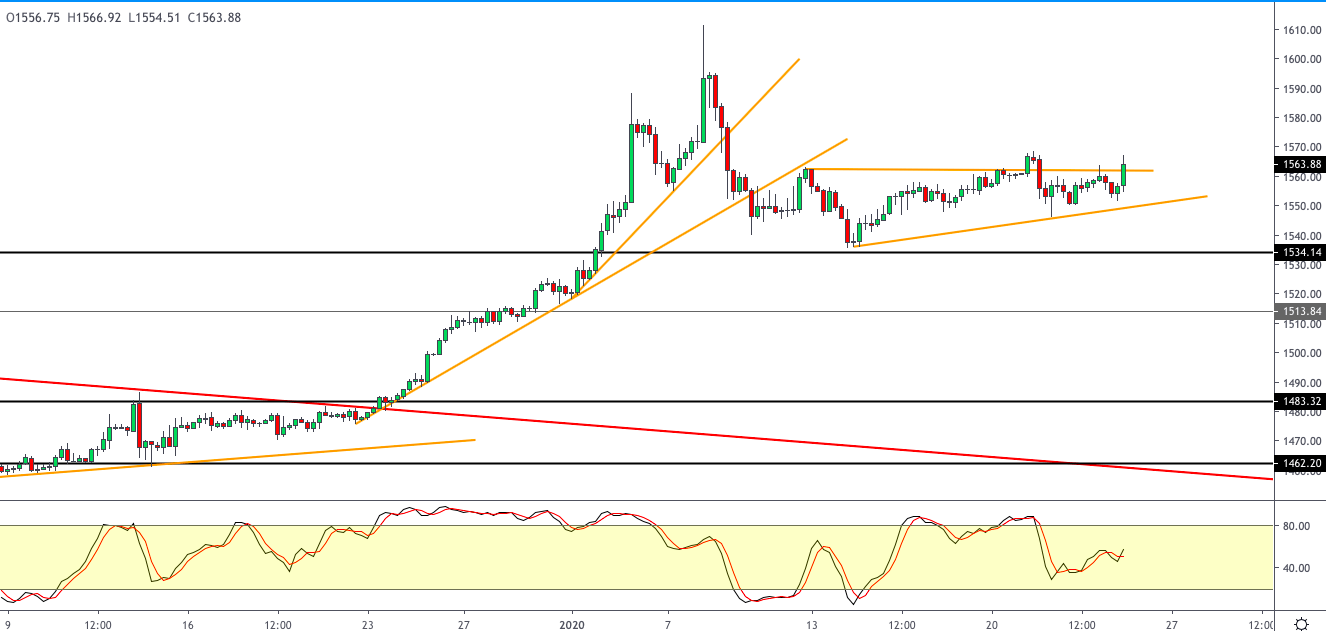
XAUUSD Testing the Resistance
The precious metal pared losses and is once again back near the resistance area of 1562. The ascending triangle pattern remains in play. An upside breakout will potentially trigger further gains.
However, this will put gold prices to test the previous highs. Failure to breakout higher could result in either price consolidating or perhaps correcting lower.