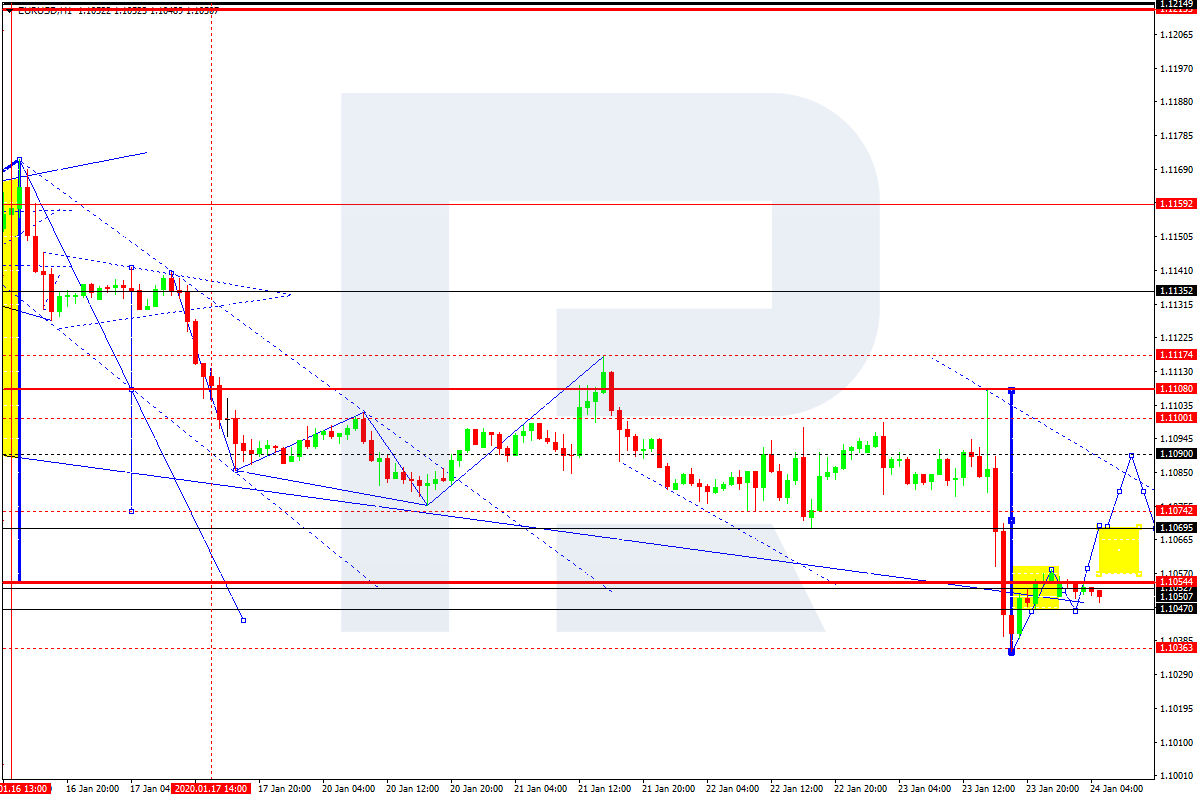
After finishing the descending wave, EURUSD has completed the ascending impulse at 1.1058; right now, it correcting towards 1.1047. Possibly, today the pair may consolidate between these two levels. Later, the market may break the range to the upside and start a new growth with the short-term target at 1.1090.
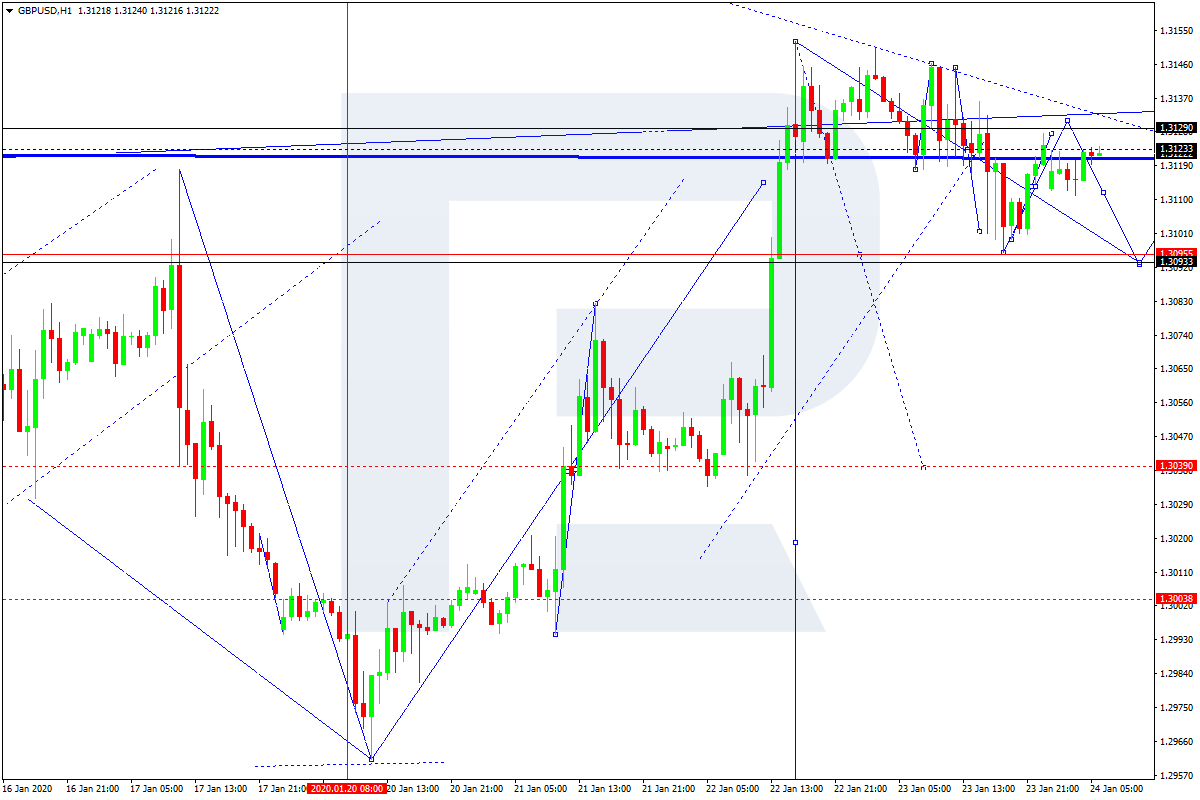
GBPUSD, “Great Britain Pound vs US Dollar”
GBPUSD has formed two descending impulses; right now, it is correcting towards 1.3129. After that, the instrument may form a new descending structure to reach 1.3093 and then resume trading upwards with the target at 1.3123.
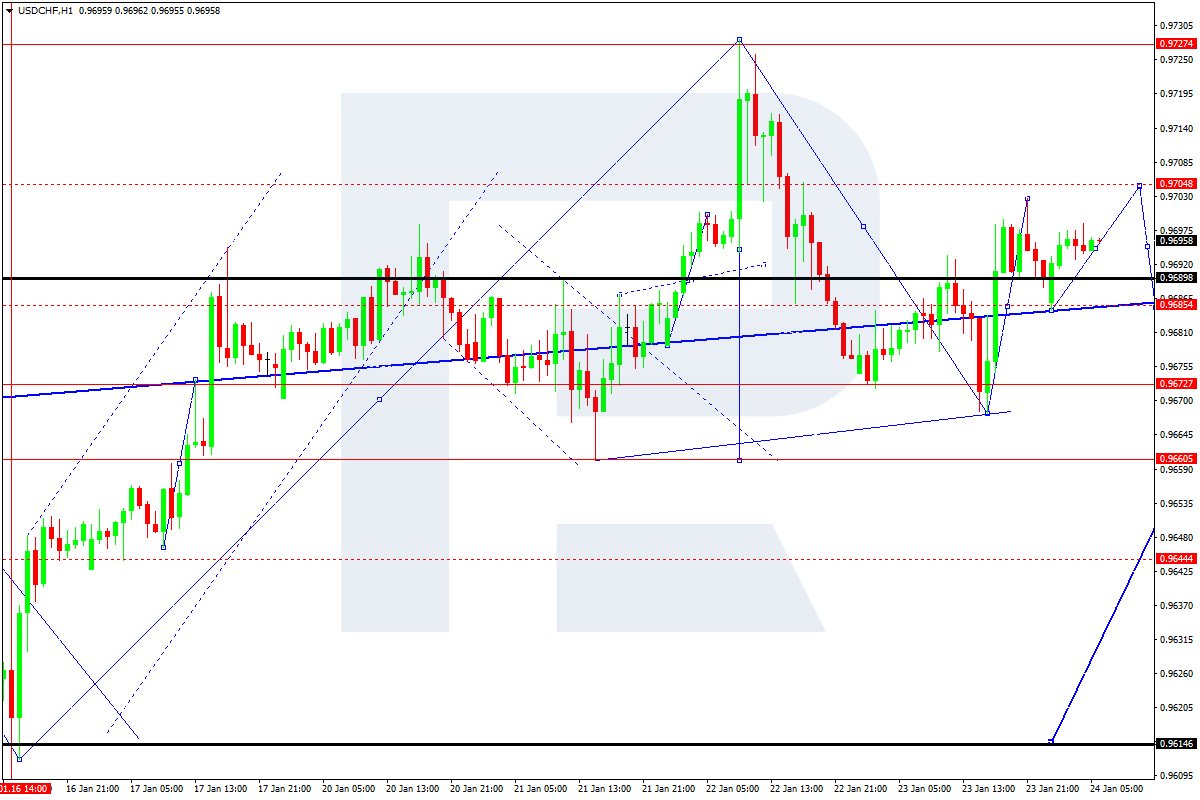
USDCHF, “US Dollar vs Swiss Franc”
USDCHF has completed the correction towards 0.9686; right now. it is growing with the target at 0.9704. Possibly, the pair may reach it and then form a new descending structure to return to 0.9686. After that, the instrument may consolidate around 0.9690.
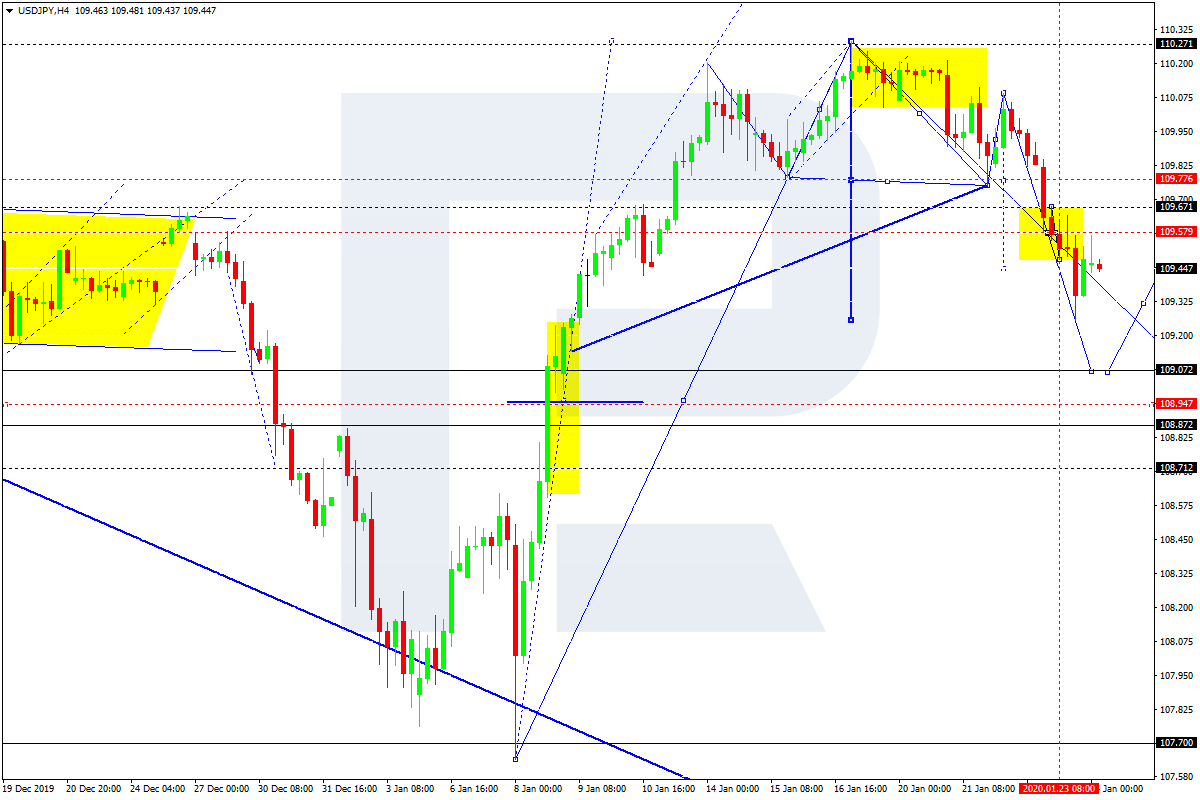
USDJPY, “US Dollar vs Japanese Yen”
After forming a continuation pattern around 109.57 and breaking it to the downside, USDJPY is forming the second descending impulse. Possibly, the pair may fall with the short-term target at 109.08. Later, the market may start another correction to return to 109.57 and test it from below.
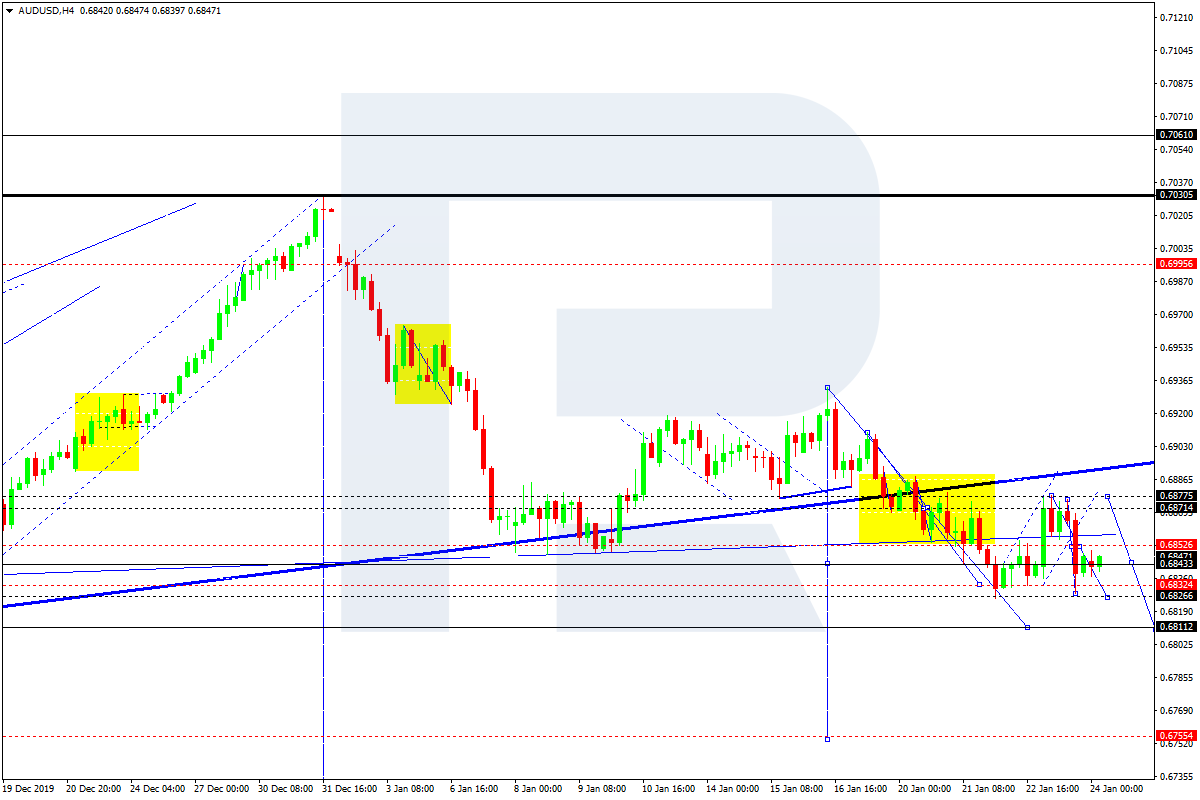
AUDUSD, “Australian Dollar vs US Dollar”
AUDUSD has broken 0.6853. Possibly, the pair may continue moving downwards with the short-term target at 0.6811.
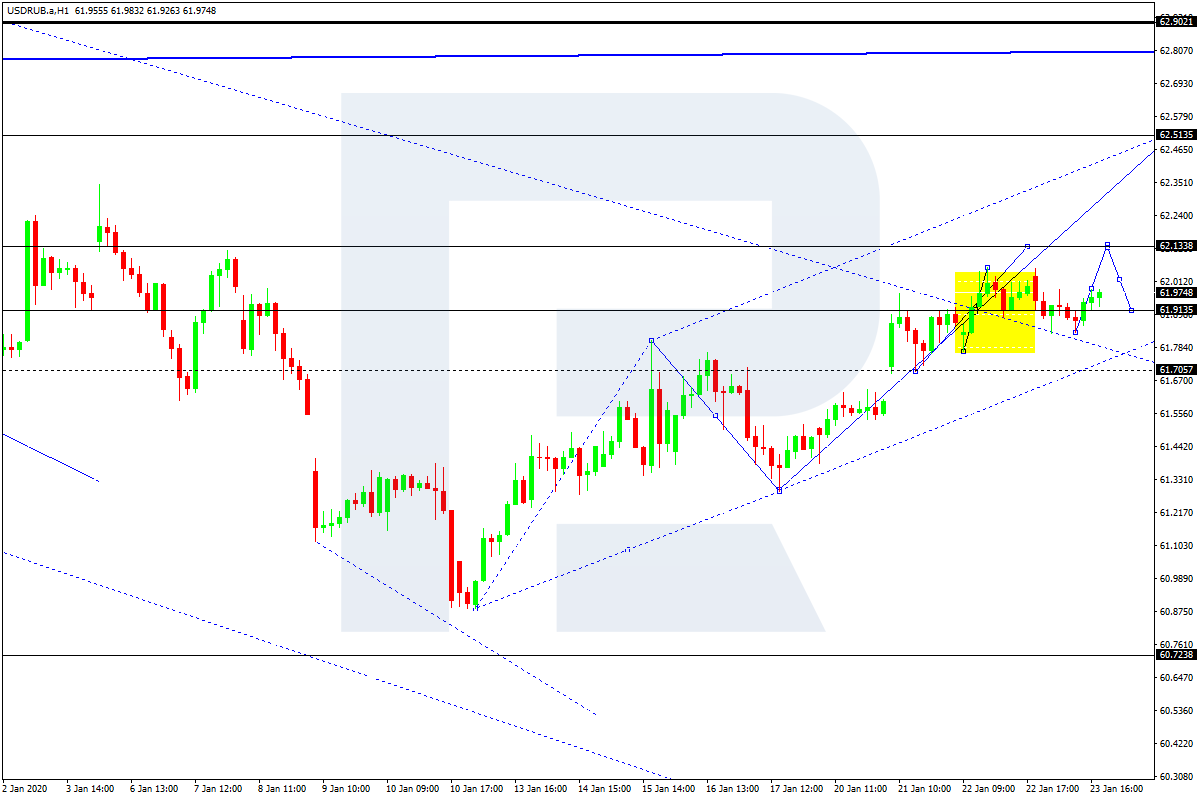
USDRUB, “US Dollar vs Russian Ruble”
USDRUB is still consolidating around 61.90 without any particular direction. According to the main scenario, the price is expected to continue the correction towards 63.00. Possibly, today the pair may grow to reach 62.15 and then form a new descending structure with the target at 61.91.
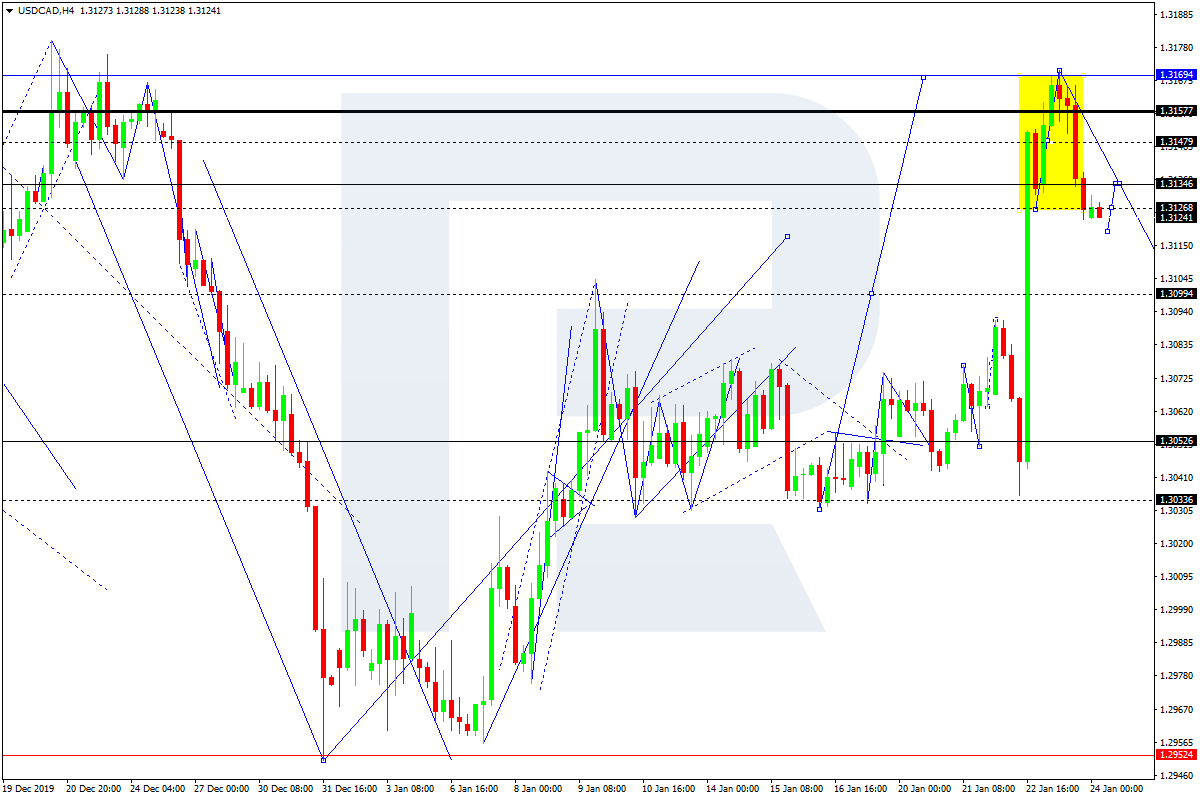
USDCAD, “US Dollar vs Canadian Dollar”
USDCAD is trading downwards. Possibly, the pair may break 1.3126 and then continue falling towards 1.3099. After that, the instrument may start a new growth to return to 1.3126.
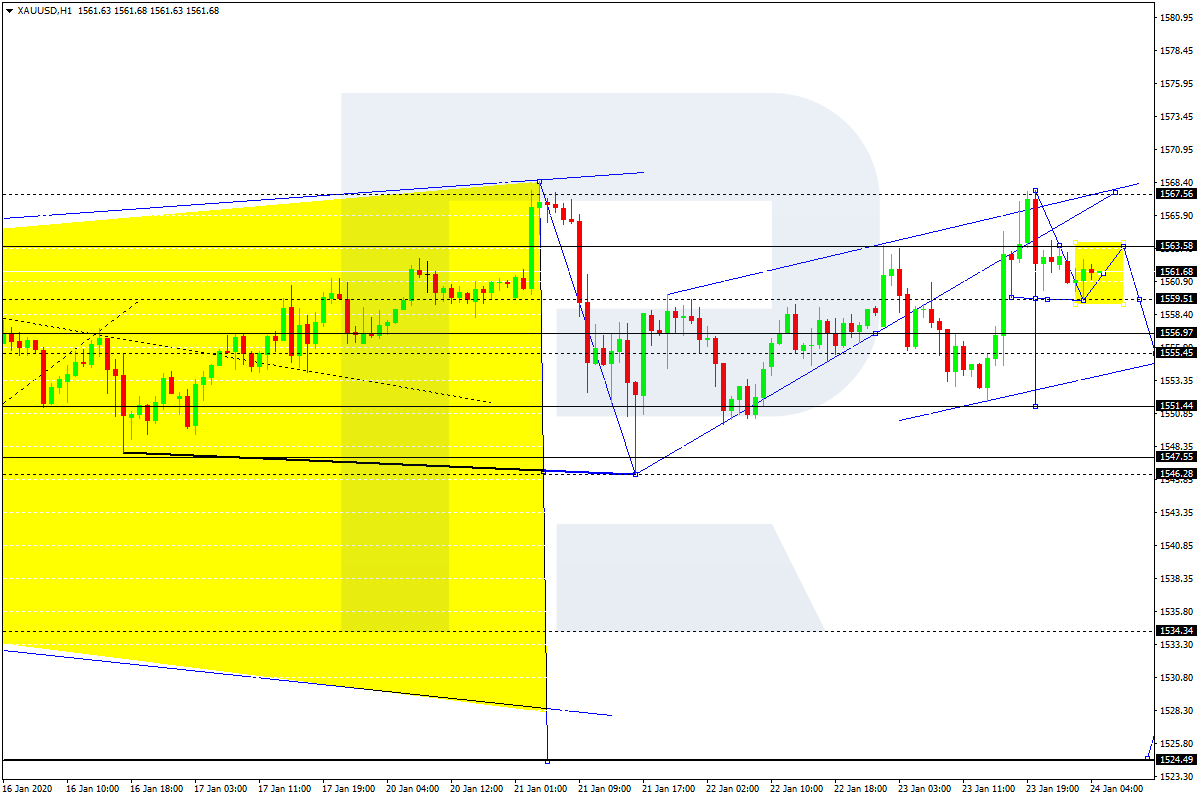
XAUUSD, “Gold vs US Dollar”
Gold has reached the target of Flag correctional pattern at 1567.55; right now, it is falling with the short-term target at 1555.45. Later, the market may resume trading upwards to reach 1559.50.
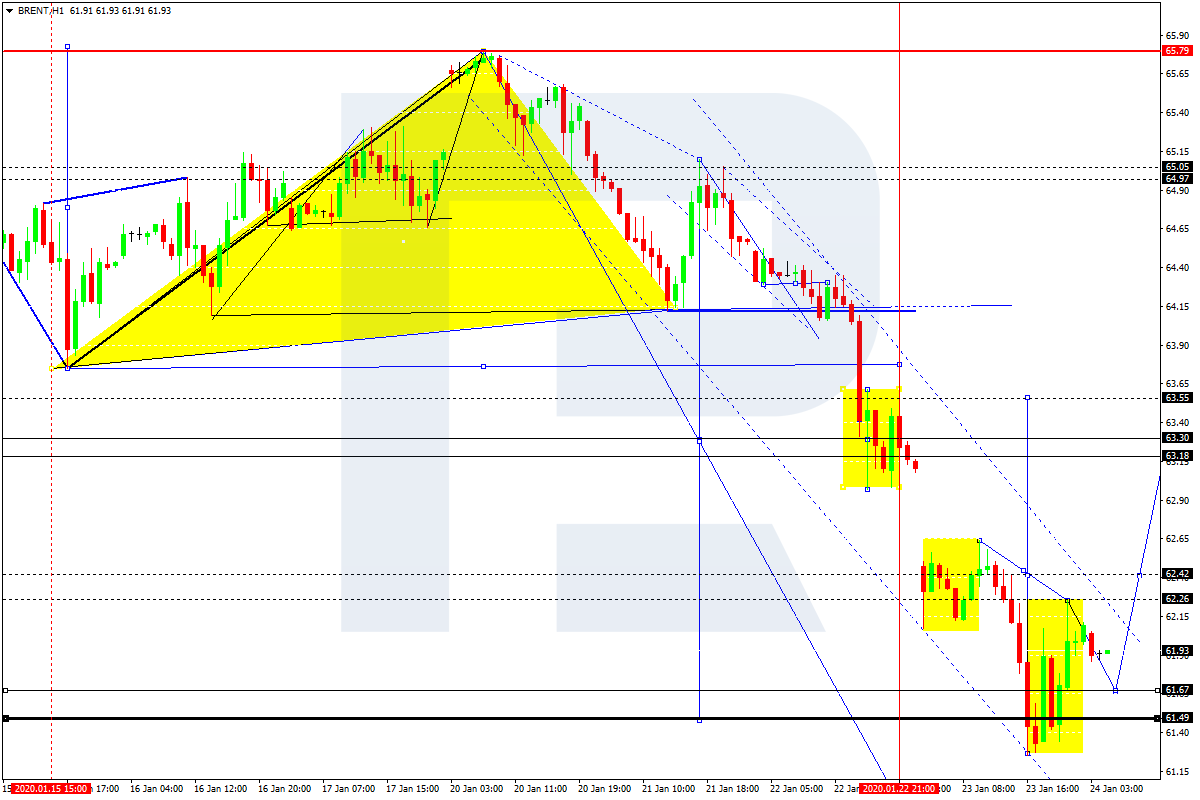
BRENT
Brent has finished the ascending impulse towards 62.26. Today, the pair may correct towards 61.67 and then form one more ascending structure with the short-term target at 63.18.
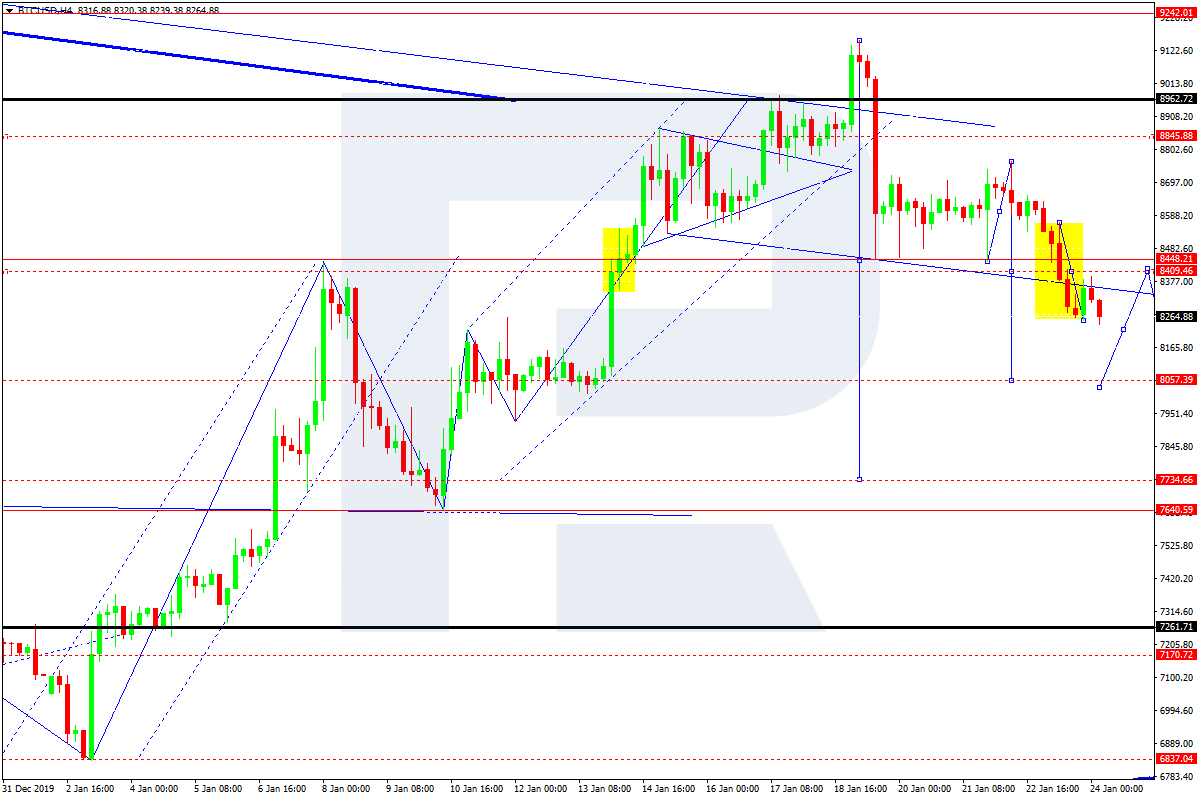
BTCUSD, “Bitcoin vs US Dollar”
BTCUSD is forming the second descending impulse with the target at 8060.00. The main scenario implies that the pair may reach this level and then start a new correction towards 8400.00. After that, the instrument may resume trading downwards to reach 7750.00.
Attention! Forecasts presented in this section only reflect the author’s private opinion and should not be considered as guidance for trading. RoboForex LP bears no responsibility for trading results based on trading recommendations described in these analytical reviews.
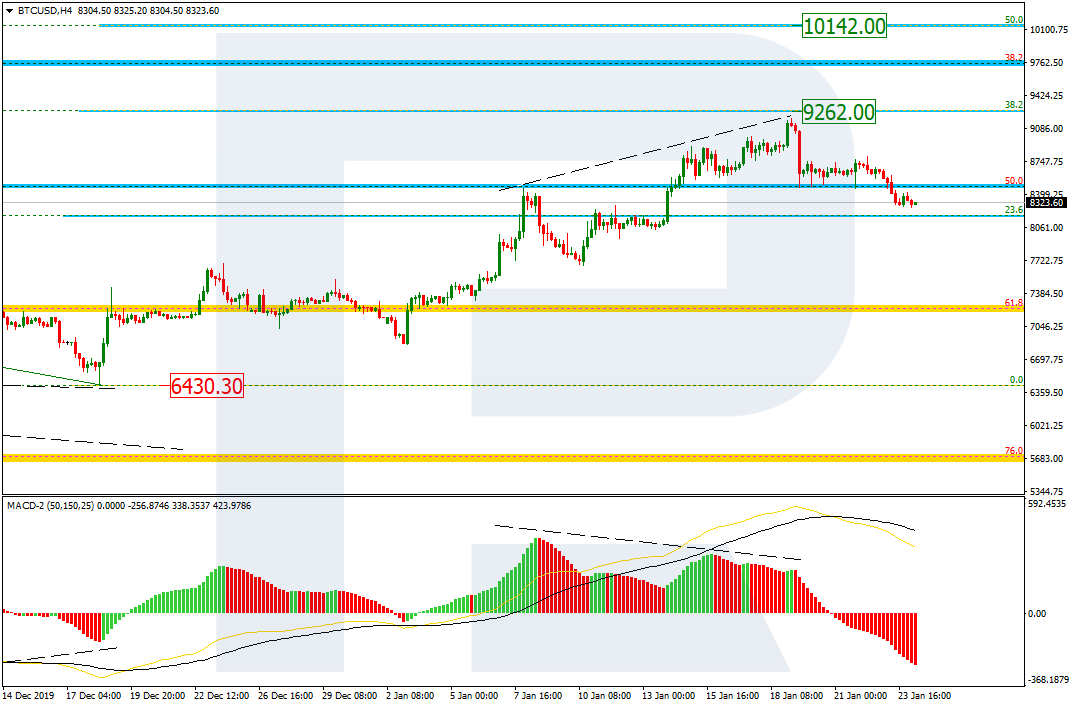
As we can see in the H4 chart, the divergence made BTCUSD complete the correctional uptrend close to 38.2% fibo at 9262.00. At the moment, the pair is forming a pullback towards 23.6% fibo. After finishing the pullback, the instrument is expected to start a new rising impulse towards 50.0% fibo at 10142.00.
The H1 chart shows more detailed structure of the current descending correction. The pair is trading towards 38.2% fibo at 8133.60 and may later reach 50.0% fibo at 7808.00. At the same time, there is a convergence on MACD. The resistance is the local high at 9183.20.
ETHUSD, “Ethereum vs. US Dollar”
As we can see in the daily chart, the correctional uptrend has reached 23.6% fibo. Possibly, ETHUSD may start a short-term pullback and then form a new rising wave towards 38.2% and 50.0% at 210.75 and 239.65 respectively. the support is the low at 116.06.
The H4 chart shows more detailed structure of the current descending correction. The pair is moving very close to 38.2% fibo at 154.90 and may continue falling towards 50.0% fibo at 147.50. The resistance is the high at 178.99.
Attention! Forecasts presented in this section only reflect the author’s private opinion and should not be considered as guidance for trading. RoboForex LP bears no responsibility for trading results based on trading recommendations described in these analytical reviews.
The EUR/USD currency pair has moved down after the ECB meeting. During yesterday’s and today’s trades the drop in quotations exceeded 60 points. As expected, the regulator kept the main parameters of monetary policy at the same level. The central bank is concerned about weak inflation prospects, as well as growing risks in international trade. The ECB plans to further stimulate the economy for a long period of time. At the moment, the trading instrument is consolidating in the range of 1.10300-1.10600. EUR/USD quotes have potential for further decline. Open positions from key levels.
Mixed data on business activity in Germany and the euro zone was published today.
The indicators signal the sellers’ strength: the price has fixed below 50 MA and 100 MA.
The MACD histogram is in the negative zone, which indicates a bearish mood.
The Stochastic Oscillator is located near the oversold area, the %K line is below the %D line, which gives a weak sell signal for EUR/USD.
Trading recommendations
Support levels: 1.10300, 1.10000
Resistance levels: 1.10600, 1.10800, 1.11000
If the price fixes below 1.10300, expect further decline of EUR/USD quotes to 1.1000-1.09800.
Alternatively, the quotes could recover toward 1.10800-1.11000.
The GBP/USD currency pair
Technical indicators of the currency pair:
Prev Open: 1.31387
Open: 1.31236
% chg. over the last day: -0.18
Day’s range: 1.30800 – 1.31729
52 wk range: 1.1959 – 1.3516
The GBP/USD currency pair has stabilized. Sterling is currently trading in a flat. There is no defined trend. Financial market participants are waiting for additional drivers. The key range is 1.30800-1.31200. Elizabeth II signed a bill on the country’s exit from the European Union (EU), which was prepared by Prime Minister Boris Johnson. Now the document has received the status of a law and gained legal force. Open positions from key levels.
The Economic News Feed for 24.01.2020 is calm.
Indicators do not give accurate signals: the price has fixed between 50 MA and 100 MA.
MACD histogram is near the 0 mark.
The Stochastic Oscillator is located in the neutral zone, the %K line is below the %D line, which indicates a bearish mood.
Trading recommendations
Support levels: 1.30800, 1.30350, 1.30000
Resistance levels: 1.31200, 1.31500, 1.31700
If the price fixes below 1.30800, GBP/USD quotes are expected to fall toward 1.30400-1.30200.
Alternatively, the quotes could grow toward 1.31500-1.31800.
The USD/CAD currency pair
Technical indicators of the currency pair:
Prev Open: 1.31347
Open: 1.31268
% chg. over the last day: -0.06
Day’s range: 1.31211 – 1.31424
52 wk range: 1.2949 – 1.3566
USD/CAD quotes have stabilized after a sharp rise at the beginning of this week. At the moment the Mooney is consolidating. The local support and resistance levels are: 1.31200 and 1.31500, respectively. The Canadian dollar continues to be under pressure from the negative dynamics of oil quotations. We do not rule out further growth of the USD/CAD currency pair. Today, investors will evaluate important economic releases from Canada. We recommend opening positions from these marks.
At 15:30 (GMT+2:00) Canada will release a report on retail sales.
Indicators do not give accurate signals: the price has crossed 50 MA.
MACD histogram is near the 0 mark.
The Stochastic Oscillator is located in the neutral zone, the %K line is above the %D line, which indicates a bullish mood.
Trading recommendations
Support levels: 1.31200, 1.30900, 1.30750
Resistance levels: 1.31500, 1.31700
If the price fixes above 1.31500, expect further growth of USD/CAD toward 1.31800-1.32200.
Alternatively, the quotes could descend toward 1.30900-1.30700.
The USD/JPY currency pair
Technical indicators of the currency pair:
Prev Open: 109.832
Open: 109.487
% chg. over the last day: -0.25
Day’s range: 109.439 – 109.652
52 wk range: 104.45 – 113.53
Bearish sentiment prevails on USD/JPY currency pair. The trading instrument has set new local lows. At the moment USD/JPY is consolidating in the range 109.450-109.650. The demand for “quiet harbor” currencies remains at a fairly high level. We do not rule out further growth of the yen against the US dollar. We recommend you to pay attention to the dynamics of US government bond yields. Positions should be opened from key levels.
The news background on the Japanese economy is quite calm.
Indicators do not give accurate signals: the price is testing 50 MA.
MACD histogram is near the 0 mark.
The Stochastic Oscillator is located in the neutral zone, the %K line is below the %D line, which indicates a bearish mood..
Trading recommendations
Support levels: 109.450, 109.300, 109.000
Resistance levels: 109.650, 109.850
If the price fixes below 109.450, expect a descend toward 109.200-109.000.
Alternatively, the quots could grow toward 109.800-110.000.
During yesterday’s trading session, the US dollar strengthened slightly against a basket of major currencies. The dollar index (#DX) closed in the green zone (+0.19%). The ECB meeting was the key event. The regulator, as expected, kept the key marks of monetary policy at the same level. The central bank is worried about weak inflation prospects, as well as rising risks in international trade. The ECB plans to further stimulate the economy over a long period of time.
Investors continue to monitor the coronavirus from China. Thus, the World Health Organization (WHO) reported that so far, the virus was a local crisis, and had not assigned it the status of a global emergency. For now, 25 fatal cases and more than 800 cases of infection have been recorded
Queen of the United Kingdom Elizabeth II signed a bill on the country’s exit from the European Union (EU), which was prepared by Prime Minister Boris Johnson. Now the document has received the status of law and gained legal force. At the next stage, the deal should be ratified by the European Parliament, which is scheduled for January 29.
The “black gold” prices are rising after fall the day before. Currently, futures for the WTI crude oil are testing the $55.65 mark per barrel. At 20:00 (GMT+2:00), U.S. Baker Hughes Total Rig Count will be published.
Market Indicators
Yesterday, there was a variety of trends in the US stock market: #SPY (+0.11%), #DIA (-0.09%), #QQQ (+0.32%).
The 10-year US government bonds yield has not changed. At the moment, the indicator is at the level of 1.74-1.75%.
The Economic News Feed for 24.01.2020:
– German manufacturing PMI at 10:30 (GMT+2:00);
– Manufacturing PMI and Services PMI in the UK at 11:30 (GMT+2:00);
– Composite PMI in the UK at 11:30 (GMT+2:00);
– Core retail sales in Canada at 15:30 (GMT+2:00).
While the Bank of Canada rate decision on Wednesday left rates unchanged at 1.75%, the Canadian Dollar sold off sharply on a broad front.
The reason for that can be found in the dovish rhetoric in the BoC statement and the comments from BoC Governor Poloz stating that a rate cut was on the table, even though financial vulnerability concerns weighed against a cut.
As a result, swap markets started to price in a rate cut. Here expectation for the BoC March meeting went up from 6% to 27.5% and for the BoC meeting in April these speculations rose from 22% to 51%.
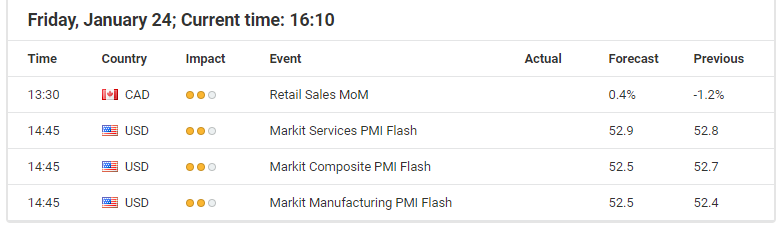
What was certainly also interesting was that BoC Governor Poloz had a quite big emphasis on data, particularly on consumer data. And with the Canadian Retail Sales number being due today at 1330 GMT, elevated volatility seems warranted.
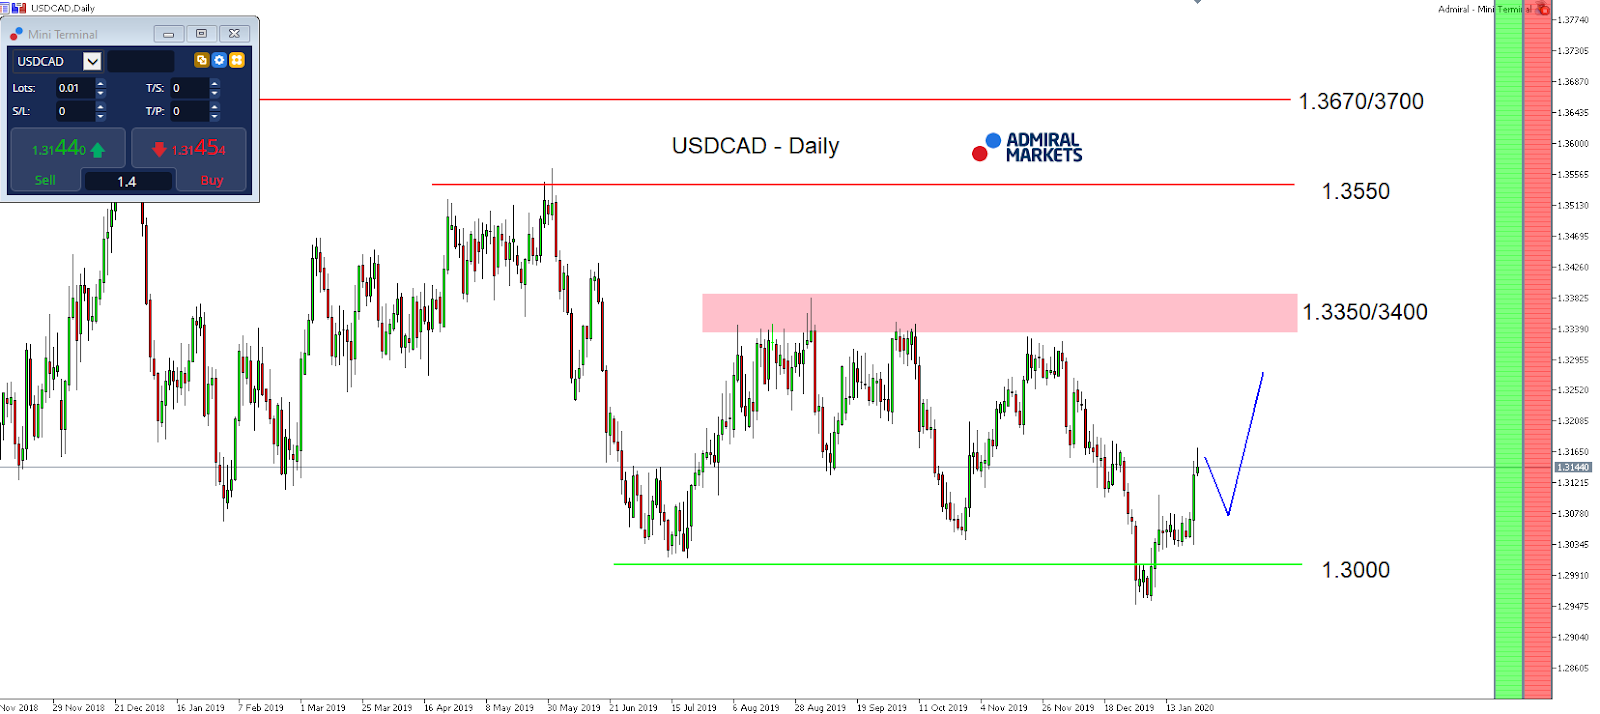
Any disappointment similar to last month when Retails Sales data for October came in at -1.2% (MoM), compared to the expected 0.0%, could trigger an acceleration of the current bullish move in the USDCAD on the upside and bringing the overall target around 1.3300/50 into our focus in the weeks to come.
On the other hand: any positive news is capable of resulting in a short-term bounce. But given the increasing likelihood of a rate cut from the BoC, we consider buying a dip against the region around 1.3050/3080 with the picture darkening only if we drop below 1.2950 to be interesting from a risk-reward perspective.
Source: Admiral Markets MT5 with MT5SE Add-on USDCAD Daily chart (between 07 November 2018 to 24 January 2020). Accessed: 24 January 2020 at 10:00 PM GMT
In 2015, the value of the USDCAD increased by 19.1%, in 2016 it fell by 2.9%, in 2017 it fell by 6.4%, in 2018 it increased by 8.4%, in 2019 it fell by 4.7% meaning that after five years, it was up by 11.7%.
Disclaimer: The given data provides additional information regarding all analysis, estimates, prognosis, forecasts or other similar assessments or information (hereinafter “Analysis”) published on the website of Admiral Markets. Before making any investment decisions please pay close attention to the following:
This is a marketing communication. The analysis is published for informative purposes only and are in no way to be construed as investment advice or recommendation. It has not been prepared in accordance with legal requirements designed to promote the independence of investment research, and that it is not subject to any prohibition on dealing ahead of the dissemination of investment research.
Any investment decision is made by each client alone whereas Admiral Markets shall not be responsible for any loss or damage arising from any such decision, whether or not based on the Analysis.
Each of the Analysis is prepared by an independent analyst (Jens Klatt, Professional Trader and Analyst, hereinafter “Author”) based on the Author’s personal estimations.
To ensure that the interests of the clients would be protected and objectivity of the Analysis would not be damaged Admiral Markets has established relevant internal procedures for prevention and management of conflicts of interest.
Whilst every reasonable effort is taken to ensure that all sources of the Analysis are reliable and that all information is presented, as much as possible, in an understandable, timely, precise and complete manner, Admiral Markets does not guarantee the accuracy or completeness of any information contained within the Analysis. The presented figures refer that refer to any past performance is not a reliable indicator of future results.
The contents of the Analysis should not be construed as an express or implied promise, guarantee or implication by Admiral Markets that the client shall profit from the strategies therein or that losses in connection therewith may or shall be limited.
Any kind of previous or modeled performance of financial instruments indicated within the Publication should not be construed as an express or implied promise, guarantee or implication by Admiral Markets for any future performance. The value of the financial instrument may both increase and decrease and the preservation of the asset value is not guaranteed.
The projections included in the Analysis may be subject to additional fees, taxes or other charges, depending on the subject of the Publication. The price list applicable to the services provided by Admiral Markets is publicly available from the website of Admiral Markets.
Leveraged products (including contracts for difference) are speculative in nature and may result in losses or profit. Before you start trading, you should make sure that you understand all the risks.
On Thursday, January 23, the euro was down at the close of trading. Bulls lost ground during the speeches at the ECB meeting, including one from ECB President Christine Lagarde. The EURUSD pair fell by 50 points, to 1.1036.
The ECB has left its key interest rates and incentive programs unchanged, with Lagarde commenting that the bank’s monetary policy will remain stimulating for an extended period of timre.
Today’s events (GMT+3):
From 11:15-12:30 PMI indexes in the manufacturing sector and services sectors in France, Germany, the Eurozone, and the UK are set to be published.
The price fall stopped at the 112th degree. The fall was sharp, and the rebound was weak. In this regard, today we may consider the continuation of the weakening of the euro against the US dollar to the 1.1014 mark.
Most euro cross pairs are trading in the red, so the fall could be sharp. The zone between the 112th and 135th degrees is a reversal, therefore, we think any decrease will be limited to 1.1014. Since the Stochastic Oscillator indicates oversold conditions, we are waiting for the downward wave to come in the American session. Additional pressure on risky assets comes from the latest news out of China concerning the mystery virus. Investors fear the rapid spread of the virus around the world.
Since the turn of the year, energy stocks have become a put owner’s dream–what with the energy sector virtually generating the worst returns of all US sectors.
And the harder you look, the worse it gets, making it nearly impossible to find value in this gridlocked mess.
One of the industry’s popular benchmarks, the SPDR S&P Oil & Gas Exploration ETF (XOP) has tanked 30% over the past year, badly underperforming the broader market all thanks to a perfect storm of supply and demand shocks coupled with slowing economies.
This comes to nobody’s surprise, considering that small-cap oil and gas stocks have higher leverage than large-caps. XOP invests in a lot of highly leveraged small-and mid-cap oil and gas companies in the exploration sector that tend to decline significantly on concerns about liquidity and debt repayments, but also bounce back quickly due to supply shocks like the Saudi Aramco drone attacks or, better still, a significant discovery.
Nothing quite tickles the fancy of energy investors like a giant oil or gas find.
But here’s the secret sauce: stocks of small-cap companies tend to enjoy serious leverage whenever they strike oil, whereas the heavyweights, well, not so much.
You don’t have to look very far for an example: shares of ExxonMobil Corp. (NYSE:XOM) are down more than 20% since the company announced a 14-strong string of good discoveries off the coast of Guyana in 2015, one of its best finds ever.
That’s because companies like Exxon have their fingers in too many pies, and their share prices depend on many variables. Junior explorers, however, tend to have a singular focus. You can buy them up for pennies, and when and if they strike oil, it’s a shareholder bonanza of big returns.
Granted, state-owned behemoths and giant energy companies tend to have more than their fair share of discoveries. But that does not in any way mean smaller companies have been missing out on the action–on the contrary, they have time and again showed up the big boys and earned their bragging rights in the arena, too.
Here are some of the biggest discoveries made or potential for discoveries that might be made by smaller oil and gas exploration companies:
#1 Biggest Oil Discovery in the Australian North West Shelf
For more than 15 years, oil exploration companies had been coming up empty in the once-fecund Australian North West Shelf. Nearly everybody had given up searching for liquids in the offshore block.
Quadrant and Carnarvon have emerged as some of the top wildcatters to watch in the region after uncovering a find containing some 171 million barrels of oil. You would have to go back to 1996 to find an oil discovery in the region above 100 million barrels.
Shares of Carnarvon ($555 million market cap) have jumped more than 150% since the discovery was announced, while Quadrant was acquired by Australian natural gas giant Santos Ltd (STOSF) in 2018.
Actually, these guys got lucky. The companies were prospecting for 545 bcf of gas but ended up with something far more valuable. After all, oil has a significantly lower risk profile than gas and does not require expensive infrastructure or gas contracts.
In other words, oil is both easier and faster to monetize than gas.
So, what are the expected pickings here?
Before the latest appraisal was carried out, Quadrant executive Fred Wehr had gushed:
“…the low case is solidly commercial, the mid-case is awesome and the upside is staggering.”
After the appraisal, Santos chief executive Kevin Gallagher revealed that the find was actually “bigger than expected”.
So, we can surmise that Quadrant thinks the find is awesome-to-staggering since it’s well above the base case estimate of 150 million barrels of oil.
#2 Namibia’s Eagle Ford
Reconnaissance Energy Africa (TSX-V: RECO, OTCMKTS:LGDOF) is the smallest of the three small-cap discoveries, with a market cap of only $39 million, with shares selling for under $0.80. Yet, it’s sitting on a shale basin that’s 25,000 square kilometers, similar in size to the Eagle Ford basin. Yes, that’s right: This tiny explorer just acquired a 90% exploration permit interest to the entire, 6.3-million-acre Kavango Basin in Namibia—Africa’s area which includes shale geology.
It’s quite unique for a company this small to have a basin this big, but while few have heard of the company, everyone in the business has heard of the geologist who examined the data on this basin. They’ve also heard of Recon’s CEO, Jay Park QC—the former director of Caracal Energy, which was acquired by giant Glencore in 2014 for $1.3 billion.
Bill Cathey is the geoscientist who looked at initial data. When the Company brought the magnetic survey data from Namibia’s Kavango Basin to Cathey, Cathey said the basis is a 30,000-foot sedimentary basin. He also said that all basins of this depth, anywhere else in the world, produce commercial hydrocarbons. Recon management dropped everything, so the story goes, got on a plane, and finalized the rights to the giant Kavango Basin.
So, now, tiny Reconnaissance is sitting on a basin similar in size to the Eagle Ford.
Reconnaissance has a 90% interest in a 4-year exploration license leading to a 25-year production license starting on commercial discovery.
The Kavango Basin is filled by the Karoo Supergroup of rocks, and it’s also been shown to have the same depositional environment as Shell’s Whitehill Permian shale play, part of the Karoo Supergroup to the south in South Africa.
Sproule–a tier 1 resource assessment company–estimated that Kavango has a potential 12 billion barrels of oil or 119 trillion cubic feet of natural gas. That’s just for the shale, not counting any conventional potential.
The first wells are slated to be drilled in Q2 2020.
Namibia is one of the most oil and gas production friendly governments in Africa. Ask Shell, or Exxon, both of whom are acquiring assets here, making Recon (TSX-V: RECO, OTCMKTS:LGDOF) a natural acquisition target if a commercial discovery is made.
#3 Mid-Tier Mania
Eco Atlantic Oil and Gas Company Ltd (CVE:EOG) is a $104-million Canadian explorer whose shares popped 160% in August following the announcement of back-to-back oil discoveries in the fabled Guyana-Suriname Basin, where Exxon has made 14 discoveries in a short time span.
Shares of Eco’s partner in Guyana, Tullow Oil Plc (LON:TLW) with a $1.03-billion market cap, have been less impressive after rallying 20% in the same period. Tullow is bigger and there’s less leverage from one new discovery.
Eco has reported that Tullow Oil-operated Joe-1 has struck high-quality oil in the sandstone reservoir in offshore Guyana in an area believed to extend from Exxon’s Stabroek acreage. The Joe-1 discovery came just a month after the two successfully drilled Jethro-1 giving encouraging hints that they are right on the money.
Although the companies are yet to conduct a detailed evaluation of the Orinduik, it’s estimated to hold some 3.98 billion barrels of prospective resources, thus giving Eco ~600mln barrels for its 15% stake in the project.
This, however, might be just the beginning of good tidings for Eco shareholders as the company has announced that it has ample resources to drill even more wells.
#4 – Oil Majors Are Choosing Investments More Carefully
Africa has long been a hotspot for oil and gas majors, but things have gotten rocky in recent years, especially in Nigeria.
Nigeria is home to about 37 billion barrels in oil reserves. And while it’s got some 32 active oil rigs out there, only 81 wells were completed last year – down from 141 in 2014.
Since oil prices started tumbling in 2014, the government has been shaking down oil companies, with back taxes and new legislation. Now, it wants majors Chevron, Shell and French Total SA to fork out around $62 billion. It claims in was short-changed under a revenue-sharing agreement dating back to the 1990s.
Chevron (NYSE:CVX) is seeking to sell several Nigerian oilfields, and it isn’t the first: Exxon (NYSE:XOM) and Shell (NYSE:RDS.A) have both been reducing their footprint in the country.
Now, Nigeria is proposing new legislation that would increase taxation on the oil industry. The bill would add another 3-10 percent in royalty rates at oil prices between $50 and $80 per barrel. Nigeria’s current system gives Nigeria between 60 percent and 70 percent of all deepwater revenues, which includes taxes, royalties, along with state-run NNPC’s share of production.
While Nigeria has given majors some pushback, other countries have been a bit more accommodating. Take Suriname, for instance. It is quickly becoming a hotspot for ambitious majors looking to leverage its massive reserves.
Total (NYSE:TOT) recently announced a major oil discovery offshore Suriname with its partner, Apache (NYSE:APA). John J. Christmann, Apache CEO and President noted, “The well proves a working hydrocarbon system in the first two play types within Block 58 and confirms our geologic model with oil and condensate in shallower zones and oil in deeper zones. Preliminary formation evaluation data indicates the potential for prolific oil wells.”
British Petroleum (NYSE:BP) is another major eyeing “off-the-beaten-path” opportunities in Africa. While BP has some oil assets in the region, it is focusing heavily on renewable power generation and natural gas production. Recently, it began work on a project in Mauritania and Senegal. The company noted, “We see this as the start of a new chapter for Africa’s energy story.”
**IMPORTANT! BY READING OUR CONTENT YOU EXPLICITLY AGREE TO THE FOLLOWING. PLEASE READ CAREFULLY**
Forward-Looking Statements. Statements contained in this document that are not historical facts are forward-looking statements that involve various risks and uncertainty affecting the business of Recon. All estimates and statements with respect to Recon’s operations, its plans and projections, oil prices, recoverable oil, production targets, production and other operating costs and likelihood of oil recoverability are forward-looking statements under applicable securities laws and necessarily involve risks and uncertainties including, without limitation: risks associated with oil and gas exploration, development, exploitation and production, geological risks, marketing and transportation, availability of adequate funding, volatility of commodity prices, imprecision of reserve and resource estimates, environmental risks, competition from other producers, government regulation, dates of commencement of production and changes in the regulatory and taxation environment. Actual results may vary materially from the information provided in this document, and there is no representation that the actual results realized in the future will be the same in whole or in part as those presented herein. Other factors that could cause actual results to differ from those contained in the forward-looking statements are also set forth in filings that Recon and its technical analysts have made, We undertake no obligation, except as otherwise required by law, to update these forward-looking statements except as required by law.
Exploration for hydrocarbons is a speculative venture necessarily involving substantial risk. Recon’s future success will depend on its ability to develop its current properties and on its ability to discover resources that are capable of commercial production. However, there is no assurance that Recon’s future exploration and development efforts will result in the discovery or development of commercial accumulations of oil and natural gas. In addition, even if hydrocarbons are discovered, the costs of extracting and delivering the hydrocarbons to market and variations in the market price may render uneconomic any discovered deposit. Geological conditions are variable and unpredictable. Even if production is commenced from a well, the quantity of hydrocarbons produced inevitably will decline over time, and production may be adversely affected or may have to be terminated altogether if Recon encounters unforeseen geological conditions. Adverse climatic conditions at such properties may also hinder Recon’s ability to carry on exploration or production activities continuously throughout any given year.
DISCLAIMERS
ADVERTISEMENT. This communication is not a recommendation to buy or sell securities. Oilprice.com, Advanced Media Solutions Ltd, and their owners, managers, employees, and assigns (collectively “the Company”) may in the future be paid by Recon to disseminate future communications if this communication proves effective. In this case the Company has not been paid for this article. But the potential for future compensation is a major conflict with our ability to be unbiased, more specifically:
This communication is for entertainment purposes only. Never invest purely based on our communication. We have not been compensated but may in the future be compensated to conduct investor awareness advertising and marketing for TSXV:RECO. Therefore, this communication should be viewed as a commercial advertisement only. We have not investigated the background of the company. Frequently companies profiled in our alerts experience a large increase in volume and share price during the course of investor awareness marketing, which often end as soon as the investor awareness marketing ceases. The information in our communications and on our website has not been independently verified and is not guaranteed to be correct.
SHARE OWNERSHIP. The owner of Oilprice.com owns shares of this featured company and therefore has an additional incentive to see the featured company’s stock perform well. The owner of Oilprice.com will not notify the market when it decides to buy more or sell shares of this issuer in the market. The owner of Oilprice.com will be buying and selling shares of this issuer for its own profit. This is why we stress that you conduct extensive due diligence as well as seek the advice of your financial advisor or a registered broker-dealer before investing in any securities.
NOT AN INVESTMENT ADVISOR. The Company is not registered or licensed by any governing body in any jurisdiction to give investing advice or provide investment recommendation. ALWAYS DO YOUR OWN RESEARCH and consult with a licensed investment professional before making an investment. This communication should not be used as a basis for making any investment.
PAST PERFORMANCE IS NOT INDICATIVE OF FUTURE RESULTS. Investing is inherently risky. Don’t trade with money you can’t afford to lose. This is neither a solicitation nor an offer to Buy/Sell securities. No representation is being made that any account will or is likely to achieve profits similar to those discussed.
Asian currencies and equities are offering a tepid response following news that the death toll from the coronavirus’ spread has climbed to 25, with new cases being reported in more countries, such as Vietnam and Singapore. The subdued trading volumes in the region ahead of the Lunar New Year festivities are likely preventing a more pronounced reaction in the markets.
Market participants perhaps can take heart from China’s efforts to lock down the epicenter of the outbreak by imposing travel curbs on seven cities, and the World Health Organization’s holding back from labelling the situation as a global health emergency. With several Asian markets seeing a holiday-shortened trading week ahead, investors will be hoping that the outbreak doesn’t worsen over the coming days. Still, regional markets could see an outsized reaction when trading resumes should pent-up concerns be unleased if the virus’ spread worsens drastically over the near-term.
However, any such reaction may eventually prove transitory, as long as the still-fragile expectations for a stabilising global economy in 2020 aren’t shattered. Once investors’ fears thin out, that could allow risk-on catalysts such as positive US corporate earnings or macroeconomic data to punch through meaningfully in the markets.
Gold, Yen offer muted reaction so far to coronavirus concerns
In a rather subdued response to the spread of the coronavirus, Gold and the Japanese Yen have seen limited moves over recent days. Bullion prices have refused to stray too far from the mid-$1500 range, while USDJPY appears content trading around the 109 to 110 range.
While not wanting to get too far ahead, fears over a potential pandemic are still supporting these safe haven assets. As the situation stabilises, investors may gradually eschew safe haven assets in favour of more risk-taking activities in the markets, which should prompt eventual softness in Gold and JPY.
Oil prices set to extend weekly losing streak
Unlike Gold and JPY, Oil traders apparently have fewer qualms offering a starker reaction to the viral outbreak. Brent crude dipped below the $62/bbl handle and is on course to mark three consecutive weeks of declines, while winding back most of its gains from December.
The price action of late highlights the notion that demand-side uncertainties are in the driver’s seat when dictating the overall mood in the Oil markets, with investors apparently more willing to brush aside supply-side risks, given recent geopolitical events involving Iran, Iraq, and Libya.
However, from a technical perspective, Brent futures are moving closer to oversold territory. Oil prices could see a rebound once the fears surrounding the coronavirus’ spread can begin retreating, allowing for global trade and travel conditions to stabilise, and by extension, prop up the world’s demand for Oil.
Disclaimer: The content in this article comprises personal opinions and should not be construed as containing personal and/or other investment advice and/or an offer of and/or solicitation for any transactions in financial instruments and/or a guarantee and/or prediction of future performance. ForexTime (FXTM), its affiliates, agents, directors, officers or employees do not guarantee the accuracy, validity, timeliness or completeness, of any information or data made available and assume no liability as to any loss arising from any investment based on the same.
US stock market had another choppy session on Thursday as investors worried about negative impact of coronavirus infection in China. The S&P 500 gained 0.1% to 3325.50. The Dow Jones industrial average extended losses 0.1% to 29160.09. Nasdaq composite index added 0.2% to 9402.48. The dollar weakening reversed as layoffs remained near a 50-year low though the number of people applying for first time jobless benefits rose by 6,000 to 211,000 last week: live dollar index data show the ICE US Dollar index, a measure of the dollar’s strength against a basket of six rival currencies, rose 0.2% to 97.67 and is higher currently. Futures on stock indexes point to higher openings today.
DAX led European indexes retreat after dovish ECB statement
European stocks extended losses on Thursday. Both the GBP/USD and EUR/USD reversed their climbing yesterday with Pound turning higher currently while euro lower still. The Stoxx Europe 600 index broadened it decline to 0.7% as European Central Bank (ECB) President Christine Lagarde’s said the risks for euro-zone economy were still “tiled to the downside.” The ECB held its interest rates steady Thursday and launched a strategic policy review to establish whether its inflation target is still appropriate. Germany’s DAX 30 fell 0.94% to 13388.42. France’s CAC 40 slid 0.65% while UK’s FTSE 100 lost 0.85% to 7507.67.
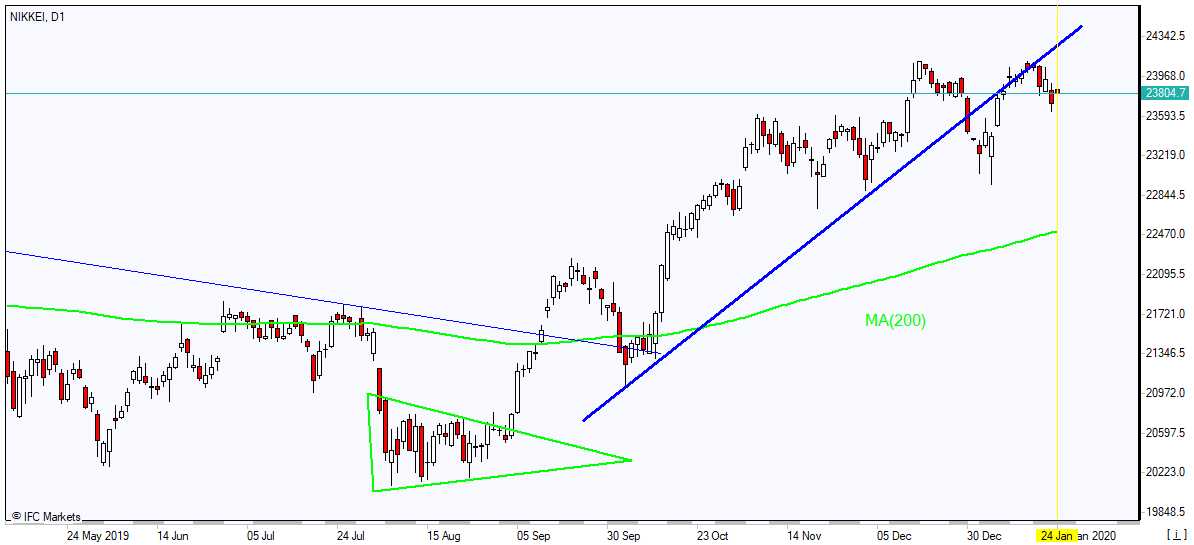
Nikkei leads Asian indexes recovery
Asian stock indices are mostly higher today. Nikkei ended up 0.1% at 23827.18 with yen little changed against dollar. Markets in China are closed ahead of the Lunar New Year starting Saturday. Hong Kong’s Hang Seng Index is 0.03% lower. Australia’s All Ordinaries Index recovered 0.04% with Australian dollar flat against the greenback.
Brent futures prices are rebounding today. Prices ended lower yesterday: March Brent crude lost 1.9% to $62.04 a barrel on Thursday. Energy Information Administration data revealed that US crude supplies fell by 400,000 barrels last week. The report was released a day later than usual because of Monday’s Martin Luther King Jr. holiday.
Gold down
Gold prices are retreating today. Prices rebounded on Thursday: February gold added 0.3% to $1561.70 an ounce.
Note: This overview has an informative and tutorial character and is published for free. All the data, included in the overview, are received from public sources, recognized as more or less reliable. Moreover, there is no guarantee that the indicated information is full and precise. Overviews are not updated. The whole information in each overview, including opinion, indicators, charts and anything else, is provided only for familiarization purposes and is not financial advice or а recommendation. The whole text and its any part, as well as the charts cannot be considered as an offer to make a deal with any asset. IFC Markets and its employees under any circumstances are not liable for any action taken by someone else during or after reading the overview.
By TheTechnicalTraders– Our research team caught a very interesting price pattern that correlates with the Put/Call ratio. We are alerting our friends and followers with this research post of this exciting, yet unconfirmed, set up today.
In late 2017, the US stock market rallied from July through December with moderately low volatility throughout this span of time. Near the end of 2017, the US stock market price activity stalled, then began a renewed price rally in early 2018 (see the first BLUE & YELLOW BOX on the chart below). Then, in January 2018, a very broad market reversion event took place which ultimately resulted in a very broad market correction in October through December 2018 of just over 20%.
The current price rally ending 2019 and starting 2020 is strangely similar to the price setup that occurred in 2017 and 2018. We’ve seen a broad “melt-up” price pattern over the last 5+ months of 2019 with moderately low volatility. We experienced a moderate price “stall” near the end of 2019 and experienced a broader renewed upside price rally in early 2020 (see the second BLUE and YELLOW BOX on the chart below). We believe this could be a setup for a potential price reversion event in the near future – all we need is confirmation of the downside price rotation to take place.
A deeper price reversion event at this price level that equals the previous reversion event would push the SPY price towards the $265 price level – a 68 point price drop. If such an event took place, we would be looking at a -15% to -25% potential price correction from current levels.
Let’s take a look at other charts and data that may confirm our research…
Weekly SPY (S&P 500) Index Chart – Jan 2018 and Jan 2020
Weekly VIX Chart
This Weekly VIX chart highlights the consolidation of volatility that set up in late 2017 and late 2019. Pay special attention to how broadly the VIX spiked in early 2018. This spike happened because of the consolidation of volatility near lower extremes over the past 16+ months. Given the recent volatility throughout 2018 and 2018, a downside price move of a similar range would likely propel the VIX to levels above 40~45. Price would need to collapse below our expected range in order for VIX to spike above 50. A move of this nature would suggest a downside price move beyond 25% to 30% – pushing the SPY below $240.
Again, our research team believes this is an unconfirmed price pattern setup. We want you to be aware of what we are seeing in the chart and be prepared if it confirms in the future.
Daily Put/Call Ratio Chart
Another interesting aspect of this setup is the correlation to the PUT/CALL ratio on the chart below. Every instance of the Put/Call ratio that fell below 0.80 for an extended period of time (2014, 2018 and now), prompted a downside price reversion of -10% to -15%. Additionally, each instance of this setup (2014 and 2018) prompted an extended period of price volatility and rotation.
In 2014, the initial downside price reversion prompted a -13% to -15% price correction followed by nearly 8 to 10 months of extended price rotation before finally entering a new bullish price trend in late 2016. Additionally, in 2018, the initial downside price reversion event wiped out nearly 12% of the value on the initial downside price move from this event. Subsequently, over the next 12+ months, a second downside price move wiped out over 20% of the value from the SPY.
The current setup suggests any potential downside price reversion resulting from this setup we are alerting you to could easily target -12% to -15% on an initial reversion event. Ultimately, the rest of 2020 could result in a very volatile year of price rotation if history teaches us anything.
Remember, this is not a confirmed trading trigger. This is a warning that a price and technical setup is occurring in the markets that may become of real value to you in the immediate future. The combination of these three charts, the SPY, the VIX and the PUT/CALL ratio, should be enough for you to understand there are real risks of a price reversion event setting up in the markets right now. All we need to confirm this setup would be for a broader market breakdown event to begin to take place. Then, we would watch what happens to the SPY near the $295 to $300 level.
Please pay attention to this setup as our researchers believe this could be a much bigger event than many people believe. Our research team believes a price reversion event is essential for the US stock market to continue to climb higher in 2020. Thus, some type of downside price move MUST happen before we can attempt any further upside price advancement.
As a technical analysis and trader since 1997 I have been through a few bull/bear market cycles, I have a good pulse on the market and timing key turning points for both short-term swing trading and long-term investment capital. The opportunities are massive/life-changing if handled properly.
Join my Wealth Building Newsletter if you like what you read here and ride my coattails as I navigate these financial markets and build wealth while others lose nearly everything they own.
NOTICE: Our free research does not constitute a trade recommendation or solicitation for our readers to take any action regarding this research. It is provided for educational purposes only. Our research team produces these research articles to share information with our followers/readers in an effort to try to keep you well informed. Visit our web site (www.thetechnicaltraders.com) to learn how to take advantage of our members-only research and trading signals.