By Hussein Sayed, Chief Market Strategist (Gulf & MENA), ForexTime
Global equities decline as coronavirus continues to spread
US earnings season in full swing with 145 S&P 500 companies announcing results
The Fed and BoE will conduct their first policy meetings of 2020
Global stocks continued to plunge on Monday after US equities experienced their worst week since August. The spike in the Volatility Index (VIX) on Friday is starting to reflect fears about the spread of the deadly coronavirus. It has already killed 80 people in China, infected more than 2,700 globally and is showing no signs of retreating. The latter issue is leading investors to sell risk assets and flee to safe havens.
Whether the market reaction to the coronavirus will be short-lived or extended further remains a guessing game for now. The bottom line is how much global economic output will be wiped out, and so far, no one knows the answer.
Many investors prefer to increase their cash allocation and overweight safe havens, such as Treasuries, Gold and the Japanese Yen, until we have a clear assessment on the degree of economic impact. However, if the mortality rate continues to rise with no cure to the virus, investors will move to panic mode, so expect to see further downside in risk assets. That’s why investors are advised to keep a close eye on the VIX index.
While the coronavirus is set to grab all the headlines, this week is shaping up to be a busy one on many fronts. Earnings season gets into full swing with 145 S&P 500 companies reporting results, central banks in the UK and US decide on monetary policy, President Trump’s impeachment trial enters its second week and key economic data are due to be released.
Earnings
Tech giants will be under the spotlight with Apple, Microsoft and Amazon among the names to be reporting results on Wednesday and Thursday. Those big tech firms contributed to a large chunk of the S&P 500 rally in 2019 with Apple rising 86%, Microsoft 55% and Amazon 23% last year. For these companies to sustain their upside momentum, we need to see not just earnings surprise to the upside, but upcoming quarters projections as well.
Exxon Mobil, Chevron, Facebook, Tesla, Pfizer, General Electric, Boeing, Caterpillar, and United Technologies are among the big firms reporting this week.
Central Banks Meetings
The Federal Reserve and Bank of England will be holding their first meetings of 2020. The Fed is widely expected to remain on hold when delivering its statement on Wednesday. We also anticipate very little changes to their economic projections. With a robust labour market and moderate inflation, we don’t expect to see any amendments to monetary policy in the near term. Market participants still need to know how long the Fed will remain on the sidelines, but the only answer they’re likely to receive is “we are data-dependent.”
However, the BoE’s rate decision is likely to be much more interesting with markets split 50/50 on whether we’ll see a rate cut on Thursday. MPC members have been talking up the case for lower rates so far this year, but the positive PMI releases last week will likely lead to more of a wait-and-see approach. Whatever the outcome from the meeting, expect to see volatility in the Pound.
Disclaimer: The content in this article comprises personal opinions and should not be construed as containing personal and/or other investment advice and/or an offer of and/or solicitation for any transactions in financial instruments and/or a guarantee and/or prediction of future performance. ForexTime (FXTM), its affiliates, agents, directors, officers or employees do not guarantee the accuracy, validity, timeliness or completeness, of any information or data made available and assume no liability as to any loss arising from any investment based on the same.
US stock market ended the week on down notes on Friday as the respiratory virus spread in China. The S&P 500 fell 0.9% to 3295.47, retreating 1.0% for the week. Dow Jones industrial slid 0.6% to 28989.73. The Nasdaq lost 0.9% to 9314.91. The dollar strengthening continued as Markit’s composite PMI reached a 10-month high reading for January. The live dollar index data show the ICE US Dollar index, a measure of the dollar’s strength against a basket of six rival currencies, rose 0.2% to 97.86 but is lower currently. Futures on stock indexes point to lower openings today.
European stock indexes rebounded
European stocks rebounded on Friday supported by positive data. Both GBP/USD and EUR/USD continued thier slide on Friday with euro turning higher currently and Pound lower still. The Stoxx Europe 600 Index recovered 9%. The DAX 30 gained 1.4% Friday to 13576.68 as both manufacturing and services PMIs beat expectations for January. France’s CAC 40 rose 0.9% and UK’s FTSE 100 advanced 1% to 7585.98 as the composite PMI returned to growth after recording a contraction for December.
Nikkei falls as China extends New Year holidays
Asian stock indices are down today with markets in China, Hong Kong, Australia and South Korea closed for holidays. Nikkei fell 2% to 23343.51 despite resumed yen slide against the dollar. China’s markets are closed while the end of New Year holidays were extended to Sunday from Thursday.
Brent futures prices are extending losses today. Prices fell on Friday as oil-field services firm Baker Hughes reported the number of US oil rigs rose by three this week to 676: Brent for March settlement fell 2.2% to $60.69 a barrel Friday. Saudi Aramco shares are down currently 0.4% to 34.15 riyals as they continue trading on country’s Tadawul exchange. Brand Finance’s annual global study ranked it the most valuable brand in the Middle East and North Africa, with a brand value of $46.8bn. Aramco was ranked 24th globally, and the second most valuable oil and gas brand, within striking distance of Shell.
Gold extends gains
Gold prices are extending gains after rising Friday. February gold gained 0.4% to 1571.30 on Friday.
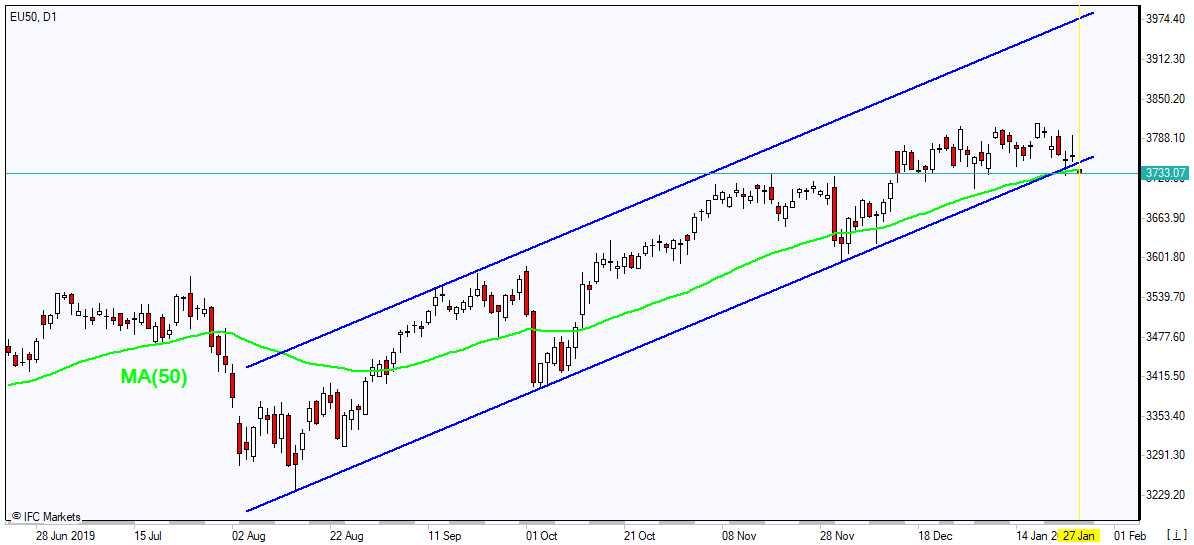
Note: This overview has an informative and tutorial character and is published for free. All the data, included in the overview, are received from public sources, recognized as more or less reliable. Moreover, there is no guarantee that the indicated information is full and precise. Overviews are not updated. The whole information in each overview, including opinion, indicators, charts and anything else, is provided only for familiarization purposes and is not financial advice or а recommendation. The whole text and its any part, as well as the charts cannot be considered as an offer to make a deal with any asset. IFC Markets and its employees under any circumstances are not liable for any action taken by someone else during or after reading the overview.
By Dmitriy Gurkovskiy, Chief Analyst at RoboForex – While the Chinese “2019-nCoV” virus is slowly spreading around the world, stock and currency markets are escaping risks and switching to “safe haven” assets. In this case, the American Dollar is the best choice.
However, in this case, demand is a bit overshadowed by rather mixed numbers from the USA published last Friday. For example, according to preliminary estimations, the Markit Manufacturing PMI dropped to 51.7 points in January after being 52.4 points the month before. On the other hand, the Markit Services PMI went from being 52.8 points in December to 53.2 points this month.
This week, the US Federal Reserve is scheduled to have its first meeting this year and expected to decide on its monetary policy. The key interest rate will apparently remain intact, but that’s not 100%. Investors will switch their attention to the regulator’s comments that will follow after the meeting is over.
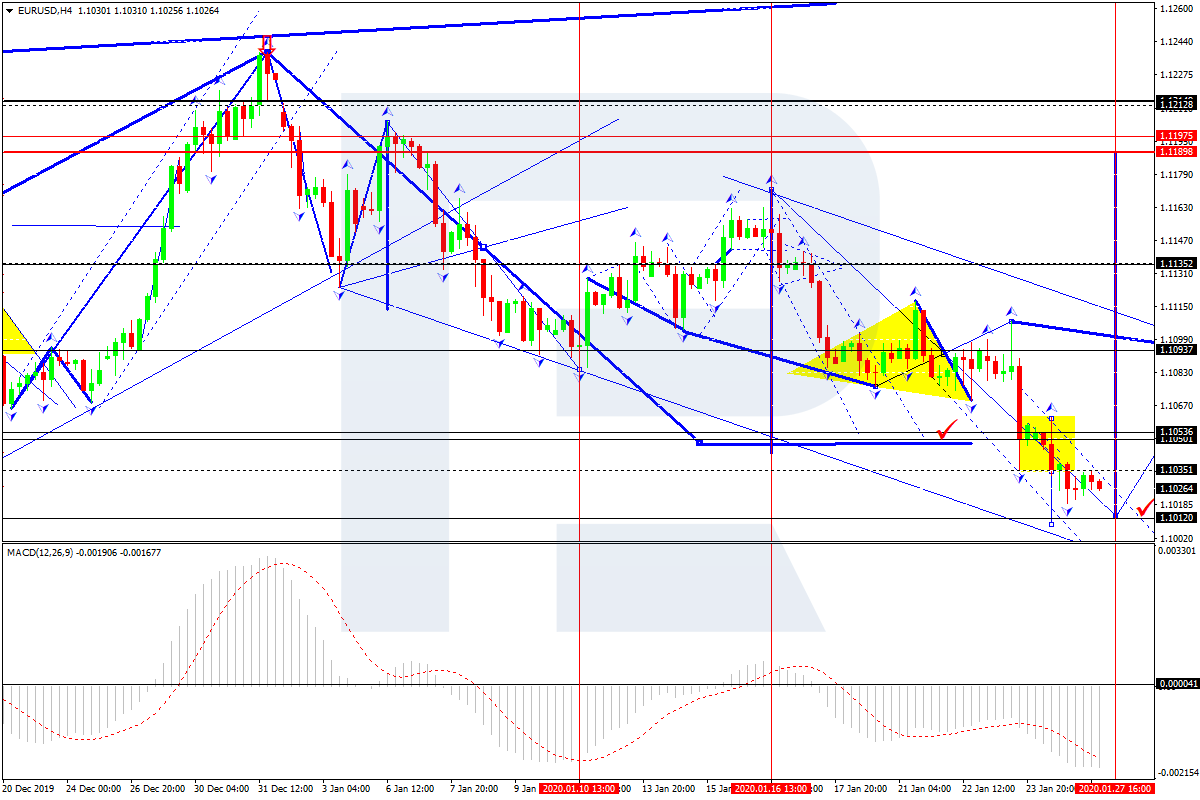
In the H4 chart, EUR/USD has reached its predicted downside target at 1.1055. Looking at the fifth descending wave, we may assume that the price may continue falling with the target at 1.1012. After forming another consolidation range around 1.1035, the pair has broken it downwards and many continue falling towards the above-mentioned target. Possibly, today the instrument may reach it and then form a reversal structure for a new correction towards 1.1094. From the technical point of view, this scenario is confirmed by MACD Oscillator: its signal line is moving below 0 inside the histogram area. The line is expected to leave the area and grow to break 0. After that, the instrument may boost its growth on the price chart.
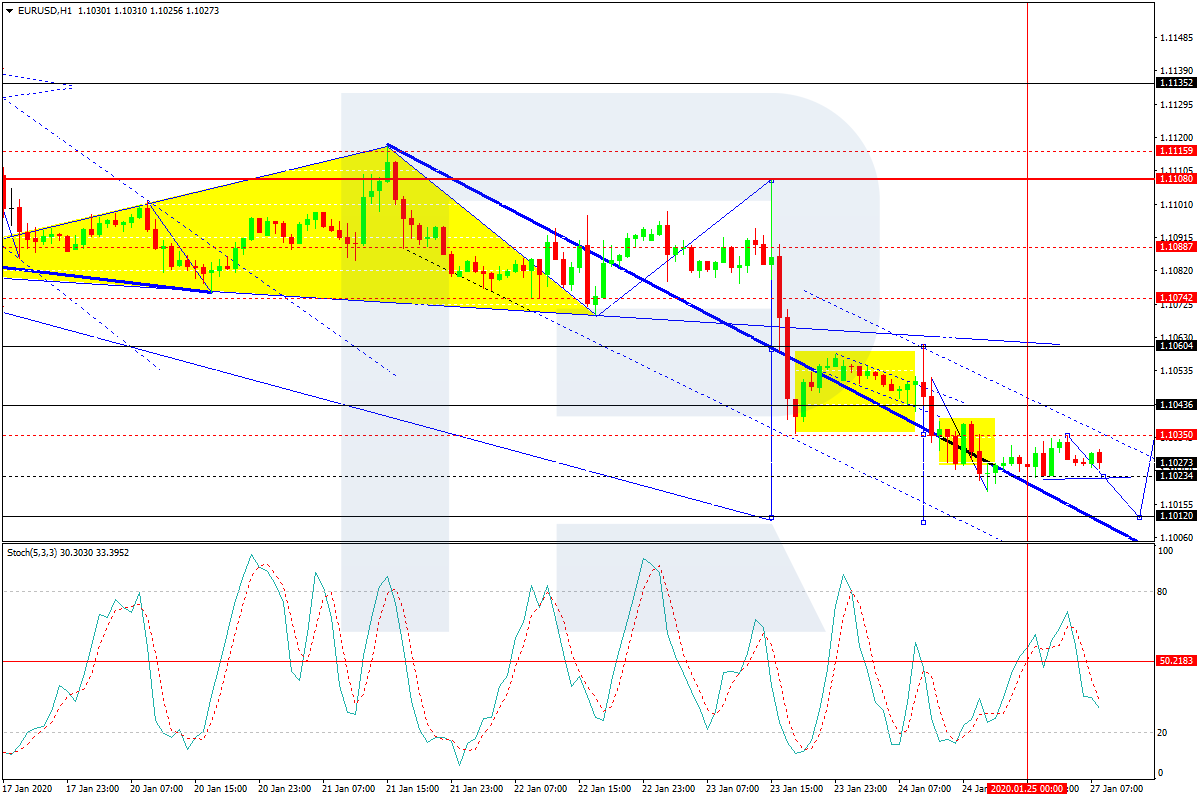
As we can see in the H1 chart, after breaking 1.1035, EUR/USD has reached 1.1019. Today, the pair may correct to test 1.1035 from below. Later, the market may start another decline towards 1.1012 and then form one more ascending structure with the first target at 1.1050. From the technical point of view, this scenario is confirmed by Stochastic Oscillator: its signal line is moving below 50 and may continue falling to reach 20. Later, the indicator may grow to return to 50. After this level is broken, the price may boost its growth on the price chart.
Disclaimer
Any predictions contained herein are based on the authors’ particular opinion. This analysis shall not be treated as trading advice. RoboForex shall not be held liable for the results of the trades arising from relying upon trading recommendations and reviews contained herein.
The global oil and gas industry is facing the “twin threats” of the loss of profitability and the loss of social acceptability as the climate crisis continues to worsen. The industry is not adequately responding to either of those threats, according to a new report from the International Energy Agency (IEA).
“Oil and gas companies have been proficient at delivering the fuels that form the bedrock of today’s energy system; the question that they now face is whether they can help deliver climate solutions,” the IEA said.
The report, whose publication was timed to coincide with the World Economic Forum in Davos, critiques the oil industry for not doing enough to plan for the transition. The IEA said that companies are spending only about 1 percent of their capex on anything outside of their core oil and gas strategy. Even the companies doing the most are only spending about 5 percent of their budgets on non-oil and gas investments.
There are some investments here and there into solar, or electric vehicle recharging infrastructure, but by and large the oil majors are doing very little to overhaul their businesses. The top companies only spent about $2 billion on solar, wind, biofuels and carbon capture last year.
Before even getting to the transition risk due to climate change, the oil industry was already facing questions about profitability. Over the past decade the free cash flow from operations at the five largest oil majors trailed the total sent to shareholders by about $200 billion. In other words, they cannot afford to finance their operations and also keep up obligations to shareholders. Something will have to change.
But, of course, as climate policy begins to tighten, oil demand growth will slow and level off. Most analysts say that it won’t require a big hit to demand in order for the financial havoc to really begin to devastate the balance sheets of the majors. Demand only needs to stop growing.
The IEA said there are things the industry can do right now – and should have done a long time ago. Roughly 15 percent of the energy sector’s total greenhouse gas emissions comes from upstream production. “Reducing methane leaks to the atmosphere is the single most important and cost-effective way for the industry to bring down these emissions,” the IEA said. But, the Permian is flaring more gas than ever, and methane leaks at every stage of the extraction and distribution process. Drillers have promises improvements, but the industry’s track record to date is not good.
Meanwhile, the IEA also noted that while attention is often focused on the oil majors, national oil companies (NOCs) account for more than half of global oil production. The majors only account for about 15 percent.
It is one thing for ExxonMobil or Chevron to face an existential crisis – which, absent an attempt to transition to a low-carbon business, they certainly do – but it’s an entirely different thing for the NOCs who will struggle to deal with the energy transition. The threat from the energy transition is not just to a specific business, but to whole governments and entire populations. “Some are high performing, but many are poorly positioned to adapt to changing global energy dynamics,” the IEA said. “None of the large NOCs have been charged by their host governments with leadership roles in renewables or other noncore areas.”
Ultimately, the report from the IEA should be worrying for the industry. The agency itself has faced criticism for not being more at the forefront of calling for a clean energy transition, and its forecasts for renewables have consistently undershot actual improvements for renewable technologies. The agency also continues to call for more upstream oil and gas investment. In other words, the IEA is somewhat conservative, and has been slow to recognize major shifts in the energy sector.
As such, the majors should probably take note when the IEA says something like “the transformation of the energy sector can happen without the oil and gas industry.” They can drag their feet, and will become increasingly ravaged by policy change and a deterioration in their core business. Or, they could proactively transform themselves, as the IEA says they should. Solutions to climate change “cannot be found within today’s oil and gas paradigm,” the agency said.
Peter Epstein of Epstein Research provides an update on a company with a lithium project in Arkansas.
This month, Standard Lithium Ltd. (SLL:TSX.V; STLHF:OTCQX) is targeted to switch on a relatively large-scale, proof-of-concept lithium extraction Demonstration Plant in southern Arkansas. If all goes reasonably as planned, it should take just a few months to prove the company’s proposed operational flow sheet. Then, management believes a final JV agreement with Lanxess Corp. will be signed.
CEO Robert Mintak commented,
“We’re making chemical products, not merely extracting a raw commodity. We’re doing sophisticated chemistry to produce a chemical that goes into batteries. It’s a high-end product.” GM [recently] announced they were going to build a $2.3 billion factory in Ohio to make lithium batteries. The industry is only going in one direction. We’re at the point where we’re going to be the U.S. hub for it. It’s the next energy revolution and El Dorado [Arkansas] will play a part in it .
.The key element is our growing partnership with German specialty chemicals giant Lanxess, a company with 73 chemical plants around the world employing tens of thousands. They have extensive and sophisticated sales networks to sell specialty chemical products. That’s a critical part of the whole story.”
Significant vote of confidence in Standard Lithium’s JV project
On October 30, Standard Lithium Ltd. (TSXV: SLL) (OTCQX: STLHF) obtained a C$5 million five-year loan, at just 3% interest from strategic partner Lanxess. The loan is convertible into 6,251,250 common shares, with 3,125,625 three-year warrants attached. The warrant strike price is C$1.20 (shares were at C$0.68 at the time of announcement). Please see the press release for further details.
These are very favorable terms; Standard effectively raised capital at a premium to market at a time when most lithium juniors can’t raise capital at all. The warrants were struck at a 76.5% premium to the October 30 share price. In the end, Lanxess will potentially own 6,251,250 + 3,125,625 = 9,376,875 shares in Standard Lithium, paying an average price of ~C$0.93.
Assuming the new warrants get exercised, the company would have roughly 97.5 million shares outstanding and would have raised a total of $8.75 millin. Therefore, the pro forma Enterprise Value (EV) [market cap + debt cash] with shares currently at C 0.91 is about C$82 million.
Compare that figure to Standard Lithium’s interest in the after-tax NPV of 30% x C$1.336 billion = C$400 million. Standard is trading at 20% of its 30% share of the after-tax NPV. Under certain circumstances, Standard’s interest in the project and its economics can be increased from 30% to up to 40%.
The loan represents another important milestone and clear vote of confidence in Standard Lithium, the JV project in southern Arkansas, and a very impressive management and technical teams led by Robert Mintak and Dr. Andy Robinson. For the past year, I’ve been saying that the company should be able to reach commercial production with fairly minimal equity dilution. This news is a meaningful step in the right direction.
If Lanxess is willing to invest today, at PEA-stage, with dismal lithium market sentiment, I imagine they might be willing to invest again in 2020 or 2021. That, or be a cornerstone order in future capital raises. This is on top of Lanxess’ expected commitment to line up 100% of project financing. Commercial production is expected to commence in 2022 with full phase 1 production of 9,700 tonnes Lithium Carbonate Equivalent (LCE)/year (2,910 tonnes LCE net to Standard) reached in 2023.
Use of proceeds will further advance the company’s Demonstration Plant (DP). When fully commissioned, the DP will continuously process an input “tail-brine” flow of ~50 gallons per minute. That’s an annualized production rate of 100150 tonnes of LCE. The DP is assembled on-site; commissioning started in December.
Above is a recent picture of the DP.
As can be seen, it’s a fairly significant structure. Notice the pick-up trucks on the left and the UFO in the upper left corner! The facility is purpose-built to be scaled-up to commercial design capacity of 9,700 tonnes LCE/year in phase 1 production, targeted to start in 2022, and be fully ramped up in 2023.
The DP showcases Standard’s proprietary LiSTR technology that uses a solid sorbent material to selectively extract lithium. The environmentally friendly process eliminates the need for evaporation ponds and reduces processing time from 1218 months to a matter of hours, while, at the same time, greatly increasing lithium recovery rates.
Although a run-rate of 100-150 tonnes LCE/year is not much by commercial standards, it’s impressive as far as pilot plants go. Finished lithium products will be used internally for testing, and, more importantly, will provide Lanxess proof of concept for its final investment decision.
Two years and C$20 million
Standard could now be just two years from initial production of lithium products. In addition, the amount of additional equity capital required to reach that critical point could be only C$20 million.
If true, the company is pretty far along in having meaningfully de-risked the project. Remember, funding is the #1 challenge these days facing battery metals juniors. Standard Lithium appears to have the funding piece of the puzzle largely in place.
As readers of my articles and interviews know, there are a number of lithium brine projects in Argentina and Chile. Several in Argentina were expected to reach first production in 2021 or 2022. On average, I estimate those projects have been pushed back 1824 months due to a lack of funding, and more recently, uncertainty around a critical presidential election (the less mining-friendly candidate won) and social unrest/protests in Chile.
Even more recently, a mid-December ruling by a Chilean environmental court upholding claims of excessive water use by SQM seriously threatens its expansion plans in 2020 and beyond.
Perhaps half of the projects on the drawing board, (PEA-stage or further advanced) 24 years ago are no longer serious contenders. By NOT falling behind, Standard has caught up to Lithium Triangle projects, and could be in production ahead of the pack. This is very important. The early-to-mid 2020s will be a very good time to be in production, a time when global demand for lithium could finally take off.
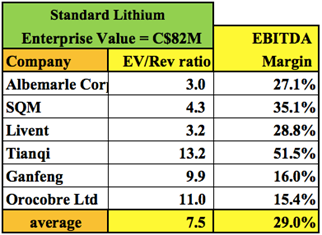
Lithium producers trading on average at 7.5x Revenue
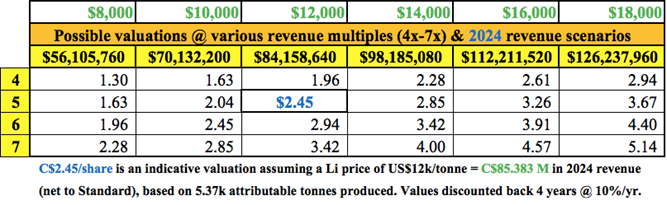
In the chart below, one can see that a sample of lithium producers is trading at an average EV to trailing 12-month revenue multiple of 7.5x. Eighteen months ago it was closer to 10x. Although Standard Lithium is not yet in production and will never be a giant like SQM or Albemarle, one can imagine what an indicative valuation might look like.
Readers should take note of EBITDA margins among producers, averaging 29%. Haircutting the assumed margin in Standard’s PEA by one-third to be conservative still results in a healthy 45% operating EBITDA margin.
How much revenue (net to Standard Lithium) might be possible upon achievement of phases 1 and 2? The chart below shows revenue scenarios for 2024 (after phases 1 and 2 are fully online). According to its spring 2019 prospectus filing, Standard will own at least 30% of project economics and perhaps up to 40%, depending on various factors that have not been made public.
In working on a broad, indicative valuation range, I assume 20 million shares get issued between now and year-end for a pro forma total of ~117,500,000. And, I discount indicative per-share valuations back 4 years at a 10%/year discount factor.
As can be seen, the range of per-share values is wide; from C$1.30 to C$5.14. I, of course, don’t know where the share price is headed, but using this chart for illustrative purposes makes me feel pretty good about the possibilities. Note, the current share price is C$0.91.
At a 5x EV/2024 revenue multipleon revenue from selling lithium @ US$12,000/tonnethe indicative per-share value discounted back four years is C$2.45.
Conclusion
Given that Standard Lithium’s (TSX-V:SLL) / (OTCQX:STLHF) JV project is well on its way to being fully funded with the technical and financial support of giant specialty chemicals conglomerate Lanxess, and given that a third-party PEA has demonstrated robust project economics, Standard Lithium is arguably more de-risked than the market is giving it credit for. Near-term catalysts, most notably the operation of the DP, will provide ongoing news flow.
In 202021 management will be tweaking the DP, sending out lithium product samples and working on a Pre-Feasibility Study. Market sentiment for lithium is at multi-year lows. Now might be a great time to be looking at lithium juniors, some of which could see a considerable bounce back in their share price along with lithium prices.
Peter Epstein is the founder of Epstein Research. His background is in company and financial analysis. He holds an MBA degree in financial analysis from New York University’s Stern School of Business.
Streetwise Reports Disclosure: 1) Peter Epstein’s disclosures are listed below. 2) The following companies mentioned in the article are billboard sponsors of Streetwise Reports: None. Click here for important disclosures about sponsor fees. The information provided above is for informational purposes only and is not a recommendation to buy or sell any security. 3) Statements and opinions expressed are the opinions of the author and not of Streetwise Reports or its officers. The author is wholly responsible for the validity of the statements. The author was not paid by Streetwise Reports for this article. Streetwise Reports was not paid by the author to publish or syndicate this article. Streetwise Reports requires contributing authors to disclose any shareholdings in, or economic relationships with, companies that they write about. Streetwise Reports relies upon the authors to accurately provide this information and Streetwise Reports has no means of verifying its accuracy.
4) The article does not constitute investment advice. Each reader is encouraged to consult with his or her individual financial professional and any action a reader takes as a result of information presented here is his or her own responsibility. By opening this page, each reader accepts and agrees to Streetwise Reports’ terms of use and full legal disclaimer. This article is not a solicitation for investment. Streetwise Reports does not render general or specific investment advice and the information on Streetwise Reports should not be considered a recommendation to buy or sell any security. Streetwise Reports does not endorse or recommend the business, products, services or securities of any company mentioned on Streetwise Reports. 5) From time to time, Streetwise Reports LLC and its directors, officers, employees or members of their families, as well as persons interviewed for articles and interviews on the site, may have a long or short position in securities mentioned. Directors, officers, employees or members of their immediate families are prohibited from making purchases and/or sales of those securities in the open market or otherwise from the time of the interview or the decision to write an article until three business days after the publication of the interview or article. The foregoing prohibition does not apply to articles that in substance only restate previously published company releases.
Disclosures: The content of this article is for information only. Readers fully understand and agree that nothing contained herein, written by Peter Epstein of Epstein Research [ER], (together, [ER]) about Standard Lithium, including but not limited to, commentary, opinions, views, assumptions, reported facts, calculations, etc. is not to be considered implicit or explicit investment advice. Nothing contained herein is a recommendation or solicitation to buy or sell any security. [ER] is not responsible under any circumstances for investment actions taken by the reader. [ER] has never been, and is not currently, a registered or licensed financial advisor or broker/dealer, investment advisor, stockbroker, trader, money manager, compliance or legal officer, and does not perform market making activities. [ER] is not directly employed by any company, group, organization, party or person. The shares of Standard Lithium are highly speculative, not suitable for all investors. Readers understand and agree that investments in small cap stocks can result in a 100% loss of invested funds. It is assumed and agreed upon by readers that they will consult with their own licensed or registered financial advisors before making any investment decisions.
At the time this interview was posted, Peter Epstein owned shares of Standard Lithium, and the Company was an advertiser on [ER].
Readers understand and agree that they must conduct their own due diligence above and beyond reading this article. While the author believes he’s diligent in screening out companies that, for any reasons whatsoever, are unattractive investment opportunities, he cannot guarantee that his efforts will (or have been) successful. [ER] is not responsible for any perceived, or actual, errors including, but not limited to, commentary, opinions, views, assumptions, reported facts & financial calculations, or for the completeness of this article or future content. [ER] is not expected or required to subsequently follow or cover events & news, or write about any particular company or topic. [ER] is not an expert in any company, industry sector or investment topic.
The Critical Investor provides an update on this explorer’s Indiana project in Chile.
Golden Arrow Resources Corp. (GRG:TSX.V; GARWF:OTCQB; G6A:FSE) recently came out with some pretty interesting news on its Indiana gold project in Chile. The company managed to amend the definitive agreement with the property owner, Mineria Activa (MSA), a Chilean private equity investment management firm focused on exploration to production-stage assets in mining. Golden Arrow now has the right to earn 100% of Indiana over a 74-month period, expiring in December 2024, and the total cost of US$15.1 million has not changed.
However, the payment of US$1 million due to the end of 2019 was reduced to US$150,000, and the subsequent payment of US$2 million due in one year is reduced to US$200,000. Another great advantage is moving US$7 million of the total US$15 million payment obligation for the 25% MSA interest during production after a production decision, meaning that MSA will be bearing execution risk now. This is obviously a great advantage to have as hard dollar commitments have been scaled back significantly this way, and that money can be spent at exploration.
I was interested in the fact that this agreement could be adjusted so considerably after a relatively short period of time, during what seems to be the first innings of a new precious bull market. After asking VP Exploration and Development Brian McEwen a number of questions about this, he had the following insights to share:
“Indiana is a narrow vein project with very good potential for expansion of resources, and when you include the possibility of adding ounces from surrounding prospects of very interesting targets. The difficulty in projects like this the cost of proving up resources. It is very expensive to drill it off to the required spacing to meet 43-101 standards. Given this point we went back to Mineria Activa (the vendor) and said we are willing to honor our total commitment to pay $15 million for the project, but with a different strategy of initially drilling off enough to prove up a feasible operation and then making the payments out of cash flow.
“At first they were not interested in this option as it means they need to accept some of the mining risk, which before they did not. We presented a staged plan with the possibility of obtaining a mining partner and said we would start right away with mobilizing a drill this month. Mineria Activa are reasonable partners and accepted the proposal. This is all very good for GRG as we now have two years to prove up a workable plan requiring minimal vendor payments. We also now earn 100% of the project, where before Mineria Activa had the option to maintain a 25% interest.”
On my follow up question of what really changed, as the needed dense grid spacing was probably apparent from the start, both for GRG and the vendor, Brian answered:
“We went back to square one with the drill hole data and questioned some of the interpretations, mostly this had to do with the size and extent of the high-grade ore shoots. This needs to be tested. At the same time, we had the idea that if we can delineate high-grade ore shoots with enough certainty, why not start to mine them and create cash flow. If we can do this, we can pay the vendor without having to raise money in the market. At the same time, we can be expanding our resources in the area. This idea of mining first, pay second was presented to Mineria Activa and after a period of negotiations, we came up with a new deal.”
So, it probably boiled down to the fact that geologists can only do so much due diligence for an agreement, and when an exploration program is being set up, they go much deeper into the available data, and can run into unexpected conclusions. After this I asked Brian if he has a good idea of staging in their new plan for Indiana now. He stated:
“Staging now is:
Define high grade tonnage in ore shoots through initial 2,500m program for approximately 160K ounces<
Test resource potential to support a 400tpd operation for an extended period
Complete engineering studies to show feasibility of plan
Find a local partner, with proven mining experience (talking to several groups now)
Construction
Mining
Pay vendor out of cash flow
Continue to grow resource/reserve”
This fits in nicely with the company’s originally stated plans: a minimum 2,500 meter drill program in 2020 and a further minimum 2,500 meter drill program and commencement of preliminary engineering studies before the end of 2021. The company will commence a 2,500 meter drill program in the first quarter of this year to confirm and further delineate high-grade mineralization prior to planning additional drilling and commencing engineering studies. First results are expected sometime early in Q2.
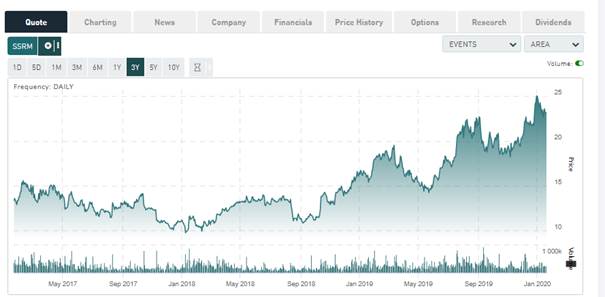
The company still has 1.045 million shares of SSR Mining (SSRM.TO), worth C$24.22 million at the moment (January 20, 2020), after having sold 200,000 shares of the original 1,245,580 shares received from SSR Mining as part compensation for the sale of the 25% interest in the Puna operation. The four-month hold period for the SSR shares ended at January 18, 2020, so the company probably sold the 200k shares as soon as possible. The sale netted the company C$4.5 million, which means Golden Arrow has about C$5 million in the treasury at the moment, and is fully funded for their 2020 exploration programs. According to management, the company has sufficient cash and cash equivalents to be able to take the Indiana project to PFS stage, and a market financing would only be considered if Golden Arrow shares were trading considerably higher.
When looking at the chart of SSR Mining, it can be seen why these shares are a great and liquid asset to have, as the company is performing very well and is profiting perfectly of the increasing precious metals prices for the last six months:
Share price SSRM.TO; 3 year time frame (Source tmxmoney.com)
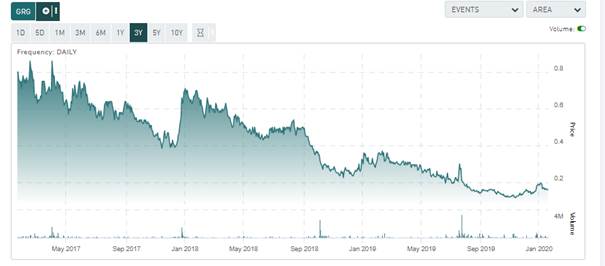
Golden Arrow has been trading the other way around, as its hands were tied most of 2019 and the timing of the much discussed, forced sale of Puna couldn’t have been more unfortunate, but this is all behind us now, and Golden Arrow seems to have bottomed now:
Share price GRG.V; 3 year time frame (Source tmxmoney.com)
The company has, of course, more projects than just the Indiana project, and I was wondering if more information has become available at this moment. Not so much, according to management, regarding the Tierra Dorada project; the upcoming drill program is slated to start in Q2.
The Flecha de Oro project in Argentina has surface mapping and sampling underway and will be followed by detailed mapping and trenching in Q1/Q2. Further results will be announced in Q1.
Conclusion
I view the renegotiation of the Indiana Project deal as a very important one, as upcoming obligations in the first two years are limited to a minimum, but on the other hand the company gets a realistic opportunity to retain a 100% ownership of a very interesting project going into production. As the company is fully funded and still has about C$24 million in SSR Mining shares, which is a very good operator in my view and has exceptional leverage to rising precious metal prices, they don’t have to worry about cash now for a very long time. Together with its other exploration programs going on in Paraguay and Chile, Golden Arrow seems to be fully recovered and ready to profit from a potential new precious metals bull market.
I hope you will find this article interesting and useful, and will have further interest in my upcoming articles on mining. To never miss a thing, please subscribe to my free newsletter on my website, http://www.criticalinvestor.eu in order to get an email notice of my new articles soon after they are published.
The Critical Investor is a newsletter and comprehensive junior mining platform, providing analysis, blog and newsfeed and all sorts of information about junior mining. The editor is an avid and critical junior mining stock investor from The Netherlands, with an MSc background in construction/project management. Number cruncher at project economics, looking for high quality companies, mostly growth/turnaround/catalyst-driven to avoid too much dependence/influence of long-term commodity pricing/market sentiments, and often looking for long-term deep value. Getting burned in the past himself at junior mining investments by following overly positive sources that more often than not avoided to mention (hidden) risks or critical flaws, The Critical Investor learned his lesson well, and goes a few steps further ever since, providing a fresh, more in-depth, and critical vision on things, hence the name.
Disclaimer: The author is not a registered investment advisor, currently has a long position in this stock, and Golden Arrow Resources is a sponsoring company. All facts are to be checked by the reader. For more information go to www.goldenarrowresources.com and read the companys profile and official documents on www.sedar.com, also for important risk disclosures. This article is provided for information purposes only, and is not intended to be investment advice of any kind, and all readers are encouraged to do their own due diligence, and talk to their own licensed investment advisors prior to making any investment decisions.
Streetwise Reports Disclosure: 1) The Critical Investor’s disclosures are listed above. 2) The following companies mentioned in the article are sponsors of Streetwise Reports: None. Click here for important disclosures about sponsor fees. The information provided above is for informational purposes only and is not a recommendation to buy or sell any security. 3) Statements and opinions expressed are the opinions of the author and not of Streetwise Reports or its officers. The author is wholly responsible for the validity of the statements. The author was not paid by Streetwise Reports for this article. Streetwise Reports was not paid by the author to publish or syndicate this article. Streetwise Reports requires contributing authors to disclose any shareholdings in, or economic relationships with, companies that they write about. Streetwise Reports relies upon the authors to accurately provide this information and Streetwise Reports has no means of verifying its accuracy.
4) The article does not constitute investment advice. Each reader is encouraged to consult with his or her individual financial professional and any action a reader takes as a result of information presented here is his or her own responsibility. By opening this page, each reader accepts and agrees to Streetwise Reports’ terms of use and full legal disclaimer. This article is not a solicitation for investment. Streetwise Reports does not render general or specific investment advice and the information on Streetwise Reports should not be considered a recommendation to buy or sell any security. Streetwise Reports does not endorse or recommend the business, products, services or securities of any company mentioned on Streetwise Reports. 5) From time to time, Streetwise Reports LLC and its directors, officers, employees or members of their families, as well as persons interviewed for articles and interviews on the site, may have a long or short position in securities mentioned. Directors, officers, employees or members of their immediate families are prohibited from making purchases and/or sales of those securities in the open market or otherwise from the time of the interview or the decision to write an article until three business days after the publication of the interview or article. The foregoing prohibition does not apply to articles that in substance only restate previously published company releases. As of the date of this article, officers and/or employees of Streetwise Reports LLC (including members of their household) own shares of Golden Arrow Resources, a company mentioned in this article.
Andy Schectman of Miles Franklin Precious Metals Investments and Maurice Jackson of Proven and Probable discuss investment strategies centered on precious metals ratios.
Always a pleasure to have you on the program to discuss the value proposition before us in precious metals. Today we will identify three exciting value propositions for your precious metals portfolio that are currently selling at a deep, deep discount.
Mr. Schectman, you have a proven pedigree of success in the precious metals space. I want to discuss a methodology that has made you and the clients of Miles Franklin very handsome returns over the years, and that is your use of ratios. Sir, please explain why it is paramount for precious metals investors to have a thorough understanding on precious metals ratios.
Andy Schectman: When we last spoke I shared that legendary investor Rick Rule is fond of saying, “the deal’s in rhetoric,” and he deals in arithmetic. I like to look at the world the exact same way, from the standpoint of arithmetic, and at least in terms of any precious metals investor, ratios are very, very, very important in mathematics. They are another way of saying the law of averages. As we look at ratios that fall out of historical average, they represent opportunitiesin fact, distinct opportunities. I guess the easy way of saying that is the farther away you get from long-term established averages, the greater the magnetism that pulls you back to the average.
I’m here in Minneapolis, where the high today may be 2025 degrees. If I woke up this morning and it was 85 degrees in the middle of the winter, I wouldn’t rush to pull out my lawn furniture and assume that spring has come early. It’s an aberration, it’s an anomaly. When I look back at what has made me successful over the years, in many respects the ability to identify and exploit price anomalies or averages or ratios has really been at the very forefront of my success. It’s something that I’m keenly aware of and like to share as often as possible.
Maurice Jackson: Speaking of opportunities and anomalies, let’s discuss our first value proposition, and that is gold. Andy, please introduce the Dow-Gold ratio.
Andy Schectman: Historically, when the Dow can be bought for five ounces of gold, we buy stocks and sell gold. When it takes over 15 ounces to buy the Dow, you sell stocks and buy gold. Bill Bonner, who’s a very smart man, has a chart [and] he’s been tracking this for the last hundred years. Had you followed that pattern over the last hundred years, there would have been six possible trades that you could have made and you would have won on every single one of them. I guess as a rule of thumb, 15 or higher you sell the Dow, you buy gold. Five or lower, you do the opposite.
I would argue, however, that due to the manipulation of the price of gold and the easy currency by the Federal Reserve that has found its way into inflation of asset prices, that these ratios are even more skewed than they should be. They are artificially positioned, and so like the rubber band being stretched or a spring being stretched, when it pops it will pop significantly more because both prices have been artificially positioned, that of gold and arguably of the Dow, [which is] at all-time highs based upon every single metric.
At this point right now with the ratio much higher than 15:1closer to 19:1the idea would be to sell the Dow and to buy gold, absolutely. I could make the strong argument that the Dow is strongly overvalued based upon metrics. It still may go higher, but based upon historical metrics, the Dow is overvalued, and based upon historical metrics, you could argue that gold is significantly undervalued, making this a no-brainer trade, actually.
Maurice Jackson: Now that we understand the virtues of knowing the Dow-Gold ratio, let’s look at another value proposition, and that is silver. Andy, please introduce the gold-silver ratio.
Andy Schectman: Geologically, the silver-gold ratio is 15.5:1, meaning geologically, what comes out of the ground is 15.5 times silver, more abundant than gold. For the last hundred-plus years, that ratio has been about 42:1 on average. If you listen to some people in the industry who are at the forefront of it, like Keith Neumeyer, the CEO of First Majestic Silver Corp. (FR:TSX; AG:NYSE; FMV:FSE), he’s publicly said that what they see coming out of the ground is closer to 9:1.
In the respect that silver is found in nature in what is called epithermal [deposits, which] means that it is very close to the surface, most of the big deposits of silver have been found long, long ago, and 65% of what is mined today in silver comes from byproduct mining of other metals. It’s a situation where you could argue that what’s coming out of the ground right now is far less than what has historically been expected to come out of the ground. In other words, 9:1 might even be more than what we see coming out of the ground. In any case, a ratio right now of 86:1 or thereabouts is an anomaly. It’s only happened a few times in the last 150 years.
The last time we saw it was in 2010. We saw a ratio of 80:1. Within one year in 2011, you had gold at nearly $2,000 and silver at $50. That’s 40:1. The historical average going back literally over 150 years is 42:1, so at this point right now, at 86:1, a strong, strong argument could be made for temporarily trading your gold into silver. What I mean by temporarily is we sell the gold and buy silver. When the ratio normalizes, you trade back into gold and you double the amount of gold you started with without spending a penny. Here again, a ratio of 86:1 is like waking up in Minneapolis in January to find 85-degree weather. It just doesn’t happen, and if it does it’s an anomaly.
Maurice Jackson: Let’s discuss value proposition number three, and it’s probably my favorite, and that is platinum. Andy, please introduce the gold-platinum ratio.
Andy Schectman: When I think of platinum, first of all, platinum is about 30 more times rare than gold. I don’t know exactly how many more times more rare, but it’s significantly more rare than gold, and forever, platinum is traded at a higher price than gold. In fact, I can rememberI think it was around 2008, with gold around $800 and platinum north of $2,000it was three times the price of gold. But [for] the first 20-plus years of my career, 25 yearsgoing back 50 years [from] thatplatinum always traded at a premium to gold, sometimes a hundred bucks, sometimes double, sometimes triple, but always a premium.
The fact that it’s trading at a discount to gold right now is another anomaly, just as the platinum-palladium ratio is an anomaly.
I think at this point the argument would be to sell gold and buy platinum, obviously, because it is so far out of whack. There are reasons, [and] a lot of it has to do with Dieselgatethe fact that. . .typically, unleaded catalytic converters are made of palladium, and for diesel, of platinum. With the push to get diesel fuel vehicles off the road due to emissions, platinum has suffered. That is the easy answer.
I don’t know if it’s deeper than that or not, but simply. . .the ratio is way out of whack, and [for] the 30 years I’ve done this, 28 and a half or 29 of those years it would have cost you more money to buy platinum than it would to buy gold.
The fact that we have that ratio upside down right nowa 1:6 ratioit’s an anomaly. It’s 85 degrees in the middle of January in Minneapolis. These are true value propositions, true anomalies when referenced with historical averages.
Maurice Jackson: Now, Andy, we didn’t reference palladium or rhodium, and that was, again, because of the ratios. Is that correct?
Andy Schectman: That’s exactly correct. Yes, absolutely.
Maurice Jackson: Now, if somebody wants to take advantage of the buying opportunities in gold, silver and platinum, what’s the process?
Andy Schectman: Sure. It’s as simple as giving either Miles Franklin a call, giving Maurice a call, myself a call. Any of us here at Miles Franklin are happy to assist, and we start by answering questions. We prefer to do things the old-fashioned way. With the threat of identity theft and cyber threats, we have decided to really take this offline, do things the old-fashioned way, answer questions and give personal service to any of our clients, starting with answering questions first. If we do a good job at answering your questions, then hopefully we get to the point of transacting business.
As far as placing an order is concerned, it couldn’t be easier. We decide what you want, we lock in the order on a verbal handshake. An invoice is then e-mailed to the client; overnighted if they prefer by Federal Express. Once the invoice is paid for, I wire a check. Everything is sent by UPS, insured overnight or three-day. If it’s silver, typically for free. It’s pretty much that simple.
Maurice Jackson: That is registered mail, is that correct?
Andy Schectman: Yes, sir, that is correct, or UPS insured. Either one.
Maurice Jackson: Mr. Schectman, for someone listening that wants to get more information regarding Miles Franklin, please share the contact details.
Andy Schectman: The website is Miles Franklin Precious Metals Investments, where they can sign up for our free daily newsletter. I can be reached at [email protected], and my number is 1 (800) 255-1129. Our main number is 1 (800) 822-8080.
Maurice Jackson: As a reminder, I’m a proud licensed representative for Miles Franklin Precious Metals Investments, where we provide a number of options to expand your precious metals portfolio, from physical delivery, offshore depositories, precious metal IRAs, and private blockchain-distributed ledger technology. Call me directly at (855) 505-1900, or you may e-mail [email protected].
Finally, we invite you to subscribe to www.provenandprobable.com, where we provide mining insights and bullion sales.
Mr. Schectman, thank you for joining us today on Proven and Probable.
Maurice Jackson is the founder of Proven and Probable, a site that aims to enrich its subscribers through education in precious metals and junior mining companies that will enrich the world.
Disclosure: 1) Statements and opinions expressed are the opinions of Maurice Jackson and not of Streetwise Reports or its officers. Maurice Jackson is wholly responsible for the validity of the statements. Streetwise Reports was not involved in the content preparation. Maurice Jackson was not paid by Streetwise Reports LLC for this article. Streetwise Reports was not paid by the author to publish or syndicate this article. 2) This article does not constitute investment advice. Each reader is encouraged to consult with his or her individual financial professional and any action a reader takes as a result of information presented here is his or her own responsibility. By opening this page, each reader accepts and agrees to Streetwise Reports’ terms of use and full legal disclaimer. This article is not a solicitation for investment. Streetwise Reports does not render general or specific investment advice and the information on Streetwise Reports should not be considered a recommendation to buy or sell any security. Streetwise Reports does not endorse or recommend the business, products, services or securities of any company mentioned on Streetwise Reports. 3) From time to time, Streetwise Reports LLC and its directors, officers, employees or members of their families, as well as persons interviewed for articles and interviews on the site, may have a long or short position in securities mentioned. Directors, officers, employees or members of their immediate families are prohibited from making purchases and/or sales of those securities in the open market or otherwise from the time of the interview or the decision to write an article until three business days after the publication of the interview or article. The foregoing prohibition does not apply to articles that in substance only restate previously published company releases.
Proven and Probable LLC receives financial compensation from its sponsors. The compensation is used is to fund both sponsor-specific activities and general report activities, website, and general and administrative costs. Sponsor-specific activities may include aggregating content and publishing that content on the Proven and Probable website, creating and maintaining company landing pages, interviewing key management, posting a banner/billboard, and/or issuing press releases. The fees also cover the costs for Proven and Probable to publish sector-specific information on our site, and also to create content by interviewing experts in the sector. Monthly sponsorship fees range from $1,000 to $4,000 per month. Proven and Probable LLC does accept stock for payment of sponsorship fees. Sponsor pages may be considered advertising for the purposes of 18 U.S.C. 1734.
The Information presented in Proven and Probable is provided for educational and informational purposes only, without any express or implied warranty of any kind, including warranties of accuracy, completeness, or fitness for any particular purpose. The Information contained in or provided from or through this forum is not intended to be and does not constitute financial advice, investment advice, trading advice or any other advice. The Information on this forum and provided from or through this forum is general in nature and is not specific to you the User or anyone else. You should not make any decision, financial, investments, trading or otherwise, based on any of the information presented on this forum without undertaking independent due diligence and consultation with a professional broker or competent financial advisor. You understand that you are using any and all Information available on or through this forum at your own risk.
Molecular diagnostics company Co-Diagnostics’ shares opened more than 144% higher after the firm reported it has designed a test for virus detection of the new coronavirus, 2019-nCoV, using its CoPrimer platform.
In the wake of widespread news and worldwide concerns regarding efforts to contain the spread of the latest strain of the coronavirus, Salt Lake City, Utah-based molecular diagnostics company Co-Diagnostics Inc. (CODX:NASDAQ), today announced that “it has completed principle design work for a PCR screening test for new coronavirus, 2019-nCoV, intended to address potential need for detection of the virus.”
The company indicated that following the guidelines published by the World Health Organization (WHO) and Centers for Disease Control (CDC), the new test was designed using its proprietary software system featuring the firm’s patented CoPrimer technology.
The firm advised that “an outbreak of respiratory illness caused by the pneumonia-like 2019-nCoV has spread rapidly over the past two weeks, after first being discovered in the Chinese city of Wuhan on December 31, 2019.” Subsequently, Chinese officials confirmed human-to-human transmission of the virus on January 20, 2020, and have implemented a soft quarantine effectively placed on Wuhan, warning people not to travel to or from the city. Wuhan has a population of approximately 11 million and is located along the Yangtze River about 500 miles due west of Shanghai.
The company’s CEO Dwight Egan commented, “There are several challenges to developing a test for a virus so relatively new on the world stage, especially one with many closely related genetic cousins such as SARS and MERS. One of the most important advantages of our CoPrimer platform is its ability to reliably and accurately differentiate between similar genetic sequences, in order to reduce the likelihood of a false positive diagnosis. With a situation currently unfolding where at least 17 deaths have already been reported among the hundreds infected, it is vital that healthcare professionals have access to the highest-quality diagnostic tools available, to be able to provide prompt and accurate diagnoses…We believe that if the WHO takes the step of declaring the illness a global health emergency following collection of more data in the days and weeks to come, Co-Diagnostics will be well positioned to quickly assist in providing these state of the art tools to affected countries.”
Co-Diagnostics is a molecular diagnostics firm headquartered in Salt Lake City, Utah, that “develops, manufactures and markets new, state-of-the-art diagnostics technology”. The company employs its innovative molecular tools for detection of infectious diseases, liquid biopsies for cancer screening and agricultural applications. The firm’s technology is “utilized for tests that are designed using the detection and/or analysis of nucleic acid molecules (DNA or RNA).” In addition, Co-Diagnostics creates and licenses specific tests in order to locate genetic markers for use in other applications and industries besides infectious diseases.
Co-Diagnostics started the day with a market capitalization of around $19.6 million with approximately 17.34 million shares outstanding and a short interest of about 3.4%. CODX shares opened greater than 140% higher today at $2.76 (+$1.63, +144.25%) over yesterday’s $1.13 closing price. The stock has traded today between $1.88 and $2.80 per share and is currently trading at $2.20 (+$1.07, +94.69%).
Disclosure: 1) Stephen Hytha compiled this article for Streetwise Reports LLC and provides services to Streetwise Reports as an independent contractor. He or members of his household own securities of the following companies mentioned in the article: None. He or members of his household are paid by the following companies mentioned in this article: None. 2) The following companies mentioned in this article are billboard sponsors of Streetwise Reports: None. Click here for important disclosures about sponsor fees. 3) Comments and opinions expressed are those of the specific experts and not of Streetwise Reports or its officers. The information provided above is for informational purposes only and is not a recommendation to buy or sell any security. 4) The article does not constitute investment advice. Each reader is encouraged to consult with his or her individual financial professional and any action a reader takes as a result of information presented here is his or her own responsibility. By opening this page, each reader accepts and agrees to Streetwise Reports’ terms of use and full legal disclaimer. This article is not a solicitation for investment. Streetwise Reports does not render general or specific investment advice and the information on Streetwise Reports should not be considered a recommendation to buy or sell any security. Streetwise Reports does not endorse or recommend the business, products, services or securities of any company mentioned on Streetwise Reports. 5) From time to time, Streetwise Reports LLC and its directors, officers, employees or members of their families, as well as persons interviewed for articles and interviews on the site, may have a long or short position in securities mentioned. Directors, officers, employees or members of their immediate families are prohibited from making purchases and/or sales of those securities in the open market or otherwise from the time of the interview or the decision to write an article until three business days after the publication of the interview or article. The foregoing prohibition does not apply to articles that in substance only restate previously published company releases. 6) This article does not constitute medical advice. Officers, employees and contributors to Streetwise Reports are not licensed medical professionals. Readers should always contact their healthcare professionals for medical advice.
Technical analyst Clive Maund examines this potential of the company’s stock.
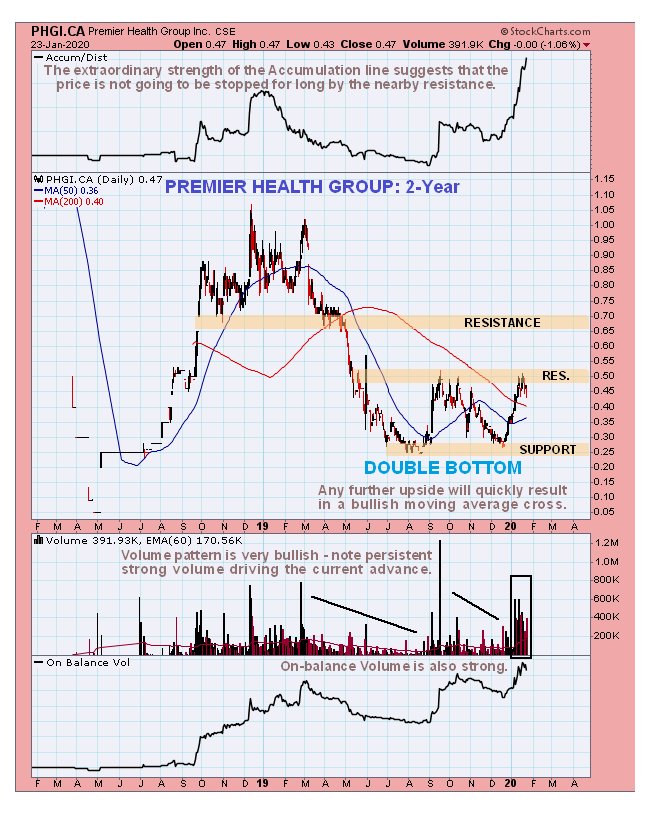
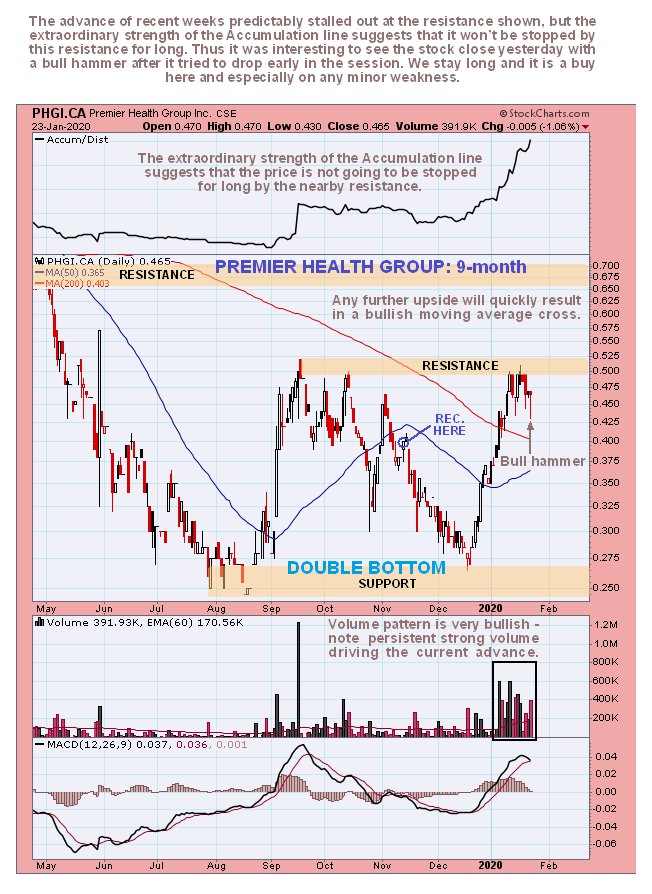
The timing was off when we bought this stock back in the fall, as after we bought the price slumped back toward the lows again. What happened was that I had interpreted the pattern forming as a completing cup-and-handle base, but then it morphed into a double bottom. We can see what happened on the two-year chart, and how the pattern still has some attributes of a cup-and-handle base, so that it may be described as a hybrid pattern between that and a double bottom. As it now more closely resembles the latter, that is what we will label it as.
The most striking point to notice on these charts is that, while the Premier Health Group Inc. (PHGI:CSE; PHGRF:OTCQB; 6PH:FSE) stock price has risen significantly from its December lowsso that we have more than made good our lossthe advance has been driven by persistent strong volume that has caused a spectacular ramp-up in the accumulation line, and has also taken the on-balance volume line to new highs. This is an indication that almost all of the volume is upside volume, which is strongly bullish. This also normally implies that a stock is building up to a big move, which means that it should have little trouble overcoming the resistance that has temporarily capped the advance.
Thus, it is interesting to observe the current bunching of the price and its moving averages, which means that any further advance from here will quickly lead to a moving average cross and the 200-day turning up, a development that typically marks the start of a major bull market.
On the nine-month chart we can see recent action in more detail, and how the sharp advance from the middle of December has brought the price up to resistance at the September highs, where it has stalled out, as we would expect. However, the extraordinarily strong volume indicators, especially the accumulation line, imply that it will soon turn higher and storm through this resistance.
Thus it is also interesting to observe that when it tried to drop back further yesterday in the early trade, buyers snapped at it from beneath, driving the price back up to leave a bull hammer on the chart by the close. This action could well mark the end of a tiny correction that will be soon followed by a breakout above the resistance. The next stop on its way up will be the resistance approaching the $0.70 area.
We therefore stay long, and the stock is rated a buy here, and especially on any minor near-term dips.
Premier Health Group website Premier Health Group Inc. closed at CA$0.49 ($0.32) on 23rd January 20.
Article originally posted at 9:25 a.m. EST on CliveMaund.com on 24th January 2020.
Clive Maund has been president of www.clivemaund.com, a successful resource sector website, since its inception in 2003. He has 30 years’ experience in technical analysis and has worked for banks, commodity brokers and stockbrokers in the City of London. He holds a Diploma in Technical Analysis from the UK Society of Technical Analysts.
Disclosure: 1) Clive Maund: I, or members of my immediate household or family, own shares of the following companies mentioned in this article: None. I personally am, or members of my immediate household or family are, paid by the following companies mentioned in this article: None. My company has a financial relationship with the following companies mentioned in this article: None. CliveMaund.com disclosures below. I determined which companies would be included in this article based on my research and understanding of the sector. 2) The following companies mentioned in this article are billboard sponsors of Streetwise Reports: None. Click here for important disclosures about sponsor fees. 3) Statements and opinions expressed are the opinions of the author and not of Streetwise Reports or its officers. The author is wholly responsible for the validity of the statements. The author was not paid by Streetwise Reports for this article. Streetwise Reports was not paid by the author to publish or syndicate this article. The information provided above is for informational purposes only and is not a recommendation to buy or sell any security. Streetwise Reports requires contributing authors to disclose any shareholdings in, or economic relationships with, companies that they write about. Streetwise Reports relies upon the authors to accurately provide this information and Streetwise Reports has no means of verifying its accuracy. 4) This article does not constitute investment advice. Each reader is encouraged to consult with his or her individual financial professional and any action a reader takes as a result of information presented here is his or her own responsibility. By opening this page, each reader accepts and agrees to Streetwise Reports’ terms of use and full legal disclaimer. This article is not a solicitation for investment. Streetwise Reports does not render general or specific investment advice and the information on Streetwise Reports should not be considered a recommendation to buy or sell any security. Streetwise Reports does not endorse or recommend the business, products, services or securities of any company mentioned on Streetwise Reports. 5) From time to time, Streetwise Reports LLC and its directors, officers, employees or members of their families, as well as persons interviewed for articles and interviews on the site, may have a long or short position in securities mentioned. Directors, officers, employees or members of their immediate families are prohibited from making purchases and/or sales of those securities in the open market or otherwise from the time of the interview or the decision to write an article until three business days after the publication of the interview or article. The foregoing prohibition does not apply to articles that in substance only restate previously published company releases. As of the date of this article, officers and/or employees of Streetwise Reports LLC (including members of their household) own securities of Premier Health, a company mentioned in this article.
Charts provided by the author.
CliveMaund.com Disclosure: The above represents the opinion and analysis of Mr Maund, based on data available to him, at the time of writing. Mr. Maund’s opinions are his own, and are not a recommendation or an offer to buy or sell securities. Mr. Maund is an independent analyst who receives no compensation of any kind from any groups, individuals or corporations mentioned in his reports. As trading and investing in any financial markets may involve serious risk of loss, Mr. Maund recommends that you consult with a qualified investment advisor, one licensed by appropriate regulatory agencies in your legal jurisdiction and do your own due diligence and research when making any kind of a transaction with financial ramifications. Although a qualified and experienced stock market analyst, Clive Maund is not a Registered Securities Advisor. Therefore Mr. Maund’s opinions on the market and stocks can only be construed as a solicitation to buy and sell securities when they are subject to the prior approval and endorsement of a Registered Securities Advisor operating in accordance with the appropriate regulations in your area of jurisdiction.
This week – January 26 through February 1 – central banks from 20 countries or jurisdictions are scheduled to decide on monetary policy: Armenia, Kyrgyzstan, Kenya, Angola, Pakistan, Hungary, Tajikistan, Georgia, Moldova, USA, Chile, Sri Lanka, Fiji, Ukraine, Malawi, UK, Azerbaijan, Bulgaria, Ghana and Colombia.
Following table includes the name of the country, the date of the next policy decision, the current policy rate, the result of the last policy decision, the change in the policy rate year to date, and the rate one year ago.
The table is updated when the latest decisions are announced and can always accessed by clicking on This Week.