Author Archive for InvestMacro – Page 375

Why Oil Prices Fell — Stockpiles or Price Pattern?

You be the judge…

By Elliott Wave International

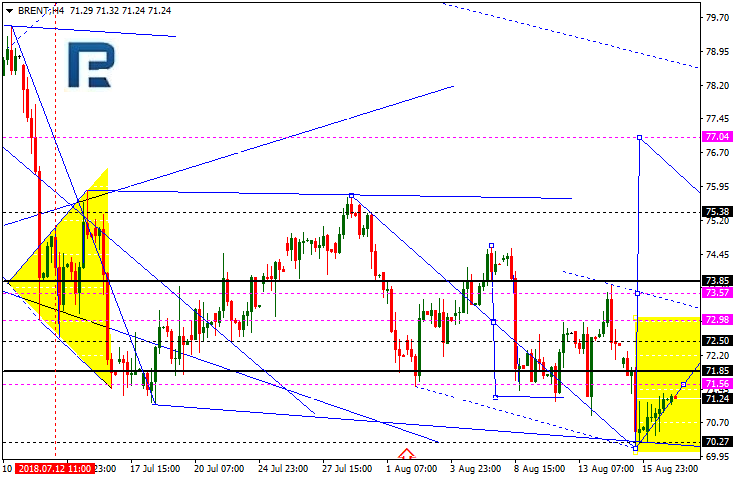
Let’s cut right to the chart below. The shaded triangle highlights the dramatic price action in crude oil prices on August 15, when crude plummeted 3% to its lowest level in over nine weeks.

Crude Oil Image 3

Now, according to the mainstream experts, the number one catalyst for crude’s collapse was a shockingly bearish same-day Energy Information Administration (EIA) weekly inventory report, marked with the orange arrow in the bottom right of the chart.

What made the report so bearish was the fact that analysts forecast a 2.5 million decrease in oil stockpiles in the week ending August 10, while the EIA data showed a 6.8 million-barrel increase! Wrote one August 15 news source: “Crude Oil Prices Slammed by Surprise U.S. Inventories Build.” (Seeking Alpha)

It’s a perfect fit — in the popular, news-moves-markets model, that is. The market was expecting one thing and got the complete opposite. Cue brutal selloff.

The problem with that model, however, is that it does investors and traders no favors. At best, it offers convenient explanations for price moves — after they’ve already occurred.

Let’s go back to the chart and consider the other arrow, the blue one labeled EWP, for the Elliott Wave Principle.

On August 14 — one day before the bearish EIA report was released — our Energy Pro Service identified a bearish Elliott wave setup on crude oil’s price chart. There, Energy Pro Service editor Steve Craig outlined the most probable course for crude oil in the days ahead:

“Crude should be in the final leg of a countertrend advance, be it wave ii, or the larger-degree wave ((ii)). Resistance above the 68.37 intraday high is around 68.48 and then 69.11. On the downside, trade below 67.38 would offer an aggressive hint that a downward reversal is underway… the key point is that the larger trend is down.”

Crude Oil Image 1

What happened next?

The chart below sums it up best: Crude oil finished its wave ii and hit the skids in the 3% selloff on August 15.

Crude Oil Image 2

Elliott wave analysis posits that the main driver of market trends is investor psychology, which unfolds as Elliott wave patterns directly on price charts.

These patterns are measurable and predictable, so they enable Elliotticians to anticipate future price moves — before they arise.

If you are prepared to take the next step in educating yourself about the basics of the Wave Principle — access the FREE Online Tutorial from Elliott Wave International.

The Elliott Wave Basic Tutorial is a 10-lesson comprehensive online course with the same content you’d receive in a formal training class — but you can learn at your own pace and review the material as many times as you like!

Get 10 FREE Lessons on The Elliott Wave Principle that Will Change the Way You Invest Forever.

This article was syndicated by Elliott Wave International and was originally published under the headline Why Oil Prices Fell — Stockpiles or Price Pattern?. EWI is the world’s largest market forecasting firm. Its staff of full-time analysts led by Chartered Market Technician Robert Prechter provides 24-hour-a-day market analysis to institutional and private investors around the world.

Fibonacci Retracements Analysis 20.08.2018 (GOLD, USDCHF)

Article By RoboForex.com

XAUUSD, “Gold vs US Dollar”

As we can see in the H4 chart, the long-term convergence made XAUUSD reverse and start a new correction upwards. The possible targets may be the retracements of 23.6%, 38.2%, 50.0% and 61.8% at 1199.17, 1223.77, 1243.00, and 1262.80 respectively. However, another scenario implies that the price may yet break the previous low at 1160.13 and then continue falling towards the next significant support level at 1122.74.

GOLD1
Risk Warning: the result of previous trading operations do not guarantee the same results in the future

In the H1 chart, the uptrend is moving towards the retracement of 23.6%.

GOLD2
Risk Warning: the result of previous trading operations do not guarantee the same results in the future


USDCHF, “US Dollar vs Swiss Franc”

As we can see in the H4 chart, the long-term correctional trend continues. After reaching the retracement of 23.6%, USDCHF has started a short-term correction upwards, which has already reached the retracement of 50.0% and may continue towards the ones of 61.8% and 76.0% at 0.9991 and 1.0020 respectively. If the price breaks the high at 1.0068, the instrument may continue growing towards the post-correctional extension area between the retracements of 138.2% and 161.8% at 1.0144 and 1.0192 respectively.

USDCHF1
Risk Warning: the result of previous trading operations do not guarantee the same results in the future

In the H1 chart, the pair is trading between 0.9860 and 0.9991.

USDCHF2
Risk Warning: the result of previous trading operations do not guarantee the same results in the future

Article By RoboForex.com

Attention!
Forecasts presented in this section only reflect the author’s private opinion and should not be considered as guidance for trading. RoboForex LP bears no responsibility for trading results based on trading recommendations described in these analytical reviews.

Forex Technical Analysis & Forecast 20.08.2018 (EURUSD, GBPUSD, USDCHF, USDJPY, AUDUSD, USDRUB, GOLD, BRENT)

Article By RoboForex.com

EURUSD, “Euro vs US Dollar”

EURUSD is still being corrected. Today, the price may grow to reach 1.1466 and then fall towards 1.1390, thus forming another consolidation range. If later the instrument breaks this range to the downside, the price may continue falling to reach the target at 1.1185; if to the upside – continue the correction towards 1.1566.

EURUSD
Risk Warning: the result of previous trading operations do not guarantee the same results in the future


GBPUSD, “Great Britain Pound vs US Dollar”

GBPUSD is moving upwards. Possibly, the pair may be corrected to reach 1.2774 and then fall towards 1.2716, thus forming another consolidation range. If later the instrument breaks this range to the upside, the price may trade to reach 1.2900 (an alternative scenario); if to the downside – continue falling inside the downtrend with the target at 1.2600.

GBPUSD
Risk Warning: the result of previous trading operations do not guarantee the same results in the future


USDCHF, “US Dollar vs Swiss Franc”

USDCHF is still falling; it has already reached its closest downside target and right now is forming the fourth structure. Possibly, today the pair may extend this structure towards 0.9907. Later, the market may start another growth to reach 0.9988 and then fall towards 0.9942, thus forming another consolidation range. After that, the instrument may break the range to the upside and continue growing with the target at 1.0066.

USDCHF
Risk Warning: the result of previous trading operations do not guarantee the same results in the future


USDJPY, “US Dollar vs Japanese Yen”

USDJPY is still consolidating. Today, the price may fall towards 110.22 and then grow to reach 110.88. An alternative scenario implies that the pair may extend this structure towards 111.66 and then resume trading downwards. The target is at 109.90. And that’s just a half of this descending wave. The short-term target of the third wave is at 107.40.

USDJPY
Risk Warning: the result of previous trading operations do not guarantee the same results in the future


AUDUSD, “Australian Dollar vs US Dollar”

AUDUSD is still being corrected. Possibly, the pair may reach 0.7333 and then fall towards 0.7270, thus forming another consolidation range. If later the instrument breaks this range to the upside, the price may continue the correction to reach 0.7440 (an alternative scenario); if to the downside – resume falling inside the downtrend with the target at 0.7188.

AUDUSD
Risk Warning: the result of previous trading operations do not guarantee the same results in the future


USDRUB, “US Dollar vs Russian Ruble”

USDRUB is forming a new ascending structure with the target at 67.77, thus forming another consolidation range at the top. If later the instrument breaks this range to the downside, the price may start forming the third descending wave with the target at 64.09.

USDRUB
Risk Warning: the result of previous trading operations do not guarantee the same results in the future


XAUUSD, “Gold vs US Dollar”

Gold has broken the descending channel and the top of the first ascending impulse, and may start another correction towards 1212.00. Today, the price may reach 1204.00 and then fall towards 1186.00. After that, the instrument may resume growing with the first target at 1212.00.

GOLD
Risk Warning: the result of previous trading operations do not guarantee the same results in the future


BRENT

Brent is moving upwards. Possibly, today the pair may reach 72.65 and then fall towards 71.40, thus forming another consolidation range. According to the main scenario, the market is expected to break the range to the upside and then continue growing with the short-term target at 75.50.

BRENT
Risk Warning: the result of previous trading operations do not guarantee the same results in the future

Article By RoboForex.com

Attention!
Forecasts presented in this section only reflect the author’s private opinion and should not be considered as guidance for trading. RoboForex LP bears no responsibility for trading results based on trading recommendations described in these analytical reviews.

The Analytical Overview of the Main Currency Pairs on 2018.08.20

Analytics by JustForex

The EUR/USD currency pair

Technical indicators of the currency pair:
  • Prev Open: 1.13752
  • Open: 1.14375
  • % chg. over the last day: +0.54
  • Day’s range: 1.14361 – 1.14394
  • 52 wk range: 1.0571 – 1.2557

On Friday, the bullish sentiment was observed on the EUR/USD currency pair. Financial market participants began to fix short positions after the continuous rally of the US currency. At the moment, the key support and resistance levels are 1.14000 and 1.14400, respectively. We recommend opening positions from these marks. The trading instrument has the potential for further growth. Trade negotiations between the US and China are in the focus of attention.

The news feed on the US economy and the Eurozone is calm.

EUR/USD

Indicators do not send accurate signals: the price has fixed between 50 MA and 200 MA.

The MACD histogram is located in the positive zone, but below the signal line, which gives a weak signal to buy EUR/USD.

Stochastic Oscillator is in the oversold zone, the %K line is crossing the %D line. There are no accurate signals.

Trading recommendations
  • Support levels: 1.14000, 1.13600, 1.13200
  • Resistance levels: 1.14400, 1.14800, 1.15200

If the price fixes above the resistance level of 1.14400, further growth of the EUR/USD currency pair is expected. The movement is tending to 1.14800-1.15000.

Alternative option. If the price fixes below the round level of 1.14000, it is necessary to look for entry points to the market to open short positions. The movement is tending to 1.13600-1.13400.

The GBP/USD currency pair

Technical indicators of the currency pair:
  • Prev Open: 1.27066
  • Open: 1.27423
  • % chg. over the last day: +0.26
  • Day’s range: 1.27405 – 1.27493
  • 52 wk range: 1.2361 – 1.4345

The technical pattern on the GBP/USD currency pair is ambiguous. At the moment, quotes are in a sideways trend. The key support and resistance levels are 1.27200 and 1.27600, respectively. In the near future, we expect correction of the GBP/USD currency pair. Positions should be opened from the key levels.

The news feed on the UK economy is calm.

GBP/USD

Indicators do not send accurate signals: the price has fixed between 50 MA and 200 MA.

The MACD histogram is in the positive zone, but below the signal line, which gives a weak signal to buy GBP/USD.

Stochastic Oscillator is located in the neutral zone, the %K line is crossing the %D line. There are no accurate signals.

Trading recommendations
  • Support levels: 1.27200, 1.26800
  • Resistance levels: 1.27600, 1.28000, 1.28400

If the price fixes above 1.27600, the GBP/USD currency pair is expected to grow. The target movement level is 1.28000-1.28400.

An alternative may be decrease of the GBP/USD quotes to 1.26800-1.26600.

The USD/CAD currency pair

Technical indicators of the currency pair:
  • Prev Open: 1.31537
  • Open: 1.30598
  • % chg. over the last day: -0.71
  • Day’s range: 1.30598 – 1.30708
  • 52 wk range: 1.2059 – 1.3795

On Friday, there were aggressive sales on the USD/CAD currency pair. The decrease in quotes exceeded 100 points. At the moment, financial market participants expect additional drivers. Local support and resistance levels are 1.30500 and 1.30800, respectively. We recommend opening positions from these marks. The trading instrument has the potential for further reduce.

Publication of important news is not expected in Canada.

USD/CAD

Indicators point to the power of sellers: the price has fixed below 50 MA and 200 MA.

The MACD histogram is in the negative zone, but above the signal line, which gives a weak signal to sell USD/CAD.

Stochastic Oscillator is located in the neutral zone, the %K line crossed the %D line. There are no accurate signals.

Trading recommendations
  • Support levels: 1.30500, 1.30200, 1.30000
  • Resistance levels: 1.30800, 1.31200, 1.31500

If the price fixes below 1.30500, the USD/CAD quotes are expected to decline. The movement is tending to 1.30200-1.30000.

Alternative option. If the price fixes above the resistance of 1.30800, it is necessary to consider purchases of USD/CAD. The movement is tending to 1.31200-1.31500.

The USD/JPY currency pair

Technical indicators of the currency pair:
  • Prev Open: 110.870
  • Open: 110.593
  • % chg. over the last day: -0.35
  • Day`s range: 110.591 – 110.684
  • 52 wk range: 104.56 – 114.74

On Friday, the bearish sentiment was observed on the USD/JPY currency pair. The decrease in quotes exceeded 60 points. At the moment, the trading instrument is in a sideways trend. Local support and resistance levels are 110.450 and 110.700, respectively. The positions should be opened from these marks. Financial market participants expect additional drivers.

The news feed on the economy of Japan is calm.

USD/JPY

Indicators point to the power of sellers: the price has fixed below 50 MA and 200 MA.

The MACD histogram is in the negative zone, but above the signal line, which gives a weak signal to sell USD/JPY.

Stochastic Oscillator is located near the overbought zone, the %K line is below the %D line, which gives a strong signal to sell USD/JPY.

Trading recommendations
  • Support levels: 110.450, 110.200
  • Resistance levels: 110.700, 111.000, 111.300

If the price fixes above the resistance level of 110.700, the USD/JPY currency pair is expected to grow. The movement is tending to 111.000-111.300.

Alternative option. If the price fixes below the level of 110.450, it is necessary to consider sales of USD/JPY. The movement is tending to 110.200-110.000.

Analytics by JustForex

Sentiment of the Financial Market Participants Turned Up

by JustForex

On Friday, the US currency weakened against the basket of major currencies after it had become known that China and the US intended to resolve the trade conflict. Negotiations between the countries should be held this week on Wednesday and Thursday, August 22-23. The US dollar index (#DX) closed in the negative zone (-0.58%). Currency majors are tending to recover.

Also this week, Thursday to Saturday, the international economic conference will take place in Jackson Hole, where the Federal Reserve Chairman Jerome Powell will give a speech. Experts hope to receive clues from the leaders of central banks regarding further courses of monetary policies. Investors also expect the publication of FOMC protocols on Wednesday, August 22.

The “black gold” prices are moderately declining. At the moment, futures for the WTI crude oil are testing a mark of $65.20 per barrel.

Market Indicators

On Friday, the bullish sentiment was observed in the US stock market: #SPY (+0.35%), #DIA (+0.22%), #QQQ (+0.02%).

At the moment, the 10-year US government bonds yield is at the level of 2.86%-2.87%.

The news feed on 2018.08.20:

Today, important economic data are not expected to be published.

by JustForex

EURUSD: buyers raised the rate above 1.14

By Gabriel Ojimadu, Alpari

Previous:

On Friday, the 17th of August, trading on the euro closed up. The day turned out to be anything but calm. The movements were very impulsive. Volatility on the market was observed in the European and US sessions.

The driver of the pair’s rise was the fall of the US dollar on the background of traders’ propensity for risky assets after the release of weak US data and strong Canadian data. The Canadian dollar could act as an engine for growth for all major dollar pairs.

USD has fallen against CAD after the publishing of fresh inflation data in Canada. The rise in inflation has supported CAD, as the probability of another rate increase by the BOC grew this year.

MCSI failed to reach expectations. In August, the index fell to 95.3 points, compared with 97.9 points in July. The index was expected to rise to 98.0 points.

EUR is expected to recover to 1.1445 by the close of the day and week’s trading.

Day’s news (GMT+3):

  • 9:00 Germany: PPI (YoY) (Jul).
  • 13:00 Germany: German Buba monthly report.
  • 18:00 US: FOMC member Bostic speech.
  • 19:00 Germany: Germany Buba President Weidmann speech.

Fig 1. EURUSD hourly chart. Source: TradingView.

Current situation:

My expectations that trading would be flat on the last day of the week were not justified. Buyers were able to close the fall at 1.1409 and hit a fresh high of 1.1433 from the 13th of August, 2018. They stopped the sellers and moved the market to a deeper correction phase.

Since on Friday the euro closed up, on Monday the price drop should be considered against Friday. But as the pair is stuck above the 1.1425-1.1433 resistance zone, and the stochastic oscillator is in the purchase zone, then according to the forecast I’m expecting an increase to 1.1464, just above the 90th degree. From there, I’m waiting for a fall to the trend line (1.1425), which traces its roots to 1.1301.

The economic calendar is empty. If buyers cannot immediately go up, then the drop will begin without growth. In this case, the reduction target will be at 1.1410. If it does not stand, then we fall lower to 1.1392 (the 45th degree).

COT Report: 10-YR Bets Set New Record. Gold, Silver & Euro Bets Go Bearish

By CountingPips.com

Here is this week’s links (below) and short summaries to the latest Commitment of Traders changes that were released on Friday.


Currency Speculators go bearish on Euro, raise US Dollar Index bets for 17th week

This week’s data showed 7 out of 8 major currency levels are bearish

The latest data for the weekly Commitment of Traders (COT) report, released by the Commodity Futures Trading Commission (CFTC) on Friday, showed that large traders and currency speculators continued to increase their bets for the US dollar Index this week while dragging euro bets into a new bearish standing. See full article


WTI Crude Oil Speculators reduced their bullish bets for 2nd week

The non-commercial contracts of WTI crude futures totaled a net position of 573,428 contracts, according to data from this week. This was a slide of -35,499 contracts from the previous weekly total. See full article


Gold Speculators net positions go bearish for 1st time since 2002

The large speculator contracts of gold futures totaled a net position of -3,688 contracts. This was a weekly decline of -16,376 contracts from the previous week. See full article


10-Year Note Speculator bets surged to new record high bearish position

The large speculator contracts of 10-year treasury note futures totaled a net position of -698,194 contracts. This was a weekly reduction of -111,895 contracts from the previous week. See full article


S&P500 Mini Speculators bullish bets bounced back this week

Large stock market speculators boosted their bullish net positions in the S&P500 Mini futures markets this week. See full article


Silver Speculators dropped their net positions into new bearish level

The non-commercial contracts of silver futures totaled a net position of -2,836 contracts, according to data from this week. This was a weekly fall of -7,177 contracts from the previous totals. See full article


Copper Speculators edged their bullish bets slightly higher this week

The large speculator contracts of copper futures totaled a net position of 3,088 contracts. This was a weekly boost of 898 contracts from the data of the previous week. See full article


Article by CountingPips.com

The Commitment of Traders report data is published in raw form every Friday by the Commodity Futures Trading Commission (CFTC) and shows the futures positions of market participants as of the previous Tuesday (data is reported 3 days behind).

To learn more about this data please visit the CFTC website at http://www.cftc.gov/MarketReports/CommitmentsofTraders/index.htm

Currency Speculators go bearish on Euro, raise US Dollar Index bets for 17th week

By CountingPips.comGet our weekly COT Reports by Email

This week’s data showed 7 out of 8 major currency levels are bearish

The latest data for the weekly Commitment of Traders (COT) report, released by the Commodity Futures Trading Commission (CFTC) on Friday, showed that large traders and currency speculators continued to increase their bets for the US dollar Index this week while dragging euro bets into a new bearish standing.

Non-commercial large futures traders, including hedge funds and large speculators, bet in favor of the US Dollar Index (1,931 weekly change in contracts), Japanese yen (4,439 contracts), Swiss franc (259 contracts) and the Australian dollar (2,757 contracts), according to the data reported through Tuesday August 14th.

On the down side, the currencies whose speculative bets declined this week were the euro (-12,354 weekly change in contracts), British pound sterling (-1,889 contracts), Canadian dollar (-1,300 contracts), New Zealand dollar (-2,166 contracts) and the Mexican peso (-2,186 contracts).

Overall, with the euro now dipping into bearish territory, the number of individual currencies that are in a bearish standing has increased to seven out of the eight that we currently track. The only one still with an overall bullish standing is the Mexican peso.


Table of Weekly Commercial Traders and Speculators Levels & Changes:

CurrencyNet CommercialsComms Weekly ChgNet SpeculatorsSpecs Weekly Chg
EuroFx-10,30715,787-1,789-12,354
GBP84,5548,315-60,741-1,889
JPY80,210-6,148-58,3684,439
CHF65,775-333-45,849259
CAD31,2831,555-26,198-1,300
AUD75,774-843-51,7832,757
NZD30,5861,938-26,693-2,166
MXN-35,25674831,074-2,186


This latest COT data is through Tuesday and shows a quick view of how large speculators or non-commercials (for-profit traders) as well as the commercial traders (hedgers & traders for business purposes) were positioned in the futures markets. All currency positions are in direct relation to the US dollar where, for example, a bet for the euro is a bet that the euro will rise versus the dollar while a bet against the euro will be a bet that the dollar will gain versus the euro.


US Dollar Index bullish bets keep rising

Large speculators continued to raise their bullish net positions in the US Dollar Index futures markets again this week.

The non-commercial futures contracts of US Dollar Index futures, traded by large speculators and hedge funds, totaled a net position of 32,033 contracts in the data reported through Tuesday August 14th. This was a weekly advance of 1,931 contracts from the previous week which had a total of 30,102 net contracts.

Bets for the US dollar index have now improved for seventeen straight weeks to the highest bullish level since May 16th of 2017 when the net positions totaled 34,275 contracts.


Elsewhere, we only saw one substantial change (+ or – 10,000 contracts) in the individual currency contract levels for the speculators category.

  • Euro contracts decreased by over -12,000 contracts for a second straight week as the overall position fell into a bearish spec positioning for the first time since May 2nd 2017. The euro bets have now declined for three straight weeks and contracts have gone from +88,225 contracts to -1,789 contracts in just the last ten weeks.

Other Notables:

  • New Zealand dollar bearish bets rose for a second straight week and to the most bearish level on record, according to our data dating back to 1999
  • British pound sterling bets fell for a fourth straight week and to the most bearish level since May 2nd 2017 when the standing was -81,364 contracts
  • Japanese yen bets have improved for three weeks and are now at the least bearish position of the past five weeks

Weekly Charts: Large Trader Weekly Positions vs Price

EuroFX:


British Pound Sterling:


Japanese Yen:


Swiss Franc:


Canadian Dollar:


Australian Dollar:


New Zealand Dollar:


Mexican Peso:


*COT Report: The weekly commitment of traders report summarizes the total trader positions for open contracts in the futures trading markets. The CFTC categorizes trader positions according to commercial hedgers (traders who use futures contracts for hedging as part of the business), non-commercials (large traders who speculate to realize trading profits) and nonreportable traders (usually small traders/speculators). Find CFTC criteria here: (http://www.cftc.gov/MarketReports/CommitmentsofTraders/ExplanatoryNotes/index.htm).

The Commitment of Traders report is published every Friday by the Commodity Futures Trading Commission (CFTC) and shows futures positions data that was reported as of the previous Tuesday (3 days behind).

Each currency contract is a quote for that currency directly against the U.S. dollar, a net short amount of contracts means that more speculators are betting that currency to fall against the dollar and a net long position expect that currency to rise versus the dollar.

(The charts overlay the forex closing price of each Tuesday when COT trader positions are reported for each corresponding spot currency pair.) See more information and explanation on the weekly COT report from the CFTC website.

Article by CountingPips.com


Fibonacci Retracements Analysis 17.08.2018 (BITCOIN, ETHEREUM)

Article By RoboForex.com

BTCUSD, “Bitcoin vs US Dollar”

As we can see in the H4 chart, the convergence made BTCUSD reverse and start a new correction to the upside, which has already reached the retracement of 23.6%. The next possible targets of this ascending correction are the retracements of 38.2% and 50.0% at 6807 and 7095 respectively. The support level is the low at 5890.

BTCUSD1
Risk Warning: the result of previous trading operations do not guarantee the same results in the future

In the H1 chart, the pair is being corrected. After breaking the local high, the price may grow towards the post-correctional extension area between the retracements of 138.2% and 161.8% at 6783 and 6883 respectively. Another possible scenario implies that the instrument may break the low at 5890 and continue the downtrend towards 5750.

BTCUSD2
Risk Warning: the result of previous trading operations do not guarantee the same results in the future


ETHUSD, “Ethereum vs. US Dollar”

As we can see in the H4 chart, ETHUSD is being corrected upwards and has already reached the retracement of 23.6%. The next upside targets are the retracements of 38.2% and 50.0% at 340.00 and 368.00 respectively. The support level is the low at 250.59.

ETHUSD1
Risk Warning: the result of previous trading operations do not guarantee the same results in the future

The H1 chart shows more detailed structure of the current ascending tendency.

ETHUSD2
Risk Warning: the result of previous trading operations do not guarantee the same results in the future

Article By RoboForex.com

Attention!
Forecasts presented in this section only reflect the author’s private opinion and should not be considered as guidance for trading. RoboForex LP bears no responsibility for trading results based on trading recommendations described in these analytical reviews.

Forex Technical Analysis & Forecast 17.08.2018 (EURUSD, GBPUSD, USDCHF, USDJPY, AUDUSD, USDRUB, GOLD, BRENT)

Article By RoboForex.com

EURUSD, “Euro vs US Dollar”

EURUSD is being corrected upwards. Possibly, the pair may grow towards 1.1430 and then resume falling inside the downtrend with the target at 1.1238.

EURUSD
Risk Warning: the result of previous trading operations do not guarantee the same results in the future


GBPUSD, “Great Britain Pound vs US Dollar”

GBPUSD is still consolidating. Possibly, today the pair may grow to reach 1.2765 and then continue the downtrend towards 1.2600.

GBPUSD
Risk Warning: the result of previous trading operations do not guarantee the same results in the future


USDCHF, “US Dollar vs Swiss Franc”

USDCHF is consolidating; right now, it is forming another ascending structure with the target at 0.9987. Later, the market may start a new correction to reach 0.9945. After that, the instrument may resume growing towards 1.0060.

USDCHF
Risk Warning: the result of previous trading operations do not guarantee the same results in the future


USDJPY, “US Dollar vs Japanese Yen”

USDJPY is still being corrected. Today, the pair may form another ascending structure to reach 111.66. After that, the instrument may resume trading inside the downtrend towards 109.72. The short-term target is at 107.40.

USDJPY
Risk Warning: the result of previous trading operations do not guarantee the same results in the future


AUDUSD, “Australian Dollar vs US Dollar”

AUDUSD is consolidating at the top of ascending structure. Today, the price may break the range downwards and continue falling inside the downtrend to reach 0.7133.

AUDUSD
Risk Warning: the result of previous trading operations do not guarantee the same results in the future


USDRUB, “US Dollar vs Russian Ruble”

USDRUB is forming another descending structure to break 65.95. Later, the market may continue falling inside the downtrend with the short-term target at 64.00.

USDRUB
Risk Warning: the result of previous trading operations do not guarantee the same results in the future


XAUUSD, “Gold vs US Dollar”

Gold has finished the ascending impulse along with the correction and formed a new consolidation range. If later the instrument breaks this range to the upside, the price may continue the correction towards 1197.00; if to the downside – start another decline with the target at 1150.00.

GOLD
Risk Warning: the result of previous trading operations do not guarantee the same results in the future


BRENT

Brent is trading upwards to reach 71.56. Later, the market may resume falling towards 70.65 and then start another growth with the target at 72.95.

BRENT
Risk Warning: the result of previous trading operations do not guarantee the same results in the future

Article By RoboForex.com

Attention!
Forecasts presented in this section only reflect the author’s private opinion and should not be considered as guidance for trading. RoboForex LP bears no responsibility for trading results based on trading recommendations described in these analytical reviews.