Author Archive for InvestMacro – Page 374

The Analytical Overview of the Main Currency Pairs on 2018.08.22

Analytics by JustForex

The EUR/USD currency pair

Technical indicators of the currency pair:
  • Prev Open: 1.14808
  • Open: 1.15703
  • % chg. over the last day: +0.83
  • Day’s range: 1.15651 – 1.15767
  • 52 wk range: 1.0571 – 1.2557

Yesterday, there were aggressive purchases on the EUR/USD currency pair. The growth of quotes exceeded 100 points. At the moment, the key support and resistance levels are 1.15400 and 1.15900, respectively. We recommend opening positions from these marks. The trading instrument has the potential for further growth. Investors took a wait-and-see attitude before the publication of the FOMC minutes.

The news feed on 2018.08.22:
  • – Existing home sales in the US at 17:00 (GMT+3:00);
  • – Publication of the FOMC minutes at 21:00 (GMT+3:00).
EUR/USD

The price has fixed above 50 MA and 200 MA, which indicates the power of buyers.

The MACD histogram is located in the positive zone, but below the signal line, which gives a weak signal to buy EUR/USD.

Stochastic Oscillator is in the neutral zone, the %K line is below the %D line, which indicates a decrease in quotes.

Trading recommendations
  • Support levels: 1.15400, 1.14800, 1.14300
  • Resistance levels: 1.15900, 1.16200, 1.16500

If the price fixes above the resistance level of 1.15900, further growth of the EUR/USD currency pair is expected. The movement is tending to 1.16200-1.16500.

Alternative option. If the price fixes below the “mirror” support of 1.15400, we recommend considering sales of EUR/USD. The movement is tending to 1.14900-1.14500.

The GBP/USD currency pair

Technical indicators of the currency pair:
  • Prev Open: 1.27944
  • Open: 1.28750
  • % chg. over the last day: +0.84
  • Day’s range: 1.28938 – 1.29132
  • 52 wk range: 1.2361 – 1.4345

Yesterday, aggressive purchases prevailed on the GBP/USD currency pair. The growth of quotes exceeded 100 points. At the moment, local support and resistance levels are 1.29200 and 1.28700, respectively. The positions should be opened from these marks. The trading instrument has the potential for further recovery.

The news feed on the UK economy is calm.

GBP/USD

The price has fixed above 50 MA and 200 MA, which indicates the power of buyers.

The MACD histogram is in the positive zone, but below the signal line, which gives a weak signal to buy GBP/USD.

Stochastic Oscillator is located in the neutral zone, the %K line is below the %D line, which signals to sell GBP/USD.

Trading recommendations
  • Support levels: 1.28700, 1.28200, 1.27700
  • Resistance levels: 1.29200, 1.29500

If the price fixes above 1.29200, GBP/USD currency pair is expected to grow. The target movement level is 1.29500-1.29700.

Alternative option. If the price fixes below 1.28700, the correction of GBP/USD quotes is expected. The target movement level is 1.28400-1.28200.

The USD/CAD currency pair

Technical indicators of the currency pair:
  • Prev Open: 1.30437
  • Open: 1.30367
  • % chg. over the last day: -0.09
  • Day’s range: 1.30246 – 1.30413
  • 52 wk range: 1.2059 – 1.3795

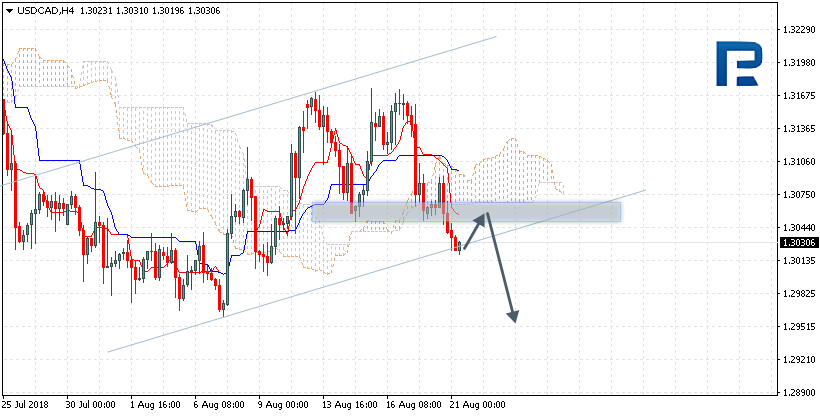
The technical pattern on the USD/CAD currency pair is ambiguous. The trading instrument is in a sideways trend. At the moment, financial market participants expect additional drivers. Local support and resistance levels are 1.30150 and 1.30450, respectively. We recommend opening positions from these marks.

At 15:30 (GMT+3:00) a report on retail sales will be published in Canada.

USD/CAD

The price has fixed below 50 MA and 200 MA, which indicates the power of sellers.

The MACD histogram is near the 0 mark.

Stochastic Oscillator is located in the neutral zone, the %K line is crossing the %D line. There are no accurate signals.

Trading recommendations
  • Support levels: 1.30150, 1.29800
  • Resistance levels: 1.30450, 1.30700, 1.31000

If the price fixes below 1.30150, the USD/CAD quotes are expected to decline. The movement is tending to 1.29800-1.29600.

Alternative option. If the price fixes above the resistance of 1.30450, it is necessary to consider purchases of USD/CAD. The movement is tending to 1.30700-1.31000.

The USD/JPY currency pair

Technical indicators of the currency pair:
  • Prev Open: 110.063
  • Open: 110.231
  • % chg. over the last day: +0.05
  • Day`s range: 110.413 – 110.428
  • 52 wk range: 104.56 – 114.74

There is a variety of trends on the USD/JPY currency pair. Investors expect an additional drivers. At the moment, local support and resistance levels are 110.200 and 110.550, respectively. The positions should be opened from these marks. We recommend paying attention to the FOMC minutes.

The news feed on the economy of Japan is calm.

USD/JPY

Indicators do not send accurate signals: the price has fixed between 50 MA and 200 MA.

The MACD histogram is in the positive zone, above the signal line, which gives a strong signal to buy USD/JPY.

Stochastic Oscillator is located near the overbought zone, the %K line is below the %D line, which indicates a decrease in quotes.

Trading recommendations
  • Support levels: 110.200, 109.850
  • Resistance levels: 110.550, 110.850, 111.150

If the price fixes above the resistance level of 110.550, the USD/JPY currency pair is expected to grow. The movement is tending to 110.850-111.000.

Alternative option. If the price fixes below 110.200, it is necessary to consider sales of USD/JPY. The movement is tending to 109.850-109.500.

Analytics by JustForex

The US Currency Continues to Decline

By JustForex

The US dollar continued to decline against the basket of major currencies. The US dollar index closed in the negative zone (-0.69%). Investors took a wait-and-see attitude before the publication of the FOMC minutes. In addition, today a three-day conference will start in Jackson Hole, where representatives of the world’s central banks will make speeches. Also, the attention of financial market participants is focused on the negotiations between the US and China.

According to the European Chief Negotiator for the United Kingdom Exiting the European Union, Michel Barnier, the EU and the UK intend to establish a number of agreements on the exit of the country from the union.

Today, during the Asian trading session, optimistic data on retail sales have been published in New Zealand. The core retail sales index counted to 1.4% and was better than the forecasted value of 0.8%. In the second quarter, the volume of retail sales grew by 1.1% instead of 0.4%.

The “black gold” prices are moderately growing. At the moment, futures for the WTI crude oil are testing a mark of $66.20 per barrel. At 17:30 (GMT+3:00), a report on weekly crude oil inventories will be published in the US.

Market Indicators

Yesterday, purchases prevailed in the US stock market: #SPY (+0.23%), #DIA (+0.25%), #QQQ (+0.37%).

At the moment, the 10-year US government bonds yield is at the level of 2.83%-2.84%.

The news feed on 2018.08.22:

– Report on retail sales in Canada at 15:30 (GMT+3:00);
– Existing home sales in the US at 17:00 (GMT+3:00);
– Publication of the FOMC minutes at 21:00 (GMT+3:00).

By JustForex

EURUSD: the upward movement is nearing completion

By Gabriel Ojimadu, Alpari

Previous:

On Tuesday, the 21st of August, trading on the euro closed up. The euro rose to close the day at 1.1601 amid a general weakening of the US dollar and a decline in US bond yields.

Market participants are trying to take US President Donald Trump’s latest statements seriously about the disagreement over the Fed’s rate increase. I think there is speculation that the euro will be driven as high as possible in the run-up to the publication of the minutes of the FOMC meeting.

Day’s news (GMT+3):

  • 15:30 Canada: retail sales (MoM) (Jun).
  • 17:00 US: existing home sales (MoM) (Jul).
  • 17:30 US: EIA crude oil stocks change (Aug 17).
  • 21:00 US: FOMC minutes.

Fig 1. EURUSD hourly chart. Source: TradingView.

Current situation:

The U3 line remains a strong resistance for buyers. It currently deviated from the LB balance line by 1%. The rate has only recently started trading around this level. If profit-taking starts, it will shoot up to the Lb balance line. According to the forecast, I considered the formation of a third top. With this angle of upward movement, a return to 1.1601 will be enough for buyers to start closing their long positions.

There is no bearish divergence between the AO and AC indicators; therefore, I considered a strengthening of the euro up to 1.1630. I plan to short the euro from there. If the price goes according to the forecast and closes at 1.1567 or lower, then a pin bar will form in the next few days. You can stay in a short position up to 1.1495.

Today the minutes of the latest Fed meeting are set to be published. Bear in mind that the market has already factored in a rate hike. Everyone is interested to know how many more rate hikes there will be this year.

Source: EURUSD: the upward movement is nearing completion

Cryptocurrency of the State

By Amie Parnaby

Several countries have expressed an interest and a determination to create their own state-backed currency using the blockchain (distributed ledger tech) phenomenon. Other countries have stated that it’s just not feasible. There are arguments on both sides of the coin.

For those of a pro-crypto attitude and enthusiasm, the idea of a state-backed cryptocurrency is a slap in the face to the very concept and ideology of the Bitcoin development. The idea of having a centralised cryptocurrency is just a pointed attempt to regain control of the financial ecosystem that blockchain and its younger siblings are trying to replace.

It may just be a coincidence that the countries that are implementing or looking to implement their own state-backed cryptocurrency, such as Venezuela, Russia, China, Cambodia, Iran and Turkey, are less-than-liberal in their approach to their people, and monetary control is as good as any other control mechanism. Everyone needs money to live.

Countries such as Venezuela and Russia have made no secret of the fact that creating their own state cryptocurrency serves as a mechanism to circumvent Western sanctions.

Other countries are trying to improve or save their failing national currencies or want to join the global financial market, such as Cambodia. No one can blame them for that.

Some just like the idea of DLT and want to go cashless, like Sweden, whose central bank has embraced the idea. It’s these countries that could eventually lead the way to global cryptocurrency adoption.

So far it just seems like a power grab by governments and central banks.

Without the foundations of DLT, Cryptocurrency would subside into digital fiat

State-backed crypto would remove the foundations upon which cryptocurrency has been built

Anonymity – Okay, they aren’t all anonymous, and people are eventually traceable through their transactions. However, right now the only thing that needs to be recorded in a transaction is the wallet address. Existing banking institutions wouldn’t allow that to continue.

Decentralisation – If a cryptocurrency is state-backed you can be sure that it will be a centralised system. Not only because they would never yield control over the blockchain to anyone but their power-base, but also because they wouldn’t want anyone else to be able to read it.

Transparency – If everything is recorded on the blockchain to be read, governments and departments would have to be completely transparent in all dealing. I strongly doubt that any government in the world can claim utter transparency when dealing with its population.

Immutability – There have already been suggestions and consultations with organisations such as Ripple Labs about creating an ‘alterable’ blockchain, citing it as a possible way to encourage banks and other financial institutions to embrace the Blockchain.

These foundations are what made cryptocurrency the popular alternative to fiat currency. At present, everyone in the world uses fiat currency to do everything, and most would probably be happy to move to DLT fiat currency. It wouldn’t mean much change and they could go on with their lives until the next financial upheaval makes them re-examine their financial freedom.

And then there is the competition

We mustn’t forget about the competition; it’s already here.

By the time any or all countries have developed their state cryptocurrency, the existing crypto coins will have developed far in advance. While nations build their infrastructures to accommodate blockchain finances, the existing ones will be improving.

The irony that can’t fail to be noticed is that while governments sing the praises of the blockchain and what it will do for the national economy, all the while denigrating other cryptocurrencies, they will be sowing the seeds of their own destruction.

The fact is that by maintaining authority and power, centralised institutions are ‘pushing’ DLT as a state-backed answer to the current cryptocurrency popularity.

You want distributed ledger; you can have it but on OUR terms.

What isn’t clearly understood is that once this state-backed child of the blockchain exists, it will be easier to phase it out and use the old one that is far better advanced and suited to the purpose. They will have built the infrastructure and paved the way for cryptocurrency adoption, only to have it wiped away by the old ones that were built to last.

About the Author:

Amie Parnaby is a professional writer and her experience spans a broad range of industries, from I.T. to training and optics to banking. Currently, Amie is the content writer for Terrexa – your entry point for crypto.


deVere CEO: The U.S. economy could be heading for a Fed-induced hangover

By George Prior

The U.S. economy may be heading for a Fed-induced hangover next year, warns the chief executive of one of the world’s largest independent financial advisory organizations.

The message from Nigel Green, founder and CEO of deVere Group, comes after President Trump ramped up Monday his criticism of the Federal Reserve.

In an interview with Reuters, Mr Trump said he was “not thrilled” with the Fed’s chairman, Jerome Powell, and that he would continue to criticize the central bank if it continued to raise short-term interest rates.

Mr Green comments: “Trump’s latest attack on the Fed is likely to be ignored by the central bank’s policymakers.  It is almost certainly not going to derail the raising of U.S. interest rates, with the next hike likely to be next month, as they attempt to take the heat and froth out of the economy.

“The domestic U.S. economy is currently growing at an annualized rate of around 4 per cent a year.

“But given that the current strong growth is likely to accelerate the rate hikes, a Fed-induced hangover may be on the cards for the U.S. economy next year as it is slowly encouraged to cool down.”

“However, fears in the market about a full-blown recession in 2019 are misplaced.”

He continues: “With domestic economic growth easily outpacing that seen in Europe or Japan this year, and the dollar likely to rise further on Fed rate hikes, an overweight position in American stocks is currently justified.

“S+P500 stocks have had two quarters of strong year-on-year corporate earnings and revenue growth, while the index itself has failed to pass late January’s all-time high. This suggests that valuations have fallen, reducing fears of Wall Street being over priced.”

He goes on to say: “The American stock market is diverse, and not just about the FAANGs. True, tech does make up a quarter of the index, but the category includes companies as diverse as chip makers and social media operators. Meanwhile, there is a large market of mid and small-cap stocks for investors to explore, enabling further portfolio diversity.

“The S+P500 total return index, which includes dividends re-invested, reached a new high a few weeks ago. This demonstrates the power of re-investing dividend income. Indeed, financial history demonstrates that for a long-term investor to make the highest returns, reinvesting the investment income within a portfolio is a key factor.”

The deVere CEO concludes: “The Fed is going to stick to its current trajectory of raising rates – despite Trump’s criticism. The criticism itself seems a bit odd considering it is Trump’s tax cuts and reforms that are probably the key driver of the growth spurt that is helping force the Fed to tighten monetary policy.”

About:

deVere Group is one of the world’s largest independent advisors of specialist global financial solutions to international, local mass affluent, and high-net-worth clients.  It has a network of more than 70 offices across the world, over 80,000 clients and $12bn under advisement.

Ichimoku Cloud Analysis 21.08.2018 (AUDUSD, NZDUSD, USDCAD)

Article By RoboForex.com

AUDUSD, “Australian Dollar vs US Dollar”

AUDUSD is trading at 0.7354; the instrument is moving above Ichimoku Cloud, which means that it may continue growing. The markets could indicate that the price may test the upside border of the cloud at 0.7315 and then resume moving upwards to reach 0.7435. Another signal to confirm further ascending movement is the price’s rebounding from the support level. However, the scenario that Implies further growth may be cancelled if the price breaks the downside border of the cloud and fixes below 0.7240. In this case, the pair may continue falling towards 0.7155.

AUDUSD
Risk Warning: the result of previous trading operations do not guarantee the same results in the future


NZDUSD, “New Zealand Dollar vs US Dollar”

NZDUSD is trading at 0.6668; the instrument is moving above Ichimoku Cloud, which means that it may continue growing. The markets could indicate that the price may test the upside border of the cloud at 0.6660 and then continue moving upwards to reach 0.6745. However, the scenario that implies further growth may be cancelled if the price breaks the downside border of the cloud and fixes below 0.6570. In this case, the pair may continue falling towards 0.6500. After breaking the resistance area and fixing above 0.6720, the price may continue moving upwards.

NZDUSD
Risk Warning: the result of previous trading operations do not guarantee the same results in the future


USDCAD, “US Dollar vs Canadian Dollar”

USDCAD is trading at 1.3030; the instrument is moving below Ichimoku Cloud, which means that it may continue falling. The markets could indicate that the price may test the downside border of the cloud at 1.3065 and then continue moving downwards to reach 1.2950. Another signal to confirm further descending movement is the price’s rebounding from the resistance level. However, the scenario that implies further decline may be cancelled if the price breaks the upside border of the cloud and fixes above 1.3120. In this case, the pair may continue growing towards 1.3190. After breaking the downside border of the rising channel and fixing below 1.3000, the price may continue moving downwards.

USDCAD
Risk Warning: the result of previous trading operations do not guarantee the same results in the future

Article By RoboForex.com

Attention!
Forecasts presented in this section only reflect the author’s private opinion and should not be considered as guidance for trading. RoboForex LP bears no responsibility for trading results based on trading recommendations described in these analytical reviews.

The Analytical Overview of the Main Currency Pairs on 2018.08.21

Analytics by JustForex

The EUR/USD currency pair

Technical indicators of the currency pair:
  • Prev Open: 1.14375
  • Open: 1.14808
  • % chg. over the last day: +0.47
  • Day’s range: 1.15111 – 1.15170
  • 52 wk range: 1.0571 – 1.2557

Yesterday, the bullish sentiment was observed on the EUR/USD currency pair. The growth of quotes was almost 100 points. Today, the US currency has continued to lose ground. At the moment, the key support and resistance levels are 1.14900 and 1.15300, respectively. We recommend opening positions from these marks. The trading instrument has the potential for further growth. Trade negotiations between the US and China are in the focus of attention.

The news feed on the US economy and the Eurozone is calm.

EUR/USD

The price has fixed above 50 MA and 200 MA, which indicates the power of buyers.

The MACD histogram is located in the positive zone, above the signal line, which gives a strong signal to buy EUR/USD.

Stochastic Oscillator is in the neutral zone, the %K line is below the %D line, which indicates a decrease in quotes.

Trading recommendations
  • Support levels: 1.14900, 1.14400, 1.14000
  • Resistance levels: 1.15300, 1.15700, 1.16100

If the price fixes above the resistance level of 1.15300, further growth of the EUR/USD currency pair is expected. The movement is tending to 1.15700-1.15900.

Alternative option. If the price fixes below 1.14900, we recommend considering sales of EUR/USD. The movement is tending to 1.14500-1.14300.

The GBP/USD currency pair

Technical indicators of the currency pair:
  • Prev Open: 1.27423
  • Open: 1.27944
  • % chg. over the last day: +0.46
  • Day’s range: 1.28238 – 1.28323
  • 52 wk range: 1.2361 – 1.4345

There is an upward trend on the GBP/USD currency pair. During yesterday’s and today’s trading sessions, the growth of quotes has exceeded 100 points. At the moment, the local support and resistance levels are 1.28100 and 1.28400, respectively. The positions should be opened from these marks. Investors expect current news regarding Brexit.

The news feed on the UK economy is calm.

GBP/USD

The price has fixed above 50 MA and 200 MA, which indicates the power of buyers.

The MACD histogram is in the positive zone, above the signal line, which gives a strong signal to buy GBP/USD.

Stochastic Oscillator is located in the neutral zone, the %K line is below the %D line, which signals to sell GBP/USD.

Trading recommendations
  • Support levels: 1.28100, 1.27700, 1.27200
  • Resistance levels: 1.28400, 1.28800, 1.29150

If the price fixes above 1.28400, further growth of the GBP/USD currency pair is expected. The target movement level is 1.28800-1.29150.

Alternatively, the GBP/USD quotes may decline to the level of 1.27700-1.27500.

The USD/CAD currency pair

Technical indicators of the currency pair:
  • Prev Open: 1.30598
  • Open: 1.30437
  • % chg. over the last day: -0.14
  • Day’s range: 1.30232 – 1.30351
  • 52 wk range: 1.2059 – 1.3795

Yesterday, there were sales on the USD/CAD currency pair. The decrease in quotes exceeded 70 points. At the moment, financial market participants expect additional drivers. Local support and resistance levels are 1.30200 and 1.30450, respectively. We recommend opening positions from these marks. The trading instrument has the potential for further reduce.

Publication of important news is not expected in Canada.

USD/CAD

Indicators point to the power of sellers: the price has fixed below 50 MA and 200 MA.

The MACD histogram is in the negative zone, but above the signal line, which gives a weak signal to sell USD/CAD.

Stochastic Oscillator is located in the neutral zone, the %K line is above the %D line, which indicates the USD/CAD quotes growth.

Trading recommendations
  • Support levels: 1.30200, 1.30000
  • Resistance levels: 1.30450, 1.30700, 1.31000

If the price fixes below 1.30200, the USD/CAD quotes are expected to decline. The movement is tending to 1.30000-1.29700.

Alternative option. If the price fixes above the resistance of 1.30450, it is necessary to consider purchases of USD/CAD. The movement is tending to 1.30700-1.31000.

The USD/JPY currency pair

Technical indicators of the currency pair:
  • Prev Open: 110.593
  • Open: 110.063
  • % chg. over the last day: -0.48
  • Day`s range: 110.030 – 110.101
  • 52 wk range: 104.56 – 114.74

Yesterday, the bearish sentiment prevailed on the USD/JPY currency pair. The decrease in quotes exceeded 80 points. At the moment, local support and resistance levels are 110.000 and 110.300, respectively. The positions should be opened from these marks. Financial market participants expect additional drivers. We recommend paying attention to the 10-year US government bonds yield.

The news feed on the economy of Japan is calm.

USD/JPY

Indicators point to the power of sellers: the price has fixed below 50 MA and 200 MA.

The MACD histogram is in the negative zone, but above the signal line, which gives a weak signal to sell USD/JPY.

Stochastic Oscillator is located near the overbought zone, the %K line is crossing the %D line. There are no accurate signals.

Trading recommendations
  • Support levels: 110.000, 109.750
  • Resistance levels: 110.300, 110.600, 110.900

If the price fixes above the resistance level of 110.300, the growth of the USD/JPY currency pair is expected. The movement is tending to 110.600-110.800.

Alternative option. If the price fixes below the round level of 110.000, it is necessary to consider sales of USD/JPY. The movement is tending to 109.750-109.500.

Analytics by JustForex

The Dollar Index Is Declining

by JustForex

Yesterday, the US dollar weakened against the basket of major currencies. The dollar index (#DX) closed in the negative zone (-0.31%). The US dollar was under pressure after the US President Donald Trump criticized the Fed’s policy once again. Trump is dissatisfied with the fact that the Fed Chairman, Jerome Powell, is aimed at a gradual increase in the interest rate. The president believes that the Fed should make greater contribution to the development and growth of the US economy. Today, the US currency has continued to lose ground.

At the moment, financial market participants expect negotiations between the US and China, which are likely to weaken the trade conflict. Also, negotiations between the EU and the UK regarding the future of Brexit should take place. We recommend following up-to-date news.

The “black gold” prices are moderately growing. At the moment, futures for the WTI crude oil are testing a mark of $65.50 per barrel. At 23:30 (GMT+3:00), a report on the API weekly crude oil stock will be published.

Market Indicators

Yesterday, there was a variety of trends in the US stock market: #SPY (+0.21%), #DIA (+0.36%), #QQQ (-0.09%).

At the moment, the 10-year US government bonds yield is at the level of 2.82%-2.83%.

The news feed on 2018.08.21:

Today, important economic data are not expected to be published.

by JustForex

The Australian Dollar continues strengthening. Overview for 21.08.2018

Article By RoboForex.com

AUDUSD is trading upwards and getting closer to its two-week highs.

The Australian Dollar continues growing against the USD on Tuesday. The current quote for the instrument is 0,7358.

The reason of this is that the Aussie is supported by the weakness of the American currency, which got under pressure after the US President Donald Trump criticized the Federal Reserve.

Another thing that helps the Australian Dollar to recover is the RBA Meeting Minutes. The document, which was published earlier in the morning, said that there were no reason for revising the benchmark rate in the short-term, but doing this in the future would directly depend on the labor market and the inflation in the country. Overall, the Reserve Bank of Australia is going to follow its current monetary policy.

According to the regulator, right now the Aussie is cheaper against the USD (if taking about long-term charts) than earlier, but still not cheap enough and continues trading inside the two-year trading rage. On several occasions in the past, the RBA criticized that the Aussie rate was too high and prevented the country’s GDP from growing faster.

When it came to the inflation, the RBA said the core indicator was expected to grow from the current value of 1.75% to 2.25% in 2020. It’s a good signal for the Australian currency – it means that the regulator sees improvements in the domestic demand.

Article By RoboForex.com

Attention!
Forecasts presented in this section only reflect the author’s private opinion and should not be considered as guidance for trading. RoboForex LP bears no responsibility for trading results based on trading recommendations described in these analytical reviews.

EURUSD: the price has reached the upper border of the MA channel

By Gabriel Ojimadu, Alpari

Previous:

On Monday, the 20th of August, trading on the euro closed up. Following EURUSD’s daily decline to 1.1394, growth returned with renewed force. The price was supported by speculation on the upcoming trade talks between the US and China, which will be held on the 22nd and 23rd of August. US 10-year Treasury yields fell, and demand for risky instruments has grown.

The euro recovered all previously lost positions against the dollar, updating the weekly high at 1.1491.

Day’s news (GMT+3):

  • 9:00 Switzerland: trade balance (Jul).
  • 11:30 UK: public sector net borrowing (Jul).
  • 13:00 UK: CBI industrial trends survey – orders (MoM) (Aug).
  • 15:30 Canada: wholesales sales (MoM) (Jun).
  • 23:30 US: API weekly crude oil stock (Aug 17).

Fig 1. EURUSD hourly chart. Source: TradingView.

Current situation:

My expectations were met with the drop in prices to the trend line. I didn’t even consider the pivot and recovery to 1.1491. During Asian trading, the euro rose against the dollar to 1.1542. The topic of China came to the forefront. In addition, you can factor in Trump’s disagreement with Powell on raising rates.

The price reached the upper border of the MA channel (deviation of 1% from sma 55). This means the market is ready to return to the Lb balance line. At the current bar, it is passing through 1.4311. If we calculate the drop in the average speed of the last downward correction, the price will meet Lb balance line at approximately 19:00 GMT+3.

It is also worth noting here that US President Trump does not expect much from negotiations on trade with China in Washington. On Wednesday, the US Federal Reserve will publish the minutes of the US Federal Reserve meeting. In September, another rate increase is expected.

Since the 135th degree was passed and the growth was sharp, buyers will try to update the maximum. When the price reaches U3, it either bounces and moves to lb, or moves upwards in the form of a saw tooth model. The beginning of the model can be seen in the chart.