Author Archive for InvestMacro – Page 376

The Analytical Overview of the Main Currency Pairs on 2018.08.17

Analytics by JustForex

The EUR/USD currency pair

Technical indicators of the currency pair:
  • Prev Open: 1.13464
  • Open: 1.13752
  • % chg. over the last day: +0.24
  • Day’s range: 1.13712 – 1.13775
  • 52 wk range: 1.0571 – 1.2557

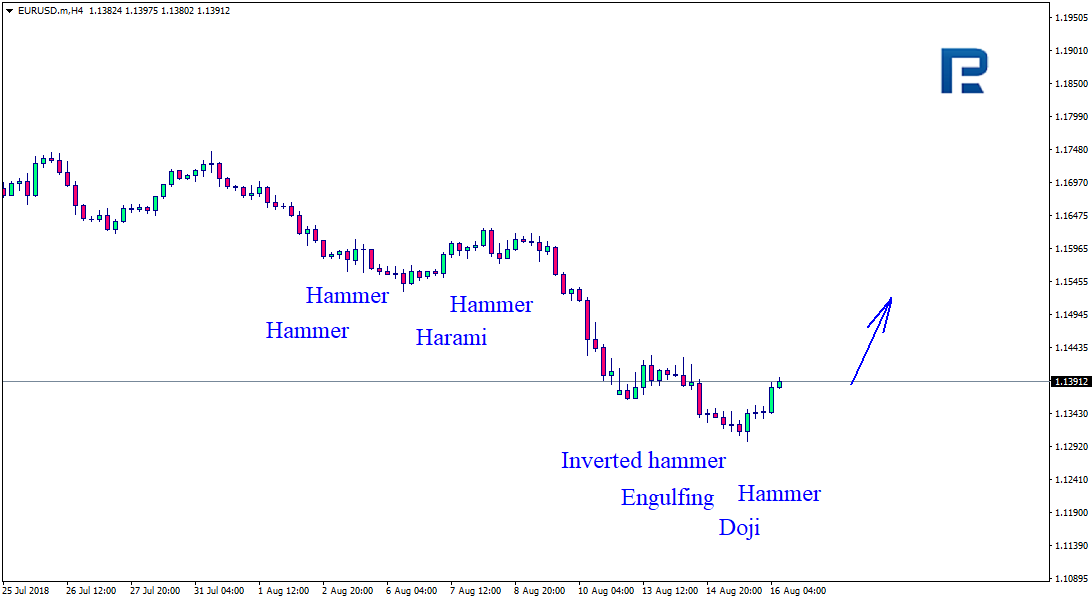
The EUR/USD currency pair began to recover. At the moment, quotes are testing the key resistance of 1.14200. The local support is 1.13700. We recommend opening positions from these marks. A trading instrument is tending to grow.

The news feed on 17.08.2018:
  • – Consumer price index in the Eurozone at 12:00 (GMT+3:00).
EUR/USD

Indicators do not send accurate signals: the price has fixed between 50 MA and 200 MA.

The MACD histogram is located in the positive zone and above the signal line, which gives a strong signal to buy EUR/USD.

Stochastic Oscillator is in the neutral zone, the %K line is above the %D line, which indicates the bullish sentiment.

Trading recommendations
  • Support levels: 1.13700, 1.13200
  • Resistance levels: 1.14200, 1.14700, 1.15200

If the price fixes above the resistance level of 1.14200, further growth of the EUR/USD currency pair is expected. The movement is tending to 1.14700-1.15000.

Alternative option. If the price fixes below 1.13700, it is necessary to look for entry points to the market to open short positions. The movement is tending to 1.13200-1.13000.

The GBP/USD currency pair

Technical indicators of the currency pair:
  • Prev Open: 1.26958
  • Open: 1.27066
  • % chg. over the last day: +0.11
  • Day’s range: 1.27060 – 1.27350
  • 52 wk range: 1.2361 – 1.4345

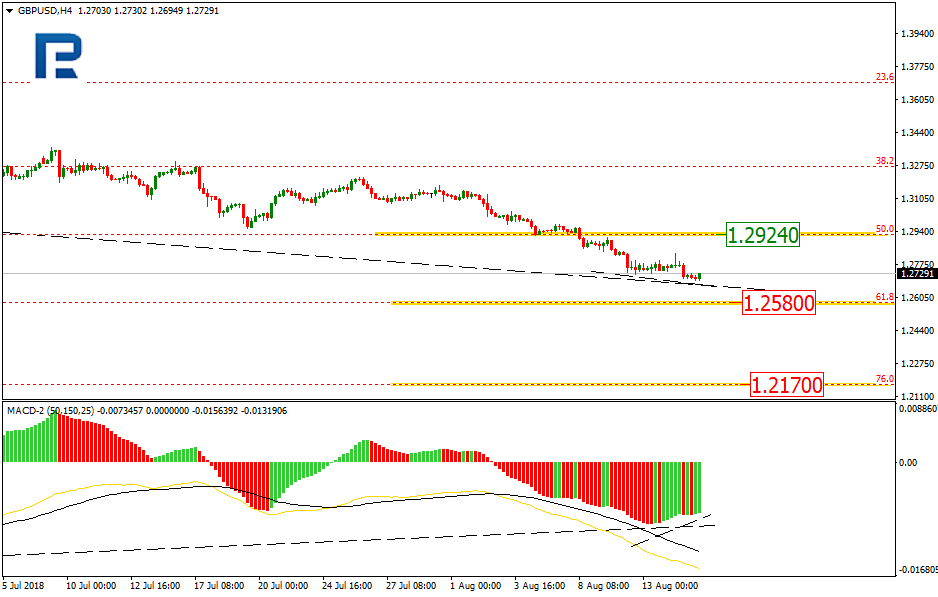
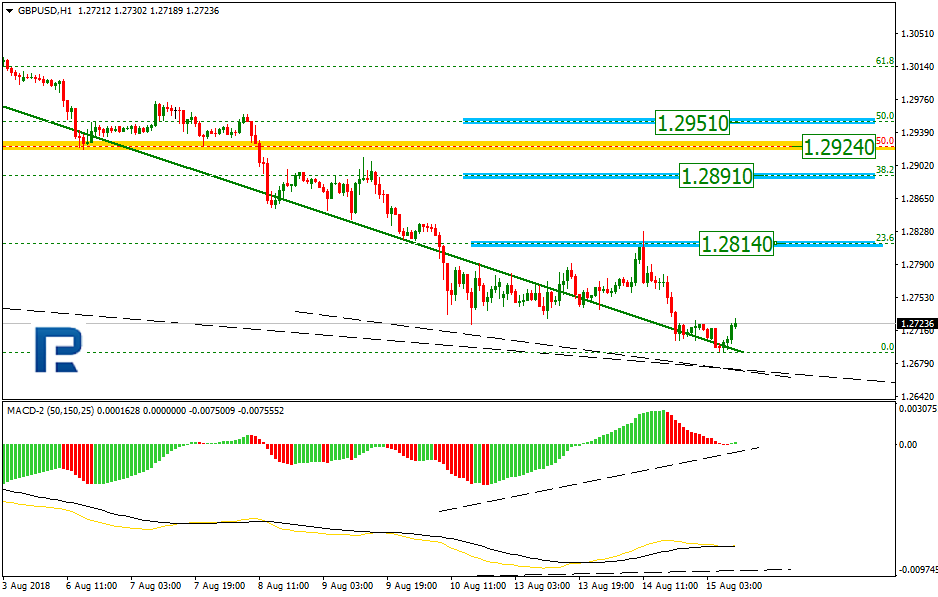
The technical pattern on the GBP/USD currency pair is ambiguous. At the moment, the quotes are in a sideways trend. The key support and resistance levels are 1.27000 and 1.27500, respectively. In the near future, we expect correction of the GBP/USD currency pair. The pound is supported by positive data on retail sales in the UK. Positions should be opened from the key levels.

The news feed on the UK economy is calm.

GBP/USD

Indicators do not send accurate signals: the price has fixed between 50 MA and 200 MA.

The MACD histogram is in the positive zone, above the signal line, which gives a strong signal to buy GBP/USD.

Stochastic Oscillator is located in the neutral zone, the %K line is below the %D line, which indicates a decrease in the GBP/USD quotes.

Trading recommendations
  • Support levels: 1.27000, 1.26600
  • Resistance levels: 1.27500, 1.28000, 1.28400

If the price fixes above 1.27500, the GBP/USD currency pair is expected to grow. The target level for profit-taking is 1.28000-1.28400.

An alternative may be a decrease in the GBP/USD quotes to the level of 1.26600-1.26400.

The USD/CAD currency pair

Technical indicators of the currency pair:
  • Prev Open: 1.31391
  • Open: 1.31537
  • % chg. over the last day: +0.14
  • Day’s range: 1.31480 – 1.31567
  • 52 wk range: 1.2059 – 1.3795

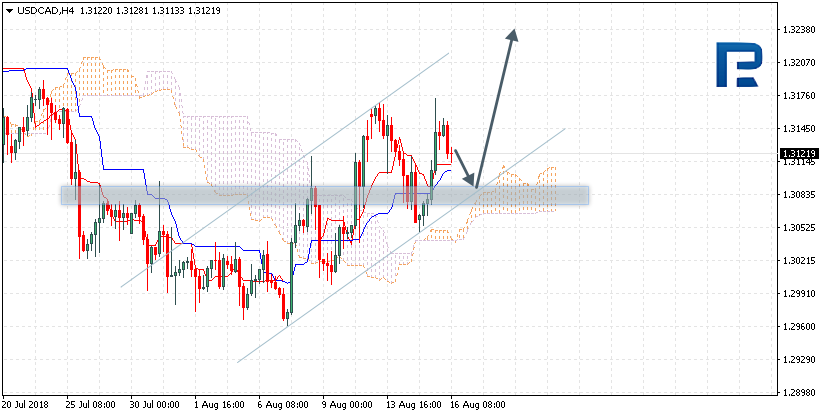
The USD/CAD currency pair is testing monthly highs. At the moment, the technical pattern is ambiguous. Financial market participants expect additional drivers. Local support and resistance levels are 1.31300 and 1.31600, respectively. We recommend opening positions from these marks. In the near future, correction of the USD/CAD quotes is not excluded.

At 15:30 (GMT+3:00), core consumer price index will be published in Canada.

USD/CAD

Indicators do not send accurate signals: the price is testing 50 MA.

The MACD histogram is in the positive zone, but below the signal line, which gives a weak signal to buy USD/CAD.

Stochastic Oscillator is located in the neutral zone, the %K line is below the %D line, which indicates a decrease in the USD/CAD quotes.

Trading recommendations
  • Support levels: 1.31300, 1.30900, 1.30500
  • Resistance levels: 1.31600, 1.32000

If the price fixes below 1.31300, the USD/CAD quotes are expected to decline. The movement is tending to 1.30900-1.30700.

Alternative option. If the price fixes above the resistance of 1.31600, it is necessary to consider purchases of USD/CAD. The movement is tending to 1.32000-1.32200.

The USD/JPY currency pair

Technical indicators of the currency pair:
  • Prev Open: 110.703
  • Open: 110.870
  • % chg. over the last day: +0.24
  • Day`s range: 110.679 – 110.735
  • 52 wk range: 104.56 – 114.74

Yesterday, there was a variety of trends on the USD/JPY currency pair. At the moment, quotes are declining. Local support and resistance levels are 110.650 and 110.900, respectively. The positions should be opened from these marks. The trading instrument has the potential for further reduce.

The news feed on the economy of Japan is calm.

USD/JPY

Indicators point to the power of sellers: the price has fixed below 50 MA and 200 MA.

The MACD histogram has moved into the negative zone, which signals the bearish sentiment.

Stochastic Oscillator is located near the oversold zone, the %K line is below the %D line, which gives a weak signal to sell USD/JPY.

Trading recommendations
  • Support levels: 110.650, 110.400, 110.150
  • Resistance levels: 110.900, 111.200, 111.500

If the price fixes above the resistance level of 110.900, the USD/JPY currency pair is expected to grow. The potential of the movement to 111.200-111.500.

Alternative option. If the price fixes below the level of 110.650, it is necessary to consider sales of USD/JPY. The movement is tending to 110.400-110.150.

Analytics by JustForex

The Dollar Index Has Moved Away from Annual Highs

by JustForex

The US dollar weakened against the basket of major currencies during yesterday’s trading. The US dollar index (#DX) closed in the negative zone (-0.10%). However, demand for the US currency is at a fairly high level. The sentiment of the financial market participants turned up after it became known that this month the US-China negotiations would be held, where the countries would try to settle the trade conflict.

Yesterday, economic data were also published. The volume of retail sales in the UK increased by 0.7% in July instead of the expected 0.2%. The number of building permits issued in the US increased by 1.5% to 1.311M in July, while experts forecasted a value of 1.310M. However, the Philadelphia Fed manufacturing index fell to 11.9 instead of 21.9. We expect statistics from the Eurozone and Canada.

The “black gold” prices are declining. At the moment, futures for the WTI crude oil are testing a mark of $65.40 per barrel.

Market Indicators

Yesterday, the bullish sentiment was observed in the US stock market: #SPY (+0.81%), #DIA (+1.66%), #QQQ (+0.33%).

At the moment, the 10-year US government bonds yield is at the level of 2.86%-2.87%.

The news feed on 2018.08.17:

– Consumer price index in the Eurozone at 12:00 (GMT+3:00);
– Core consumer price index in Canada at 15:30 (GMT+3:00).

by JustForex

EURUSD: pair set to consolidate

By Gabriel Ojimadu, Alpari

Previous:

On Thursday the 17th of August, trading on the euro closed up. News that trade talks between the US and China are set to resume later this month brought about a correction on the dollar and, in turn, the euro. Market sentiment has shifted, but the big picture is still bearish.

The rate rose to 1.1409. By close, bulls had erased most of their gains. The catalyst for the drop was the US dollar index’s (DXY) rebound from a session low of 96.32, which was a response to US data and a rise in bond yields.

US data:

  • Initial jobless claims: 212k (forecast: 215k, previous: 214k).
  • Housing starts: 1.168m.
  • Building permits: 1.311m.
  • Philadelphia Fed manufacturing survey: 11.9 (forecast: 21.9, previous: 25.7).

Day’s news (GMT+3):

  • 10:30 Australia: RBA Assistant Governor Ellis speech.
  • 11:00 Eurozone: current account (Jun).
  • 12:00 Eurozone: CPI (Jul).
  • 15:30 Canada: CPI (Jul), Canadian portfolio investment in foreign securities (Jun).
  • 17:00 US: Michigan Consumer Sentiment Index (Aug).
  • 20:00 US: Baker Hughes US oil rig count.

Fig 1. EURUSD hourly chart. Source: TradingView.

Current situation:

Yesterday turned out exactly as I expected. The bulls visited the 90th degree, from which the pair ricocheted downwards. The 90th degree isn’t a reversal level, but the rebound to resume the trend on dollar index forced the euro bulls out of the long positions they had opened on the back of the initial correction.

The drop came to an end below the 45th degree around the balance line (sma 55). Today, I’m expecting to see our pair fluctuate between 1.1348 and 1.1409. From a technical standpoint, the pair looks set to continue declining, but if you look at the growth from 1.1301 to 1.1409, you’ll notice the similarity this model shares with the current movement, just with smaller fluctuations.

The 4-hour indicators have unloaded and are now in neutral territory. The market is ready for some sharp fluctuations, although my model shows the pair dropping to 1.1350 with a subsequent rebound to 1.1379.

It’s worth paying attention to the Eurozone’s inflation data. It’s important for the ECB. If the actual figures differ from predictions significantly, it will cause a high level of volatility on the market.

Ichimoku Cloud Analysis 16.08.2018 (AUDUSD, NZDUSD, USDCAD)

Article By RoboForex.com

AUDUSD, “Australian Dollar vs US Dollar”

AUDUSD is trading at 0.7266; the instrument is moving below Ichimoku Cloud, which means that it may continue falling. The markets could indicate that the price may test Tenkan-Sen and Kijun-Sen at 0.7300 and then resume moving downwards to reach 0.7140. Another signal to confirm further descending movement is the price’s rebounding from the channel’s upside border. However, the scenario that Implies further decline may be cancelled if the price breaks the upside border of the cloud and fixes above 0.7345. In this case, the pair may continue growing towards 0.7425.

AUDUSD
Risk Warning: the result of previous trading operations do not guarantee the same results in the future


NZDUSD, “New Zealand Dollar vs US Dollar”

NZDUSD is trading at 0.6584; the instrument is moving below Ichimoku Cloud, which means that it may continue falling. The markets could indicate that the price may test Tenkan-Sen and Kijun-Sen at 0.6590 and then continue moving downwards to reach 0.6450. Another signal to confirm further descending movement is the price’s rebounding from the channel’s upside border. However, the scenario that implies further decline may be cancelled if the price breaks the upside border of the cloud and fixes above 0.6685. In this case, the pair may continue growing towards 0.6770.

NZDUSD
Risk Warning: the result of previous trading operations do not guarantee the same results in the future


USDCAD, “US Dollar vs Canadian Dollar”

USDCAD is trading at 1.3121; the instrument is moving above Ichimoku Cloud, which means that it may continue growing. The markets could indicate that the price may test the upside border of the cloud at 1.3095 and then continue moving upwards to reach 1.3240. Another signal to confirm further ascending movement is the price’s rebounding from the support level. However, the scenario that implies further growth may be cancelled if the price breaks the downside border of the cloud and fixes below 1.3050. In this case, the pair may continue falling towards 1.2960.

USDCAD
Risk Warning: the result of previous trading operations do not guarantee the same results in the future

Article By RoboForex.com

Attention!
Forecasts presented in this section only reflect the author’s private opinion and should not be considered as guidance for trading. RoboForex LP bears no responsibility for trading results based on trading recommendations described in these analytical reviews.

Japanese Candlesticks Analysis 16.08.2018 (EURUSD, USDJPY)

Article By RoboForex.com

EURUSD, “Euro vs. US Dollar”

As we can see in the H4 chart, EURUSD has formed several Inverted Hammer, Hammer, Doji, and Engulfing reversal patterns. At the moment, it may be assumed that the instrument may try start a new rising tendency.

EURUSD
Risk Warning: the result of previous trading operations do not guarantee the same results in the future


USDJPY, “US Dollar vs. Japanese Yen”

As we can see in the H4 chart, USDJPY is trading close to the support level and forming Inverted Hammer, Hammer, and Harami reversal patterns. Judging by the previous movement, it may be assumed that the instrument may complete the correction and start a new ascending tendency.

USDJPY
Risk Warning: the result of previous trading operations do not guarantee the same results in the future

Article By RoboForex.com

Attention!
Forecasts presented in this section only reflect the author’s private opinion and should not be considered as guidance for trading. RoboForex LP bears no responsibility for trading results based on trading recommendations described in these analytical reviews.

The Analytical Overview of the Main Currency Pairs on 2018.08.16

Analytics by JustForex

The EUR/USD currency pair

Technical indicators of the currency pair:
  • Prev Open: 1.13460
  • Open: 1.13464
  • % chg. over the last day: -0.02
  • Day’s range: 1.13423 – 1.13531
  • 52 wk range: 1.0571 – 1.2557

The euro began to recover. Conflict between the US and Turkey is in the focus of attention. At the moment, quotes are consolidating. Local support and resistance levels are 1.13500 and 1.14000, respectively. We recommend opening positions from these marks. In the near future, a technical correction is not ruled out.

The news feed on 16.08.2018:
  • – Statistics on the real estate market in the US at 15:30 (GMT+3:00);
  • – Philadelphia Fed manufacturing index at 15:30 (GMT+3:00).
EUR/USD

Indicators do not send accurate signals: the price is being traded between 50 MA and 200 MA.

The MACD histogram is located in the positive zone and above the signal line, which gives a strong signal to buy EUR/USD.

Stochastic Oscillator is in the neutral zone, the %K line is below the %D line, which indicates a decrease in quotes.

Trading recommendations
  • Support levels: 1.13500, 1.13000
  • Resistance levels: 1.14000, 1.14400, 1.14800

If the price fixes above the round level of 1.14000, the EUR/USD currency pair is expected to grow. The movement is tending to 1.14400-1.14600.

Alternative option. If the price fixes below 1.13500, it is necessary to look for entry points to the market to open short positions. The movement is tending to 1.13000-1.12800.

The GBP/USD currency pair

Technical indicators of the currency pair:
  • Prev Open: 1.27201
  • Open: 1.26958
  • % chg. over the last day: -0.25
  • Day’s range: 1.26929 – 1.27000
  • 52 wk range: 1.2361 – 1.4345

The technical pattern on the GBP/USD currency pair is ambiguous. Yesterday, the consumer price index was published in the UK, which counted to 2.5% in July, as investors expected. At the moment, the key support and resistance levels are 1.26900 and 1.27400, respectively. The positions should be opened from these marks.

At 11:30 (GMT+3:00) a report on retail sales will be published in the UK.

GBP/USD

Indicators do not send accurate signals: the price is testing 50 MA.

The MACD histogram is near the 0 mark.

Stochastic Oscillator is located in the neutral zone, the %K line is below the %D line, which indicates a decrease in the GBP/USD quotes.

Trading recommendations
  • Support levels: 1.26900, 1.26500
  • Resistance levels: 1.27400, 1.27900, 1.28400

If the price fixes above the 1.27400 mark, corrective movement is expected. The target level for profit-taking is 1.27900-1.28400.

An alternative may be a decrease in the GBP/USD quotes to 1.26500-1.26300.

The USD/CAD currency pair

Technical indicators of the currency pair:
  • Prev Open: 1.30567
  • Open: 1.31391
  • % chg. over the last day: +0.70
  • Day’s range: 1.31379 – 1.31312
  • 52 wk range: 1.2059 – 1.3795

Yesterday, purchases prevailed on the USD/CAD currency pair. The growth of quotes exceeded 100 points. At the moment, the technical pattern is ambiguous. Financial market participants expect additional drivers. Local support and resistance levels are 1.31100 and 1.31400, respectively. We recommend opening positions from these marks.

Today, the news feed on the economy of Canada is calm.

USD/CAD

The price has fixed above 50 MA and 200 MA, which indicates the power of buyers.

The MACD histogram is in the positive zone, but below the signal line, which gives a weak signal to buy USD/CAD.

Stochastic Oscillator is located in the neutral zone, the %K line is above the %D line, which indicates the USD/CAD quotes growth.

Trading recommendations
  • Support levels: 1.31100, 1.30700, 1.30300
  • Resistance levels: 1.31400, 1.31700

If the price fixes below 1.31100, the USD/CAD quotes are expected to correct. The movement is tending to 1.30700-1.30500.

Alternative option. If the price fixes above the resistance of 1.31400, it is necessary to consider purchases of USD/CAD. The movement is tending to 1.31700-1.31900.

The USD/JPY currency pair

Technical indicators of the currency pair:
  • Prev Open: 111.112
  • Open: 110.703
  • % chg. over the last day: -0.53
  • Day`s range: 110.766 – 110.831
  • 52 wk range: 104.56 – 114.74

Yesterday, there were aggressive sales on the USD/JPY currency pair. The decrease in quotes exceeded 80 points. Demand for safe assets rises in periods of instability in financial markets. At the moment, quotes are testing local support and resistance levels 110.700 and 110.900, respectively. The positions should be opened from these marks.

During the Asian trading session, weak data on the trade balance of Japan were published.

USD/JPY

Indicators point to the power of sellers: the price has fixed below 50 MA and 200 MA.

The MACD histogram is in the negative zone, but above the signal line, which gives a weak signal to sell USD/JPY.

Stochastic Oscillator is located in the neutral zone, the %K line is below the %D line, which indicates a decrease in USD/JPY.

Trading recommendations
  • Support levels: 110.700, 110.400, 110.150
  • Resistance levels: 110.900, 111.200, 111.500

If the price fixes above the resistance level of 110.900, the USD/JPY currency pair is expected to grow. The movement is tending to 111.200-111.500.

Alternative option. If the price fixes below the 110.700 mark, it is necessary to consider sales of USD/JPY. The movement is tending to 110.400-110.150.

Analytics by JustForex

Conflict Between the US and Turkey Is in the Spotlight

by JustForex

The US currency is being traded near annual highs. Yesterday, the US dollar index (#DX) closed the trading session with a slight decrease (-0.02%). Conflict between the US and Turkey is still in the spotlight. Ankara took retaliatory measures and imposed duties on a number of American goods. The Japanese yen has started increasing, as demand for safe assets rises in the period of financial instability. At the moment, the currency majors are consolidating.

Yesterday, economic data were published in the United Kingdom and the United States. So, the consumer price index in the UK counted to 2.5% in July, as investors expected. The core retail sales index in the US counted to 0.6% in July and was above the forecasted value of 0.4%. The volume of retail sales in the US rose by 0.5% in July instead of 0.2%. Today, during the Asian trading session, mixed data on the labor market have been published in Australia.

The “black gold” prices began to recover after a sharp decline during yesterday’s trading. At the moment, futures for the WTI crude oil are testing a mark of $65.15 per barrel.

Market Indicators

Yesterday, the bearish sentiment was observed in the US stock market: #SPY (-0.75%), #DIA (-0.57%), #QQQ (-1.22%).

At the moment, the 10-year US government bonds yield is at the level of 2.86%-2.87%.

The news feed on 2018.08.16:

– Report on retail sales in the UK at 11:30 (GMT+3:00);
– Statistics on the real estate market in the US at 15:30 (GMT+3:00);
– Philadelphia Fed manufacturing index at 15:30 (GMT+3:00).

by JustForex

EURUSD: technical setup on the euro favours the bears

By Gabriel Ojimadu, Alpari

Previous:

On Wednesday the 15th of August, trading on the euro closed slightly up. On the back of some partial profit-taking following the pair’s recent collapse, the pair has now recovered from 1.1301 to 1.1345. The Turkish lira has stabilised at around 6 lira to the US dollar, which, along with the downwards correction on the dollar in response to the drop in US bond yields, has provided the euro with a boost.

Day’s news (GMT+3):

  • 11:30 UK: retail sales (Jul).
  • 12:00 Eurozone: trade balance (Jun).
  • 15:30 Canada: manufacturing shipments (Jun).
  • 15:30 US: Philadelphia Fed manufacturing survey (Aug), initial jobless claims (6 Aug), building permits (Jul), housing starts (Jul).

Fig 1. EURUSD hourly chart.

Current situation:

The Turkish lira is no longer interfering with the euro. It rose following reports that Qatar has pledged to make direct investment in Turkey to the tune of 15bn USD.

In Asia, the euro has recovered to 1.1391 with some help from the crosses. This marks a 67-degree rebound from 1.1301. On the technical side of things, the euro is sitting pretty at the upper boundary of the downwards channel. Under such conditions, I recommend placing a stop level at 1.1440.

Since this is a big stop level for me (around 50 pips), I’m going to wait for the pair to approach the 90thdegree. Here, I’m relying on yesterday’s long-legged doji. After such a candlestick, one would expect to see a 50% correction followed by renewed growth. Since this morning’s growth started without a pullback, I expect the euro to drop to 1.1362/65 followed by a session rally to 1.1408.

Beware, this growth scenario goes against the trend and may not work out. There’s still a lot of pressure on the euro. Keep an eye on the movements of US bond yields, the Turkish lira, and the euro crosses. I don’t see any important news releases for today.

Forex Technical Analysis & Forecast 15.08.2018 (EURUSD, GBPUSD, USDCHF, USDJPY, AUDUSD, USDRUB, GOLD, BRENT)

Article By RoboForex.com

EURUSD, “Euro vs US Dollar”

EURUSD has rebounded from 1.1432 and broken the downside border of the range; it has almost formed a downside continuation pattern. The target of the current descending wave is at 1.1238. Possibly, today the pair may fall to reach the target at 1.1300 and then test 1.1330 from below. Later, the market may resume falling inside the downtrend.

EURUSD
Risk Warning: the result of previous trading operations do not guarantee the same results in the future


GBPUSD, “Great Britain Pound vs US Dollar”

GBPUSD has rebounded from 1.2815 and broken the range downwards. Possibly, the pair may continue the downtrend towards 1.2600.

GBPUSD
Risk Warning: the result of previous trading operations do not guarantee the same results in the future


USDCHF, “US Dollar vs Swiss Franc”

USDCHF is forming another ascending impulse with the target at 0.9980. Later, the market may form a new consolidation range, break it to the upside, and then continue growing with the short-term target at 1.0060.

USDCHF
Risk Warning: the result of previous trading operations do not guarantee the same results in the future


USDJPY, “US Dollar vs Japanese Yen”

USDJPY is still moving upwards. Possibly, the pair may form another ascending structure to reach 111.66. After that, the instrument may resume trading inside the downtrend with the target at 110.50.

USDJPY
Risk Warning: the result of previous trading operations do not guarantee the same results in the future


AUDUSD, “Australian Dollar vs US Dollar”

AUDUSD has broken 0.7275 and formed a downside continuation pattern. Today, the price may reach 0.7100.

AUDUSD
Risk Warning: the result of previous trading operations do not guarantee the same results in the future


USDRUB, “US Dollar vs Russian Ruble”

USDRUB is still forming the first descending wave. Possibly, today the pair may fall to reach 65.74 and then grow towards 67.00. Later, the market may resume falling inside the downtrend with the target at 64.00.

USDRUB
Risk Warning: the result of previous trading operations do not guarantee the same results in the future


XAUUSD, “Gold vs US Dollar”

Gold has broken 1192.00 and may continue falling inside the downtrend towards 1169.00. Today, the price may form a new descending structure to reach 1184.00 and then grow to return to 1192.00. After that, the instrument may resume trading downwards.

GOLD
Risk Warning: the result of previous trading operations do not guarantee the same results in the future


BRENT

Brent has completed the first ascending impulse along with the correction. Possibly, today the pair may form the second impulse towards the short-term target at 75.85. Later, the market may be corrected to reach 73.85.

BRENT
Risk Warning: the result of previous trading operations do not guarantee the same results in the future

Article By RoboForex.com

Attention!
Forecasts presented in this section only reflect the author’s private opinion and should not be considered as guidance for trading. RoboForex LP bears no responsibility for trading results based on trading recommendations described in these analytical reviews.

Fibonacci Retracements Analysis 15.08.2018 (GBPUSD, EURJPY)

Article By RoboForex.com

GBPUSD, “Great Britain Pound vs US Dollar”

As we can see in the H4 chart, GBPUSD is still moving downwards to reach the retracements of 61.8% and 76.0% at 1.2580 and 1.2170 respectively. At the same time, the convergence is being formed, which may indicate a possible pullback in the future after the instrument reaches its short-term targets.

GBPUSD1
Risk Warning: the result of previous trading operations do not guarantee the same results in the future

The H1 chart shows more detailed structure of the current short-term convergence. The targets of the correction that may follow are the retracements of 23.6%, 38.2% and 50.0% at 1.2814, 1.2891, and 1.2951 respectively.

GBPUSD1
Risk Warning: the result of previous trading operations do not guarantee the same results in the future


EURJPY, “Euro vs. Japanese Yen”

As we can see in the H4 chart, EURJPY is forming a new descending impulse; it has already been corrected to the downside by 76.0% and is getting closer towards the short-term low at 124.62. if the price breaks the low, the downtrend may continue to reach the post-correctional extension area between the retracements of 138.2% and 161.8% at 121.80 and 120.10 respectively.

EURJPY1
Risk Warning: the result of previous trading operations do not guarantee the same results in the future

In the H1 chart, the pair is being corrected upwards after completing another descending impulse. By now, the correction has already reached the retracement of 38.2%. The next downside targets are the retracements of 50.0% and 61.8% at 127.29 and 127.66 respectively.

EURJPY2
Risk Warning: the result of previous trading operations do not guarantee the same results in the future

Article By RoboForex.com

Attention!
Forecasts presented in this section only reflect the author’s private opinion and should not be considered as guidance for trading. RoboForex LP bears no responsibility for trading results based on trading recommendations described in these analytical reviews.