Analytics by JustForex
The EUR/USD currency pair
- Prev Open: 1.13268
- Open: 1.12864
- % chg. over the last day: -0.27
- Day’s range: 1.12670 – 1.12825
- 52 wk range: 1.1299 – 1.2557
There is the bearish sentiment on the EUR/USD currency pair. The US dollar strengthened against the euro after Fed Vice Chairman, Richard Clarida, said that he supported a procedure for a gradual interest rate rise. Today, investors expect important economic statistics from the United States. Currently, local support and resistance levels are 1.12650 and 1.13000, respectively. Positions should be opened from these marks. Quotes have the potential for further decline.
- – Preliminary data on the US GDP at 15:30 (GMT+2:00);
- – Report on new home sales in the US at 17:00 (GMT+2:00).
We also recommend paying attention to the speech by Fed Chairman Powell.

Indicators point to the power of sellers: the price has fixed below 50 MA and 200 MA.
The MACD histogram is in the negative zone and continues to decline, which gives a strong signal to sell EUR/USD.
Stochastic Oscillator is in the neutral zone, the %K line is below the %D line, which indicates the bearish sentiment.
- Support levels: 1.12650, 1.12300
- Resistance levels: 1.13000, 1.13300, 1.13700
If the price fixes below 1.12650, a further drop in the EUR/USD quotes is expected. The movement is tending to 1.12300-1.12000.
An alternative may be the EUR/USD currency pair growth to the level of 1.13300-1.13500.
The GBP/USD currency pair
- Prev Open: 1.28059
- Open: 1.27415
- % chg. over the last day: -0.72
- Day’s range: 1.27329 – 1.27533
- 52 wk range: 1.2662 – 1.4378
Yesterday, the bearish sentiment was observed on the GBP/USD currency pair. Quotes fell by almost 80 points. The British pound is under pressure after the new Brexit deal has been criticized. Currently, the local support and resistance levels are 1.27300 and 1.27750, respectively. Positions should be opened from these marks. The trading instrument has the potential for further decline.
Today the publication of important economic reports from the UK is not planned.

Indicators point to the power of sellers: the price is being traded below 50 MA and 200 MA.
The MACD histogram is in the negative zone, but above the signal line, which gives a weak signal to sell GBP/USD.
Stochastic Oscillator is in the neutral zone, the %K line has crossed the %D line. There are no signals.
- Support levels: 1.27300, 1.27000
- Resistance levels: 1.27750, 1.28000, 1.28300
If the price fixes below the support level of 1.27300, a further drop in the GBP/USD quotes is expected. The movement is tending to 1.27000-1.26700.
An alternative may be the GBP/USD currency pair recovery to the round level of 1.28000.
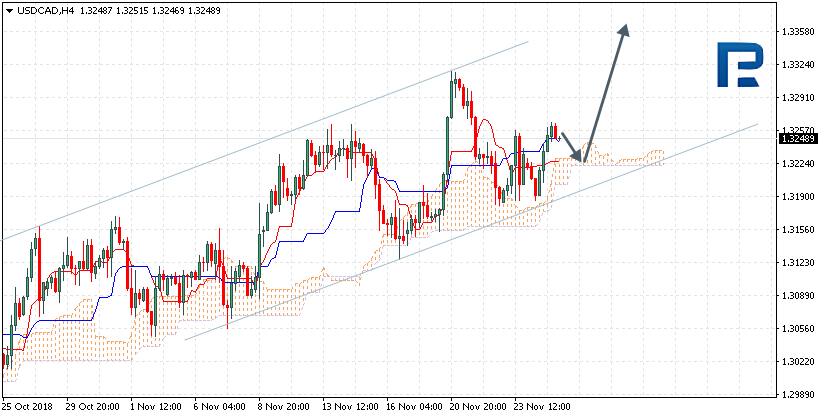
The USD/CAD currency pair
- Prev Open: 1.32504
- Open: 1.32922
- % chg. over the last day: +0.35
- Day’s range: 1.33200 – 1.33316
- 52 wk range: 1.2248 – 1.3387
The bullish sentiment prevails on the USD/CAD currency pair. During yesterday’s and today’s trading sessions, quotes have risen by more than 70 points. At the moment, the key support and resistance levels are 1.33000 and 1.33350, respectively. Positions should be opened from these marks. We recommend paying attention to the economic reports from the United States.
The news feed on the economy of Canada is calm.

Indicators point to the power of buyers: the price is being traded above 50 MA and 200 MA.
The MACD histogram is in the positive zone, above the signal line, which gives a strong signal to buy USD/CAD.
The Stochastic Oscillator is located near the overbought zone, the %K line is crossing the %D line. There are no accurate signals.
- Support levels: 1.33000, 1.32700, 1.32400
- Resistance levels: 1.33350, 1.33500
If the price fixes above the resistance level of 1.33350, it is necessary to consider purchases of USD/CAD. The movement is tending to 1.33500-1.33800.
Alternative option. If the price fixes below the round level of 1.33000, we recommend looking for entry points to the market to open short positions. The movement is tending to 1.32700-1.32500.
The USD/JPY currency pair
- Prev Open: 113.566
- Open: 113.766
- % chg. over the last day: +0.18
- Day’s range: 113.823 – 113.846
- 52 wk range: 104.56 – 114.74
The USD/JPY currency pair continues to show positive dynamics. At the moment, quotes are consolidating. Local support and resistance levels are 113.700 and 113.900, respectively. The trading instrument has the potential for further growth. Economic reports from the US, as well as the speech by the Fed chairman, are in the focus of attention.
Publication of important economic reports from Japan is not planned.

Indicators point to the power of buyers: the price has fixed above 50 MA and 200 MA.
The MACD histogram is in the positive zone, but below the signal line, which gives a strong signal to buy USD/JPY.
Stochastic Oscillator is in the neutral zone, the %K line is below the %D line, which indicates the bearish sentiment.
- Support levels: 113.700, 113.450, 113.200
- Resistance levels: 113.900, 114.100
If the price fixes above the local resistance of 113.900, further growth of the USD/JPY quotes is expected. The movement is tending to 114.100-114.300.
An alternative may be the USD/JPY currency pair correction to 113.500-113.300.
Analytics by JustForex