Currencies from the Antipodes have been performing pretty strong recently. AUD and NZD are in mid-term upwards trends on most of the pairs available on the market. In this piece, we will focus on AUDJPY, which gave us a proper buy signal yesterday.
It all started at the end of October, when the price created a double bottom formation on the horizontal support around 78.7. After this, the price reversed, ending the long-term downwards trend. On the 6th of November, AUDJPY broke the mid-term downwards trend line (red) and after this, created a flag pattern (blue lines). The flag is a trend continuation formation, so the breakout to the upside was expected. After defending the downwards trend line as a support twice, the price went higher targeting the upper line of the flag. The breakout happened yesterday and was relatively fast. That breakout, from the technical point of view, is a trigger to go long here.
Today, we have a small reversal, which is absolutely normal. The buy signal is ON as long as we stay above the upper line of the flag formation. If the price were to go back below, we would have a bearish sign, but this scenario is less likely to happen at the moment.
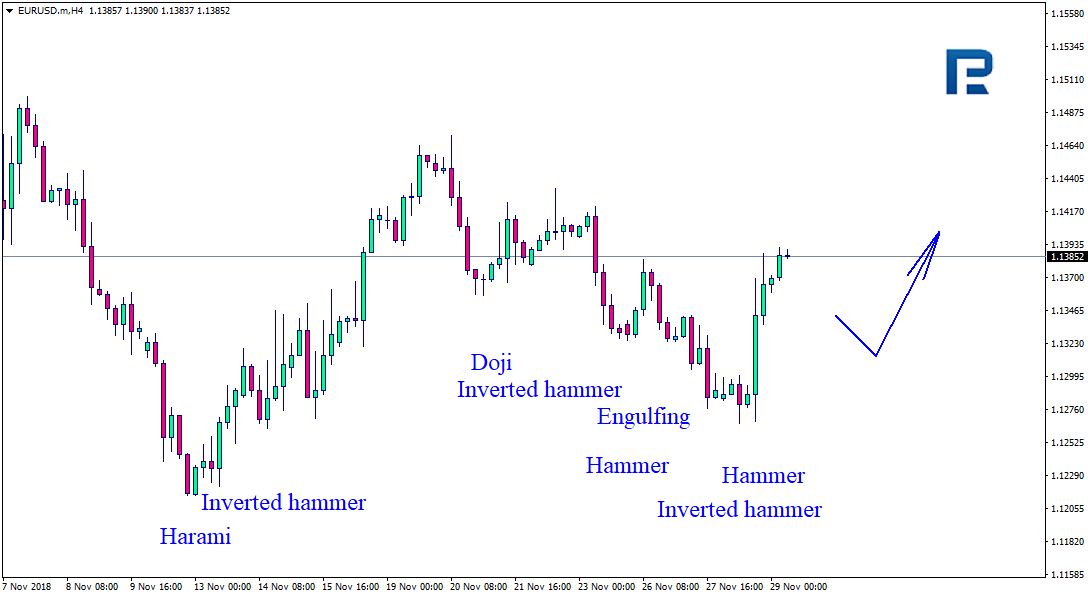
As we can see in the H4 chart, EURUSD has rebounded from the resistance level once again and formed Hammer, Engulfing, and Inverted Hammer reversal patterns. Judging by the previous movements, at the moment it may be assumed that after finishing the correction the instrument may continue moving to the upside.
USDJPY, “US Dollar vs. Japanese Yen”
As we can see in the H4 chart, USDJPY has rebounded from the resistance level and formed Doji, Harami, and Engulfing reversal patterns. Judging by the previous movements, at the moment it may be assumed that after completing the pullback the instrument may continue its ascending tendency.
Attention! Forecasts presented in this section only reflect the author’s private opinion and should not be considered as guidance for trading. RoboForex LP bears no responsibility for trading results based on trading recommendations described in these analytical reviews.
It has come to the attention of Admiral Markets UK Ltd. that a clone website has been claiming to operate under the name Admiral Markets UK Ltd. These scammers have published a website at the domain https://admiral-markets.com/FR/
This company has also been publishing ads on social media and have active sales staff following up with people who register on their website.
Admiral Markets is not associated with nor related to this clone website and strongly advises everyone to avoid it entirely. Admiral Markets has taken actions with relevant regulators, as the clone website appears to be a fraud.
Admiral Markets is fully regulated by the Financial Conduct Authority (FCA Register No. 595450) and follows all requirements and laws regulating the industry. Any other unauthorised persons, companies or websites using the Admiral Markets brand for fraudulent activities, not only break the applicable laws, but also do not comply with the basic rules of investor protection, information disclosure, claims handling and other regulatory obligations.
About Admiral Markets
Admiral Markets is a leading online Forex and CFD trading provider. In addition to a wide range of financial instruments, Admiral Markets offers free educational materials, including analytics, webinars and seminars.
***
Risk disclosure: Trading in financial markets on margin carries a high level of risk and losses may exceed your initial deposit. Admiral Markets UK Ltd. recommends you seek advice from an independent financial advisor to ensure that you understand the risks involved with Forex, CFDs and margin trading (https://admiralmarkets.com/risk-disclosure).
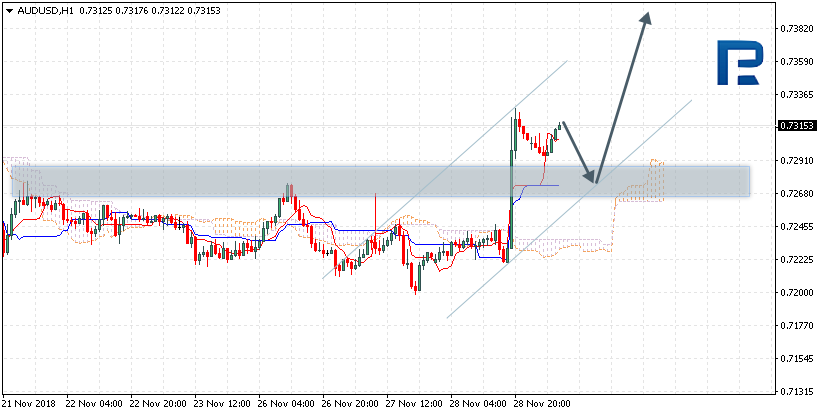
AUDUSD is trading at 0.7315; the instrument is moving above Ichimoku Cloud, thus indicating an ascending tendency. The markets could indicate that the price may test Tenkan-Sen and Kijun-Sen at 0.7270 and then resume moving upwards to reach 0.7405. Another signal to confirm further ascending movement is the price’s rebounding from the channel’s downside border. However, the scenario that Implies further growth may be cancelled if the price breaks the downside border of the cloud and fixes below 0.7220. In this case, the pair may continue falling towards 0.7125.
NZDUSD, “New Zealand Dollar vs US Dollar”
NZDUSD is trading at 0.6864; the instrument is moving above Ichimoku Cloud, thus indicating an ascending tendency. The markets could indicate that the price may test the upside border of the cloud at 0.6825 and then resume moving upwards to reach 0.6940. Another signal to confirm further ascending movement is the price’s rebounding from the channel’s downside border. However, the scenario that Implies further growth may be cancelled if the price breaks the downside border of the cloud and fixes below 0.6780. In this case, the pair may continue falling towards 0.6685.
USDCAD, “US Dollar vs Canadian Dollar”
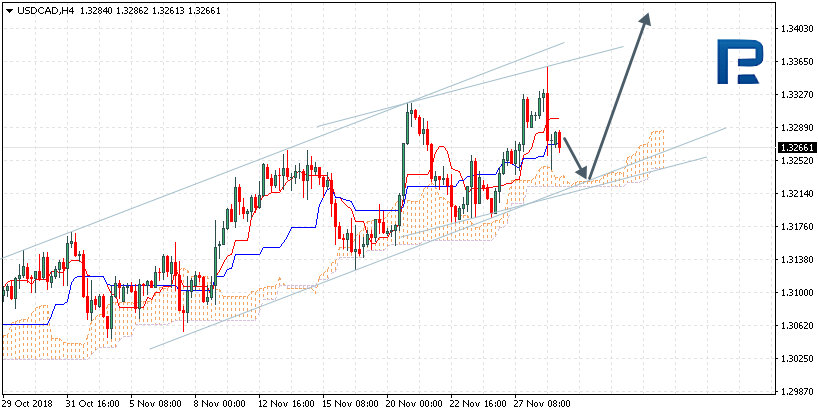
USDCAD is trading at 1.3266; the instrument is moving above Ichimoku Cloud, thus indicating an ascending tendency. The markets could indicate that the price may test the upside border of the cloud at 1.3225 and then resume moving upwards to reach 1.3410. Another signal to confirm further ascending movement is the price’s rebounding from the channel’s downside border. However, the scenario that implies further growth may be cancelled if the price breaks the downside border of the cloud and fixes below 1.3200. In this case, the pair may continue falling towards 1.3105.
Attention! Forecasts presented in this section only reflect the author’s private opinion and should not be considered as guidance for trading. RoboForex LP bears no responsibility for trading results based on trading recommendations described in these analytical reviews.
Yesterday, EUR/USD was showing aggressive purchases. USD is weakened against the EUR after the release of the weak economic stats and statements by the head of the Federal Reserve. EUR/USD quotes grew by more than 100 points. At the moment, the local support and resistance levels are 1.13700 and 1.14000. Positions should be opened from these levels. Quotes have a tendency to grow further.
The news feed on 29.11.2018:
– Unemployment Change in Germany (EU) – 10:55 (GMT+2:00);
– Pending Home Sales (US) – 17:00 (GMT+2:00);
– FOMC Minutes Release (US) – 21:00 (GMT+2:00).
Indicators point to the power of buyers: the price has fixed above 50 MA and 200 MA.
The MACD histogram is in the positive zone but below the signal line, which gives a weak signal to sell EUR/USD.
Stochastic Oscillator is in the neutral zone, the %K line is below the %D line, which indicates the bearish sentiment.
Trading recommendations
Support levels: 1.13700, 1.13400, 1.13100
Resistance levels: 1.14000, 1.14300, 1.14550
If the price fixes above 1.14000, the EUR/USD quotes can grow further. The movement is tending to 1.14300-1.14550.
Alternatively, the EUR/USD can fall toward 1.13400-1.13100.
The GBP/USD currency pair
Technical indicators of the currency pair:
Prev Open: 1.27415
Open: 1.28235
% chg. over the last day: +0.56
Day’s range: 1.27790 – 1.28345
52 wk range: 1.2662 – 1.4378
Yesterday, GBP/USD market was in a bullish mood. The quotes have grown by 80 points. Currently the quotes are descending and testing the 1.27750 support. The resistance is at 1.28300. Positions should be opened from the key levels, the quotes can descend further.
Today we do not expect any publication of important economic reports from the UK.
Indicators do not provide precise signals: the price is being traded between 50 MA and 200 MA.
The MACD histogram is in the positive zone, but below the signal line, which gives a weak signal to buy GBP/USD.
Stochastic Oscillator is in the neutral zone, the %K line has is below the %D line, which indicates a bearish sentiment.
Trading recommendations
Support levels: 1.27750, 1.27400
Resistance levels: 1.28300, 1.28700, 1.29000
If the price fixes below the mirror support level of 1.27750, a further drop in the GBP/USD quotes is expected. The movement is tending to 1.27400-1.27000.
Alternatively, GBP/USD can correct to the round level of 1.28300-1.28500.
The USD/CAD currency pair
Technical indicators of the currency pair:
Prev Open: 1.32922
Open: 1.32725
% chg. over the last day: -0.14
Day’s range: 1.32533 – 1.32723
52 wk range: 1.2248 – 1.3387
Yesterday the USD/CAD market was in a bearish mood. At the moment the picture is ambiguous. The quotes are moving sideways. The local support and resistance are 1.32500 and 1.32850. Positions should be opened from these levels. Also, keep an eye on the oil quotes` dynamic.
The news feed on the economy of Canada is calm.
Indicators do not provide precise signals, the price is being traded between 50 MA and 200 MA.
The MACD histogram is in the negative zone, below the signal line, which gives a strong signal to sell USD/CAD.
The Stochastic Oscillator is in the neutral zone, the %K line is above the %D line, which indicates a bullish sentiment.
Trading recommendations
Support levels: 1.32500, 1.32150, 1.31800
Resistance levels: 1.32850, 1.33150, 1.33500
If the price fixes above the support level of 1.32500, you should consider selling USD/CAD. The movement is tending to 1.32150-1.31800.
Alternatively, the price fixes above 1.32850 and you should look for the market entry points to open long positions. The movement will tend toward 1.33150-1.33500.
The USD/JPY currency pair
Technical indicators of the currency pair:
Prev Open: 113.766
Open: 113.672
% chg. over the last day: -0.19
Day’s range: 113.327 – 113.375
52 wk range: 104.56 – 114.74
USD/JPY is in a downward trend. The local support and resistance are 113.200 and 113.450. The quotes can descend further. You should keep an eye on the 10-year yield of the US Treasury bonds.
Publication of important economic reports from Japan is not planned.
Indicators do not provide precise signals, the price has fixed between 50 MA and 200 MA.
The MACD histogram is in the negative zone, below the signal line, which gives a strong signal to sell USD/JPY.
Stochastic Oscillator is in the neutral zone, the %K line is above the %D line, which indicates the bullish sentiment.
Trading recommendations
Support levels: 113.200, 112.900, 112.650
Resistance levels: 113.450, 113.700, 114.000
If the price fixes below the local support of 113.200, further growth of the USD/JPY quotes is expected. The movement is tending to 112.900-112.650..
An alternative may be the USD/JPY currency pair growth to 113.700-114.000.
The USD is weakened against the basket of major currencies after the US published weak economic stats, as well as the statements by the head of the Federal Reserve. For example, GDP increased in the third quarter by 3.5% instead of the expected 3.6%. The sales of the new real estate in October also lowered to 544K instead of the 583K. The USD index (#DX) closed in the red (-0,62%).
Jerome Powell, the head of the Federal Reserve, unexpectedly stated that the key interest rates are “somewhat lower” than the neutral level. This means that the official has changed his position regarding the interest rate since back in October he stated that it had been far from the neutral level. According to him, the further course of the monetary policy is still undetermined and will depend on the macroeconomic indicators. You should keep an eye on the FOMC minutes once they are published.
Prices on oil are lowering while the US oil reserves are growing. The WTI futures are testing the 50.55 USD/barrel mark.
Market Indicators
Yesterday the US stock market was showing agressive purchases: #SPY (+2,30%), #DIA (+2,56%), #QQQ (+3,22%).
The 10-year US government bonds yield is lowering. At the moment it is at 3.01-3.02%.
The Economic News Feed for 29.11.2018:
– Unemployment Change in Germany (EU) – 10:55 (GMT+2:00);
In Wednesday’s US session, the euro jumped sharply against the greenback. The US dollar index collapsed after Fed Chair Jerome Powell’s speech. He said that the key rate is “just below” the neutral level. This surprised investors given that just in early October, Powell had said that the rate is “a long way” from neutral. His remarks have increased speculation that the rate hike trajectory may now slow down.
According to CME FedWatch, the likelihood of a 25 base point rate hike is 82.7%. The current range of the Federal Funds rate is 2.00 – 2.25%.
16:30 US: personal consumption expenditures – price index (Oct), personal spending (Oct), personal income (Oct), initial jobless claims (23 Nov).
18:00 US: pending home sales (Oct).
22:00 US: FOMC minutes.
Fig 1. EURUSD hourly chart.
Current situation:
By the end of yesterday’s trading sessions, the euro had gained 100 pips against the dollar to reach 1.1370. After a minor pullback, the bulls pushed further to reach a new high of 1.1392 in today’s Asian session.
The pair has broken out of the downwards channel and stopped at the 112th degree. The market situation looks contradictory to me. On the one hand, the bulls have opened the way towards 1.1420, while on the other hand, the 112th degree is sitting at the high from the 26th of November. Moreover, the 112th degree is a reversal level, making it a strong resistance. Hourly indicators are also hinting at a correction. We need to keep an eye on 1.1368. If this level doesn’t hold strong, the drop will continue to 1.1350 (blue channel).
We’ll start Wednesday with a piece about CADCHF, and although this is not a major pair, it has a really interesting trading setup. In trading, you should always look for good opportunities on various instruments. Sticking only to one pair will surely cause more harm than good. Sometimes you will force yourself to trade even when there’s no proper setup, which can lead to serious losses. To avoid that, look for the best setups elsewhere. And this is the part where I introduce you to CADCHF. We actually did this previously on the 19th of November, and on that day we were bearish:
“This is really interesting especially considering the price is breaking the lower line of the smaller triangle as we speak, which may be a proper signal to go short.”
Since then, the price has declined nicely. The movement is very technical. After an initial drop, we had a bullish correction, which stopped on the first important horizontal resistance (green). The bounce from this level was really sweet. The price created two pin bars (yellow, long heads), which indicated a rejection of those higher prices. After this, the price went down. Wednesday has brought us new weekly lows and the chances of this movement being extended are very high.
The potential target is on the lower line of the giant symmetrical triangle pattern, so the risk-to-reward ratio is still awesome. In this case, we are talking about the 130 pips in profit, which for CADCHF is a lot!
EURUSD has broken its consolidation range to the downside and reached the short-term target of the third descending wave; right now, it is consolidating. Possibly, today the pair may be corrected to reach 1.1324 and then fall with the short-term target at 1.1266.
GBPUSD, “Great Britain Pound vs US Dollar”
GBPUSD is still forming the fifth descending structure with the target at 1.2650. Today, the pair may grow towards 1.2777. After that, the instrument may fall to reach 1.2696 and then form one more ascending structure to return to 1.2777. Later, the market may resume falling inside the downtrend towards the above-mentioned target.
USDCHF, “US Dollar vs Swiss Franc”
USDCHF has reached the short-term upside target. Possibly, today the pair may be corrected towards 0.9967 and then start another growth to reach 1.0007. Later, the market may form a new correction to return to 0.9967 and then resume trading upwards with the target at 1.0063.
USDJPY, “US Dollar vs Japanese Yen”
USDJPY has completed the third ascending wave at 113.85. Possibly, today the pair may form a new descending structure towards 113.24 and then resume trading upwards to reach 114.17, thus forming form the Double Top pattern.
AUDUSD, “Australian Dollar vs US Dollar”
AUDUSD is consolidating around 0.7230. Today, the pair may break this level downwards and reach the target at 0.7185. And that’s just a half of the third descending wave. The key target is at 0.7100.
USDRUB, “US Dollar vs Russian Ruble”
USDRUB is consolidating at the top. Possibly, today the pair may fall to break 65.60 and then continue forming the third descending wave with the short-term target at 64.00.
XAUUSD, “Gold vs US Dollar”
Gold has completed the first descending wave; right now, it is consolidating. Possibly, the pair may be corrected upwards to reach 1220.50. After that, the instrument may continue trading inside the downtrend with the short-term target at 1197.80.
BRENT
Brent is forming the first ascending impulse towards 61.50. Later, the market may form a new descending structure to reach 59.95 and then resume growing towards the short-term target of the first ascending wave at 66.70.
Attention! Forecasts presented in this section only reflect the author’s private opinion and should not be considered as guidance for trading. RoboForex LP bears no responsibility for trading results based on trading recommendations described in these analytical reviews.
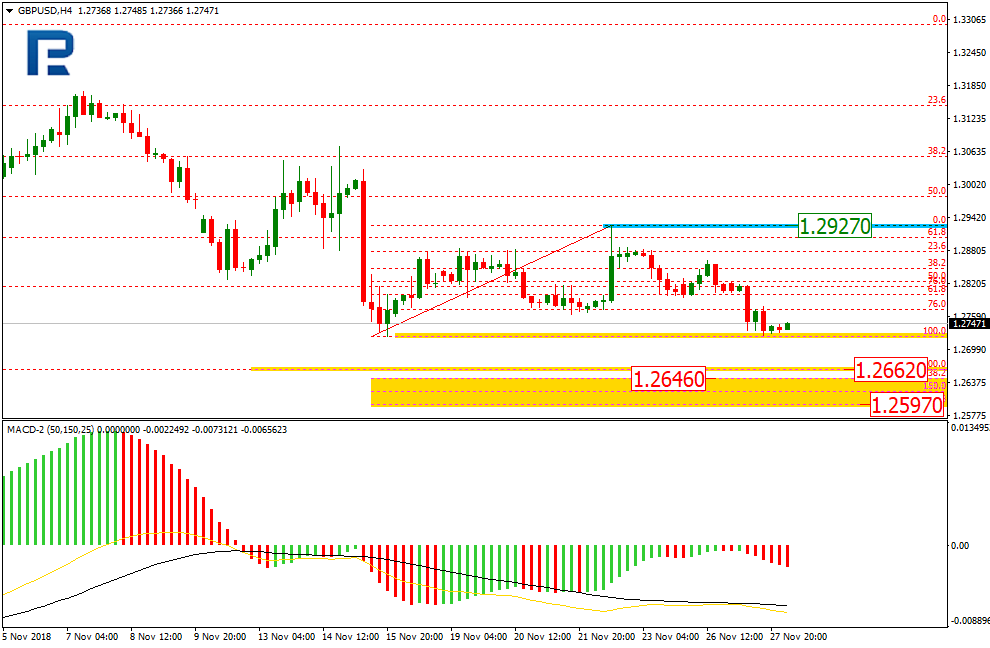
As we can see in the H4 chart, GBPUSD is testing the local low and may break it. In this case, the pair may fall towards the mi-term support at 1.2662 and then enter the post-correctional extension area between the retracements of 138.2% and 161.8% at 1.2646 and 1.2597 respectively. The resistance is at 1.2927.
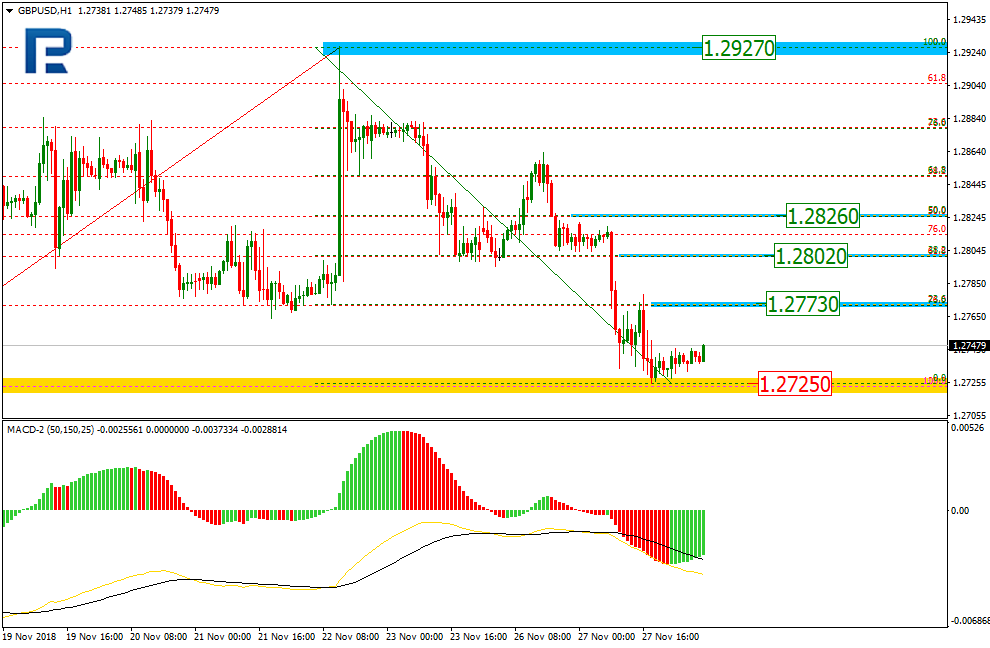
In the H1 chart, GBPUSD may be corrected towards the retracements of 23.6%. 38.2%, and 50.0% at 1.2773, 1.2802, and the 1.2826 respectively. If the price breaks the low at 1.2725, the downtrend may continue to reach its mid-term targets.
EURJPY, “Euro vs. Japanese Yen”
As we can see in the H4 chart, EURJPY continues moving sideways. Hence, the pair may break both the resistance and the support. In case it breaks the high at 129.23, the price may start a new ascending impulse towards 130.15. However, if the price breaks the support at 127.50, the instrument may fall to reach the key low at 126.63, which is inside the post-correctional extension area between the retracements of 138.2% and 161.8% at 126.84 and 126.43 respectively.
In the H1 chart, the pair is still forming the ascending impulse towards the local high at 128.91. If the price breaks it, the instrument will continue growing to reach the post-correctional extension area between the retracements of 138.2% and 161.8% at 129.13 and 129.27 respectively. The support level is at 128.35.
Attention! Forecasts presented in this section only reflect the author’s private opinion and should not be considered as guidance for trading. RoboForex LP bears no responsibility for trading results based on trading recommendations described in these analytical reviews.