Yesterday USD slightly strengthened against the basket of major currencies. The USD index (#DX) closed in the green (0.16%). The high possibility of a full-on trading war between the US and China is in the spotlight. The US President, Donald Trump, increased the import tax on the Chinese ware that cost more than $200 billion up to 25% instead of the current 10%. The financial market participants are waiting for the meeting between the leaders of China and the United States during the G20 summit.
EUR stabilized after the differences between Italy and the EU due to the Italian budget project can soon be resolved. Matteo Salvini announced that the Italian government would lower the budget deficit and fit it under the requirements of the European Union.
The oil market kept a bearish sentiment. At the moment, the WTI futures are testing a 51.30 USD/barrel mark.
Market Indicators
The US stock market began to recover: #SPY (+1,61%), #DIA (+1,47%), #QQQ (+2,31%).
The 10-year US government bonds yield has stabilized. At the moment, the indicator is at 3.05-3.06%.
The Economic News Feed for 27.11.2018:
– CB Customer Confidence Index – 17:00 (GMT+2:00).
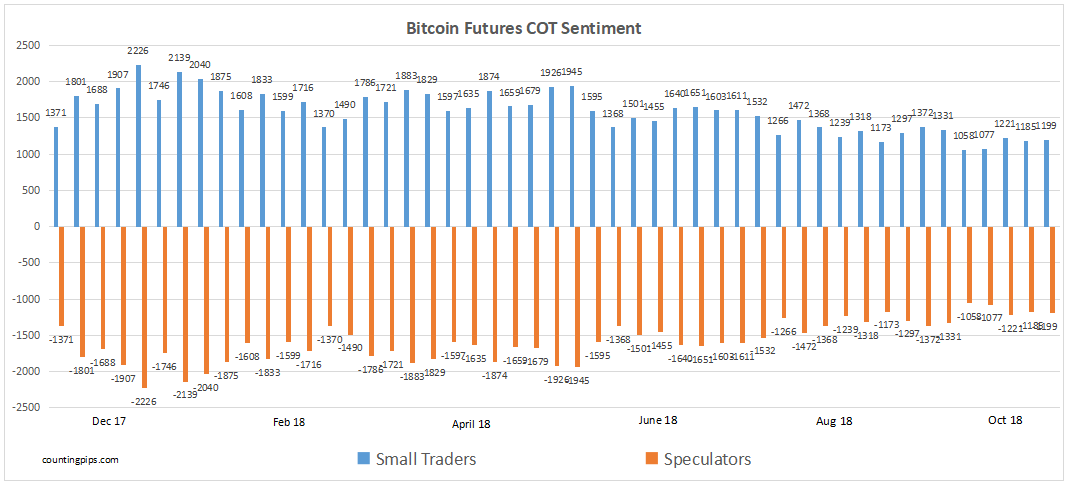
Large cryptocurrency speculators slightly edged their bearish net positions higher in the Bitcoin futures markets last week, according to the latest Commitment of Traders (COT) data released by the Commodity Futures Trading Commission (CFTC) on Monday due to the Thanksgiving day holiday.
The non-commercial futures contracts of Bitcoin futures, traded by large speculators and hedge funds, totaled a net position of -1,199 contracts in the data reported through Tuesday November 20th. This was a weekly change of -14 net contracts from the previous week which had a total of -1,185 net contracts.
The week’s net position was the result of the gross bullish position tumbling by -111 contracts to a weekly total of 1,598 contracts compared to the gross bearish position total of 2,797 contracts which saw a lowering by -97 contracts for the week.The speculators have increased their bearish positions in three out of the past four weeks (although by small amounts).
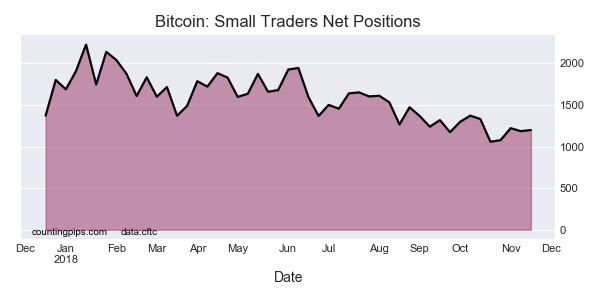
Meanwhile, the small traders position, which is on the opposite side of this market from the speculators, edged their existing bullish positions slightly higher this week by an equally offsetting 14 contracts to a current bullish level of 1,199 net contracts.
Bitcoin Futures COT Data is Speculators vs Small Traders
The Bitcoin futures data is in its forty-ninth week since the start of the cryptocurrency futures data releases on December 19th 2017. The data includes trader classifications of only speculators and small traders and without any commercial traders (typically business hedgers or producers of a commodity).
Speculators have remained on the bearish side since the beginning of the bitcoin data releases while the small traders have continued to be on the bullish side of this cryptocurrency market.
Bitcoin Futures:
Over the same weekly reporting time-frame, from Tuesday to Tuesday, the Bitcoin Futures (Front Month) closed at approximately $4240 which was a loss of $-2045 from the previous close of $6285, according to cryptocurrency market data (crypto 1inch).
*COT Report: The COT data, released weekly to the public each Friday, is updated through the most recent Tuesday (data is 3 days old) and shows a quick view of how large speculators or non-commercials (for-profit traders) as well as the commercial traders (hedgers & traders for business purposes) were positioned in the futures markets. The CFTC categorizes trader positions according to commercial hedgers (traders who use futures contracts for hedging as part of the business), non-commercials (large traders who speculate to realize trading profits) and nonreportable traders (usually small traders/speculators). Find CFTC criteria here: (http://www.cftc.gov/MarketReports/CommitmentsofTraders/ExplanatoryNotes/index.htm).
As we continue to explore our custom research into the metals markets and our presumption that the metals markets are poised for a massive price rally over the next few months/years, we pick up this second part of our multi-part article illustrating our research work and conclusions. If you missed the first part of this article, please take a minute to review it by before continuing further (Link to Part I).
We left off in Part I showing a number of supply and demand components and briefly highlighting our newest research using a custom Gold/Silver/US Dollar ratio index. Our attempt at finding anything new that could help us determine the future outcome of the metals markets and to either support or deny our future expectations that the metals markets are poised for a massive price advance was at stake. This new research would either help to confirm our analysis or completely blow it out of the water with new data. Let’s continue where we left off and start by showing even more data related to our new custom metals ratio.
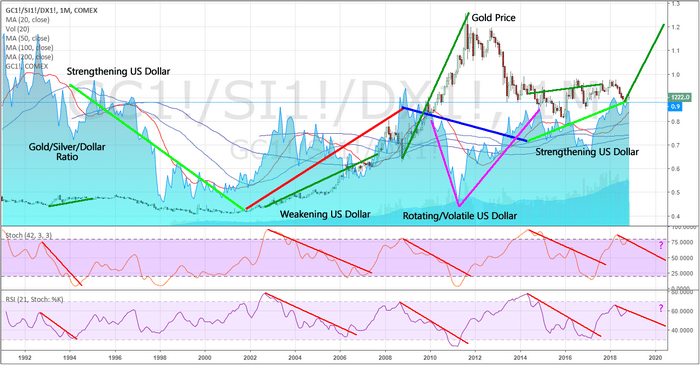
This Monthly chart showing our custom gold pricing ratio and the correlative price of Gold illustrates a number of key features. If you remember from Part I, the current ratio level (the Blue Area chart) is near the top of the Upper Boundary level (0.80 or higher). Whenever the ratio level enters this Upper Boundary level, it typically only stays there briefly before falling towards the Lower Boundary level. We’ve highlighted what we believe to be key elements of this type of ratio/price reaction. On the chart, below, we’ve highlighted every major ratio level decline from near the Upper Boundary level and the associated reaction to the price of Gold as well as the indicator reaction near the bottom of the chart. With each instance, we can clearly see that price advanced, in some cases dramatically, as the ratio level declined from the Upper Boundary towards the Lower Boundary. The biggest move occurred between 2002 and 2012 where two of these ratio rotations occurred.
Near the right edge of this chart, we can see that the ratio levels have already started to decline from recent peaks. We believe this could this be the start of a broader ratio level decrease that prompts a massive price rally in the metals markets. We believe this ratio swing could be accelerated by rotation and volatility within the US Dollar price and increased demand from Investors over the next 4~6 months.
Again, this Monthly chart paints a very big picture – planning many years in advance of this move. We believe this new metals market rally is setting up to be something that Gold traders have been thinking about for decades – a potential of Gold reaching $5000 or higher in a dramatic price rally that correlates with broader global market events. We don’t know what those events are at the moment, but we could certainly guess as to the nature of their origination.
Our research supports our opinion that the metals markets are dramatically underpriced in relation to global risk and potential future events. The only thing, in our opinion, that could prevent a new price rally from forming over the next 6+ months is a continued malaise in investor sentiment or continued strength in the US Dollar. If either of these two components continues for any length of time, the price of Gold and our custom ratio will likely continue to base near current levels or slightly lower.
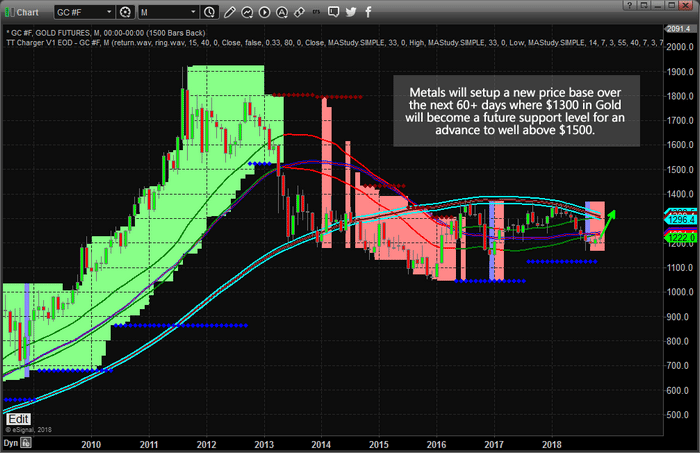
Our expectation is that currency issues as well as rotation or some weakness in the US Dollar will likely prompt an impulse rally in Gold where prices rally above $1300 before April 2019 and form a price base for the rest of the expected rally. Once the conditions ripen within the market and investors begin to pile into the long gold trade, the ratio will reflect this move and demand from the investor side will drive prices higher with the expectation that some type of crisis event cycle is about to unfold.
This next Monthly Gold chart shows what we believe will be the initial impulse move higher (towards and above $1300) before the rally really starts to gain speed. A rotation above $1300 would establish a new price base near or above recent highs and start the accumulation by Investors – driving the demand side of the equation. This move would also push the ratio a bit lower in support of our expectations.
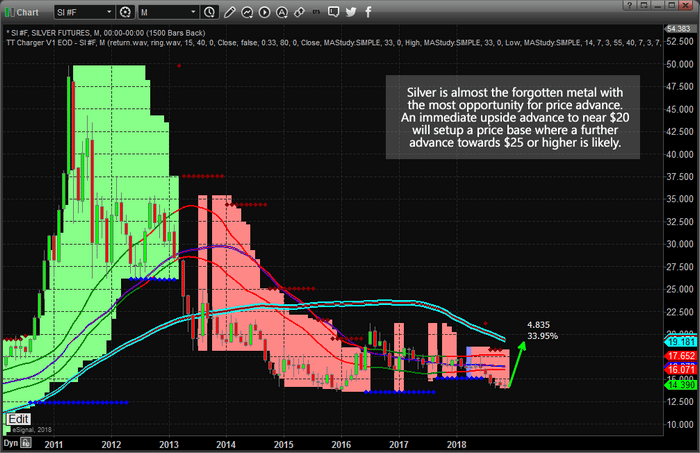
This Monthly Silver chart clearly shows the extended opportunity for skilled investors ahead of this move. We believe Silver is one of the most undervalued investments on the planet right now and that our analysis supports a longer-term view that Silver could reach the $40 to $50 level very quickly if the events we suspect are unfolding actually do unfold as we are suggesting. This would equate to a 280%+ swing in price before an even bigger move higher unfolds.
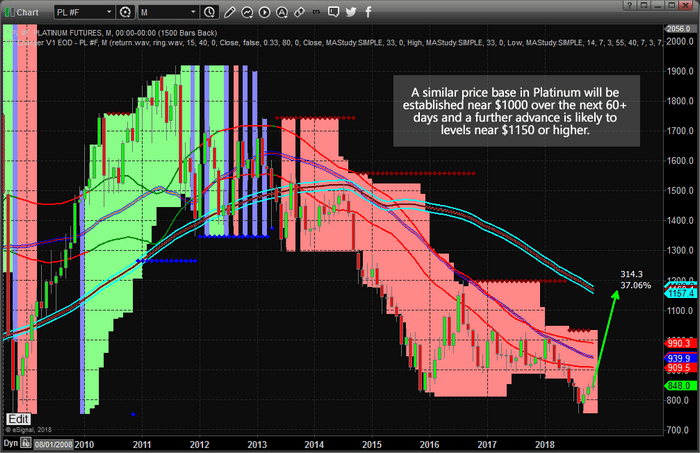
This Monthly Platinum chart shows the pricing pressures over the past 5+ years that have plagued the metals markets. If you were to take a look at the custom metals ratio chart near the top of this article, you would see that this pricing pressure is related to a number of key factors – most of which relate to lack of investor demand and lack of true price exploration (rotation of the ratio levels). In other words, price levels in the metals markets have been operating in a very narrow “void” or any real price rotation or exploration. We believe this environment is about to end and we believe the continued “price malaise” will end with a massive impulse move higher.
You can see from this chart we expect Platinum to rally to near $1150~1200 in the initial impulse move, then form a base before a further price advance.
In conclusion, if our longer-term analysis is correct and prices do begin to move higher with a shift in Investor sentiment and a renewed pricing advance supported by US Dollar or foreign currency weakness, our researchers believe $2456 and $3016 levels in Gold could become prime upside price targets. To put that in relative terms, this would be a 200% to 246% price advance in Gold. One could expect Silver to advance to near $40 and $50 which would be a 278% to 348% price advance. Depending on the scope and scale of the event cycle that unfolds, these levels could be considered conservative targets for upward price moves.
Please keep in mind that this research post is very long-term in scope and expectations. This is not going to happen next week or even over a few weeks. This is going to be years in the making and it could change how you adapt your investment styles over the next few years. Our efforts to bring this advanced research to you is our attempt to alert you to a pattern that is unfolding in the metals markets that could provide you with a huge opportunity for future success. Once this pattern starts to unfold further, expect the global stock markets to start reacting to this new “fear element” and prepare to adjust your trading styles accordingly.
We believe you won’t find a better team of researchers, traders and analysts than with TheTechnicalTraders.com. Our proprietary research, price modeling systems, and predictive analysis tools help to keep our members well ahead of the market with each turn.
The blockchain is seen by some people as a revolutionary or disruptive development in the field of financial technology today. For some people in this industry, these digital ledgers are viewed as a gateway or foundation to more innovations in the field. While the consensus is still out on what this recordkeeping system means in the world of Fintech, there is no denying that it helped in the rise of Bitcoin and other cryptocurrencies by providing a tamper-free and safe environment for viewing and tracking transactions. This type of technology is certainly a far cry from your average neighborhood bookkeeper or accountant. The question is, how does blockchain factor in our existing laws and affect liability in general?
What is blockchain and how does it work?
According to Don and Alex Tapscott, authors of Blockchain Revolution, the blockchain is an incorruptible digital ledger of economic transactions. Invented by Satoshi Nakamoto in 2008, this next-generation database can be used to record not only cryptocurrency and other financial transactions but also anything that has value. This means anything from a latest mobile purchase, a free voucher or electronic coupon, or even a property contract can be placed in a blockchain. At the moment, however, blockchains are mainly used for keeping and tracking cryptocurrency transactions, especially Bitcoin.
A blockchain works by holding information under a decentralized database managed autonomously by a peer-to-peer (p2p) network. But before comparing it to other file-sharing predecessors such as Napster or present-day cloud servers, the data or transactions stored in a blockchain is secured by cryptography and requires prior approval from the majority of the blockchain network. These details cannot be retroactively changed without the network’s consent and changing other blockchains that followed it. In addition, this digital database regularly updates on its own and may either be available for public viewing and distribution or setup privately via the intranet.
What do blockchains mean for legal liability?
Unlike traditional ledgers and databases, blockchain networks for Bitcoin and other cryptocurrencies can go beyond the boundaries set by legal jurisdictions because servers for this digital ledger can be based anywhere. In case of a fraudulent or erroneous transaction, identifying its location within the blockchain could be a challenge. Therefore, it can be tricky figuring out which laws to enforce or implement when dealing with this technology.
Blockchain, despite its advantages, can also be used as tools to make criminal activities harder to track down due to the anonymity provided to its users. There are also worries that irregular transactions might eventually make it to these digital ledgers due to possible loopholes in the network approval process such as the 51% attack, raising questions on information security as well. Other legal issues worth considering before dealing with blockchain technology include data privacy, intellectual property issues, and smart contracts.
Blockchain can potentially be an integral part of a business; however, it can also expose businesses to more risks that they have not encountered before. A firm’s successful adoption of any new technology depends on its ability to manage the risks that come with that new technology; therefore, a company must establish strong governance, risk management strategies, and frameworks of control.
None of the content onHoganinjury.comis legal advice nor is it a replacement for advice from a certified lawyer. Please consult a legal professional for further information.
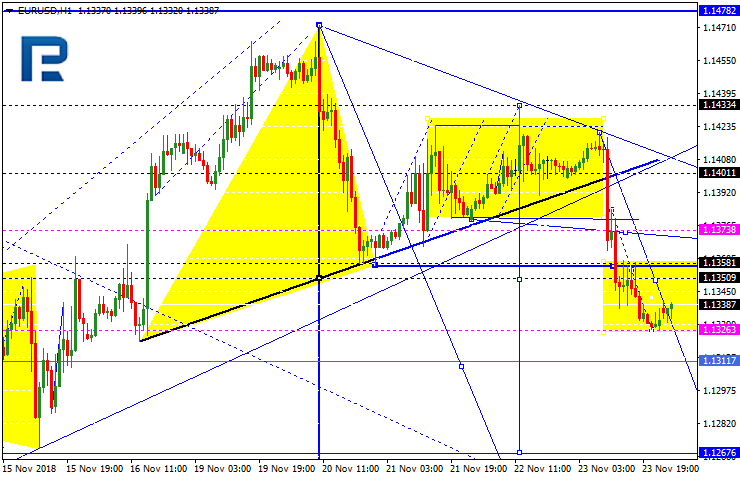
EURUSD has broken the low of the descending impulse and right now is still trading downwards. Possibly, today the pair may fall with the short-term target at 1.1270. After that, the instrument may start a new correction towards 1.1360 and then resume trading inside the downtrend to reach 1.1230.
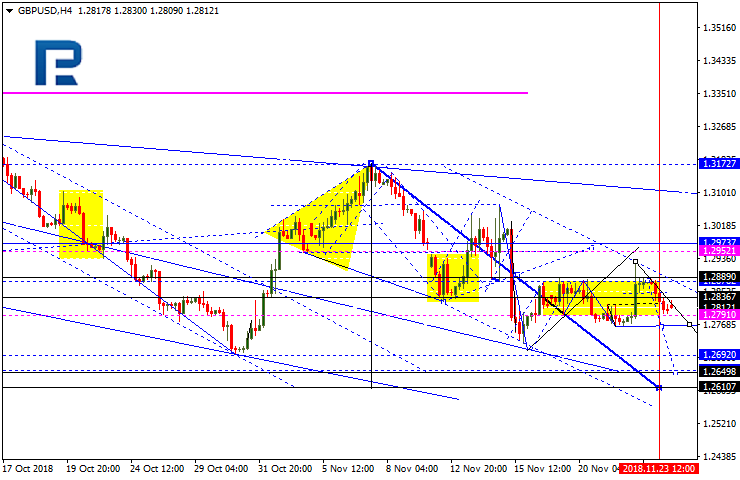
GBPUSD, “Great Britain Pound vs US Dollar”
GBPUSD is still consolidating; right now, it is trading close to its downside border. Today, the pair may reach the short-term target at 1.2650.
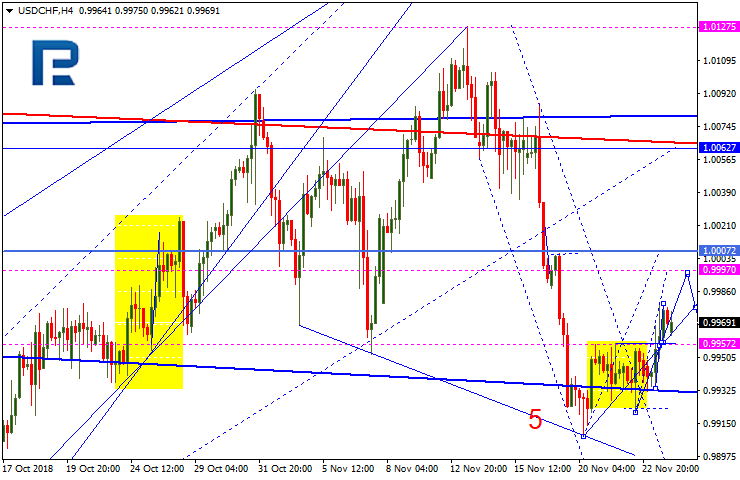
USDCHF, “US Dollar vs Swiss Franc”
USDCHF has broken 0.9960 upwards and right now is trading upwards with the short-term target at 0.9997. Later, the market may return to 0.9960 and then start another growth towards 1.0007.
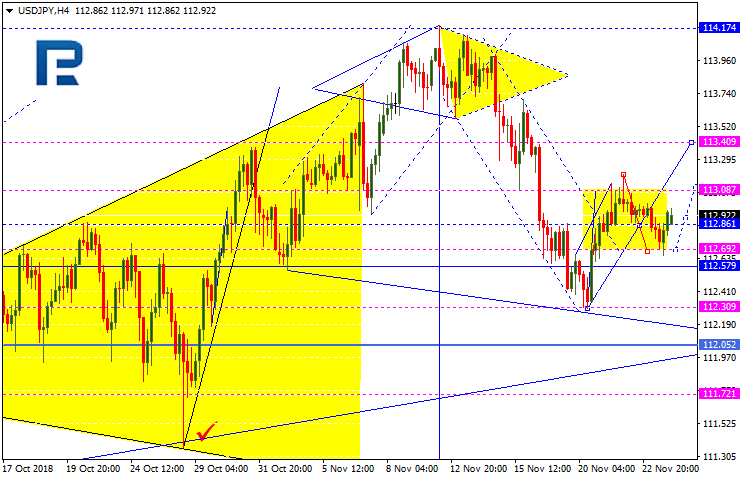
USDJPY, “US Dollar vs Japanese Yen”
USDJPY is trading upwards to reach 113.41. After that, the instrument may form a new descending structure to break 112.58 and then continue falling inside the downtrend with the short-term target at 111.72.
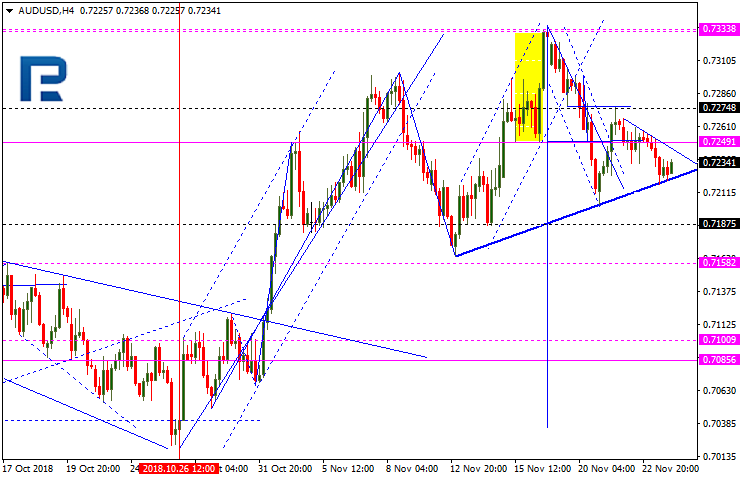
AUDUSD, “Australian Dollar vs US Dollar”
AUDUSD is consolidating around 0.7236; right now, it is trading downwards to reach 0.7188. If later the instrument breaks this level to the downside, the price may continue trading inside the downtrend with the short-term target at 0.7100.
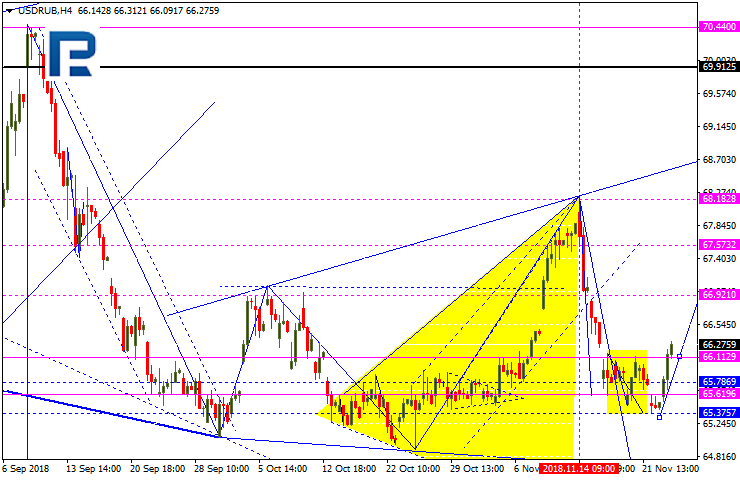
USDRUB, “US Dollar vs Russian Ruble”
USDRUB is trading upwards; it has broken 66.11 to the upside and many continue growing towards 66.90. Later, the market may resume trading to reach 64.40.
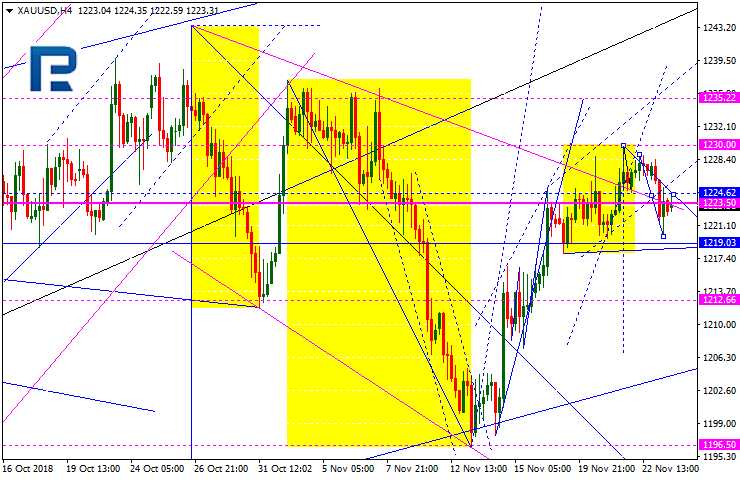
XAUUSD, “Gold vs US Dollar”
Gold is consolidating around 1224.60. Possibly, the price may form a new descending structure to reach 1219.00 and then start another growth to return to 1224.60. Later, the market may break this range to the downside and resume falling with the first target at 1206.70.
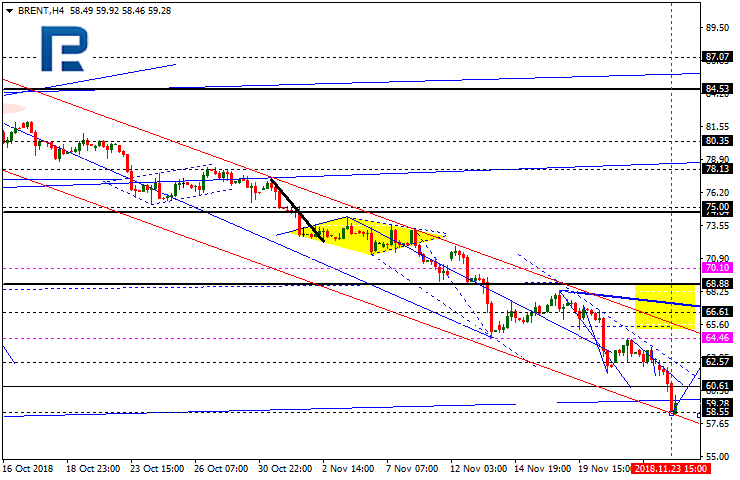
BRENT
Brent is consolidating above 59.00. Possibly, the price may form one more ascending structure to reach 65.65 and then resume falling towards 62.00. After that, the instrument may form the third structure with the short-term target at 68.88.
Attention! Forecasts presented in this section only reflect the author’s private opinion and should not be considered as guidance for trading. RoboForex LP bears no responsibility for trading results based on trading recommendations described in these analytical reviews.
At the beginning of the last November week, the British Pound reached stability, but chances for a new decline are still very high.
The key topic for the Pound is still the Brexit talks. Last weekend, countries-members of the European Union approved the Brexit agreement, while the European Commission President Jean-Claude Juncker already said that “the Brexit is not a humiliation for Britain” and “the Brexit deal drafted by the Prime Minister Theresa May is the best deal possible for Britain”. The United Kingdom’s exiting the European Union will start on March 29th 2019 and the agreement will take effect on the following day. Juncker told the media that it was sad seeing the UK exiting the EU.
However, in order for everything to start working as it should, the agreement has to be approved by the European Parliament and then by the House of Commons of the UK. The British government is currently focused on working out the Brexit plan and consulting with the country’s Parliament. Apart from this, there are negotiations with business structures and social agencies representatives, so that the government could make the Brexit strategy more comfortable for domestic structures.
Investors are a little bit worried by forthcoming popular votings. Some mention a possibility of a double voting, which may cause panic on the market. Right now, this possibility is very low, but one shouldn’t exclude this scenario.
The surprising thing is that the Pound hasn’t been able to regain positions after the EU Summit, although Brexit deal that was approved was really the best possible option at that moment. Apparently, the risks of voting in the British Parliament outweigh the benefits.
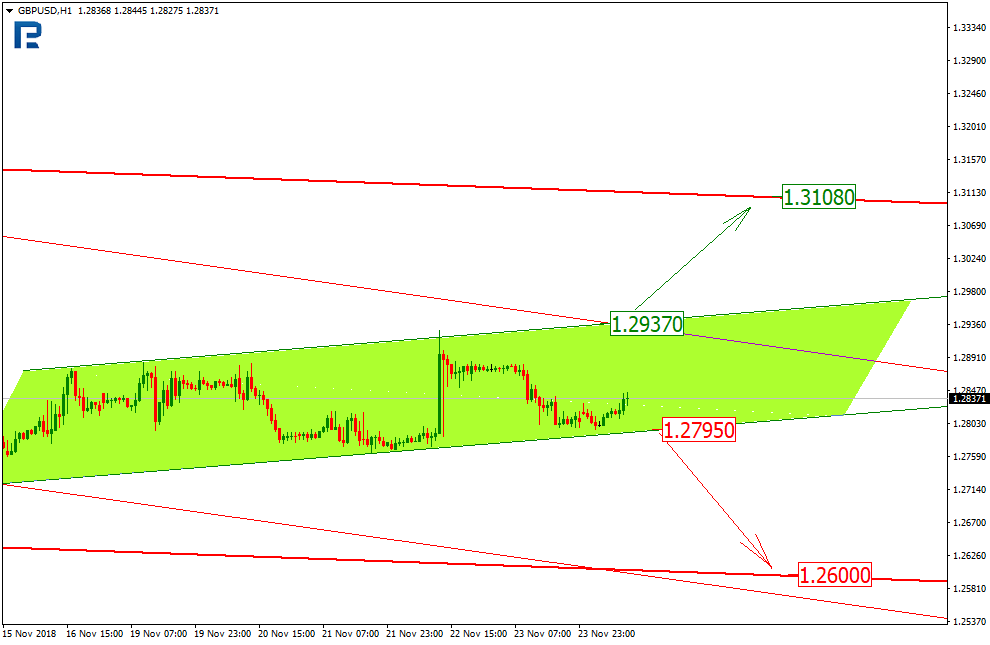
As we can see in the H1 chart, GBPUSD is trading upwards and correcting the previous mid-term downtrend. After testing the support line of the ascending channel, the price is trying to form a new rising impulse towards the resistance level at 1.2937. It’s quite interesting that this level almost matches the resistance line of the mid-term channel. If the price breaks this level, the next target will be the resistance line of the main channel at 1.3108. The support level for the current short-term movement is at 1.2795. If the instrument breaks it, “bears” may continue pushing the price towards the key support line at 1.2600.
Disclaimer
Any predictions contained herein are based on the authors’ particular opinion. This analysis shall not be treated as trading advice. RoboForex shall not be held liable for the results of the trades arising from relying upon trading recommendations and reviews contained herein.
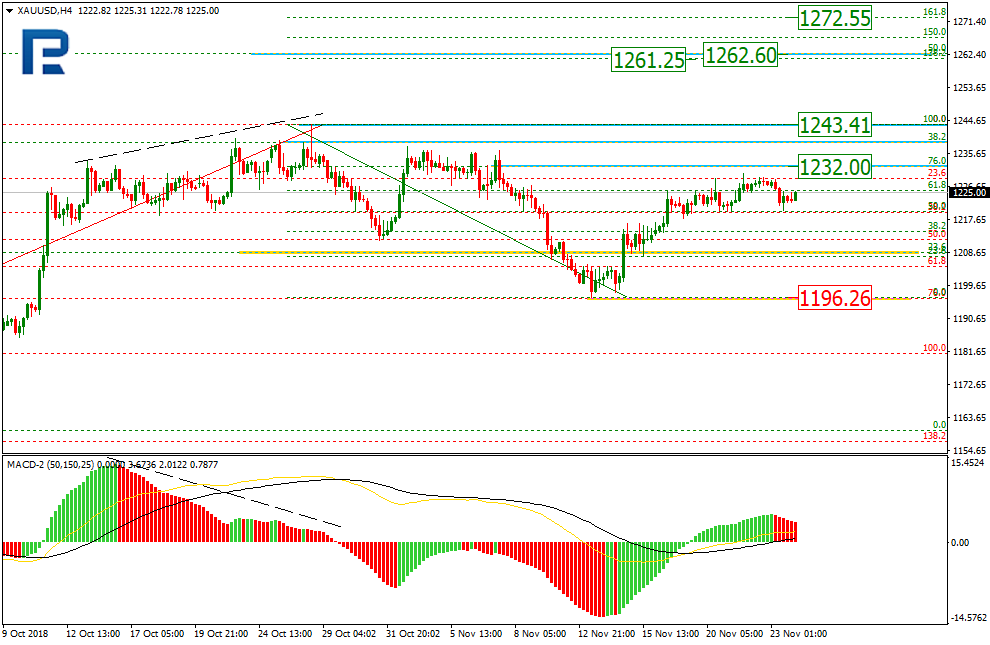
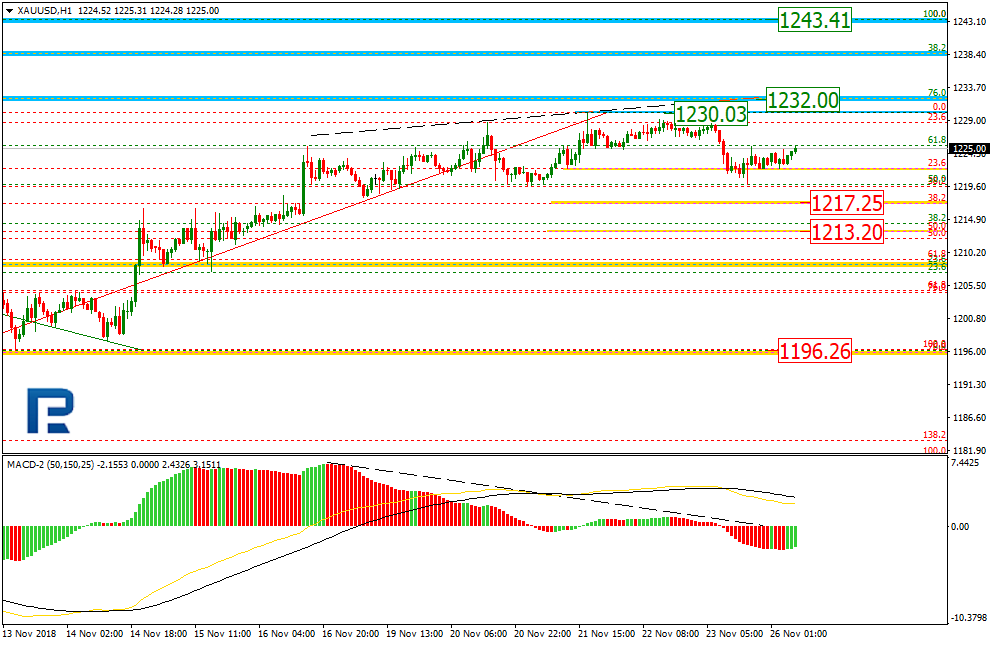
As we can see in the H4 chart, XAUUSD has slowed down its ascending movement. In case it continues, the target may be the retracement of 76.0% at 1232.00 and the current high at 1243.41. If the price breaks the high, it may grow towards the post-correctional extension area between the retracements of 138.2% and 161.8% at 1261.25 and 1272.55 respectively. The key support level is at 1196.26.
In the H1 chart, the divergence made the pair start a new decline, which has already reached the retracement of 23.6%. The next targets may be the retracements of 38.2% and 50.0% at 1217.24 and 1213.20 respectively. If the price breaks the local high at 1230.03, the instrument may continue growing towards the high at 1243.41.
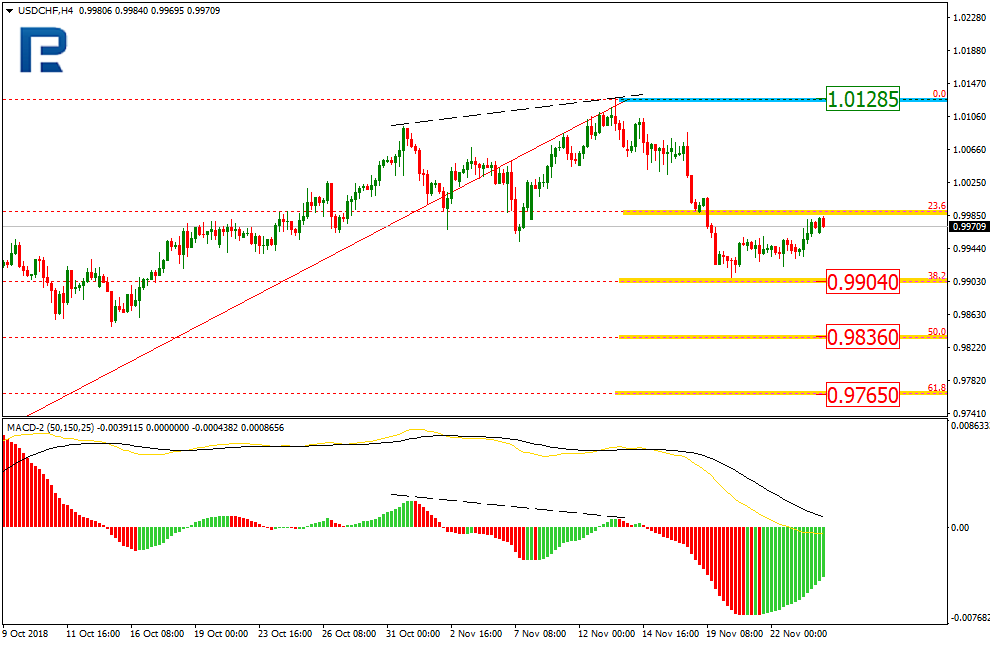
USDCHF, “US Dollar vs Swiss Franc”
As we can see in the H4 chart, after reaching the retracement of 38.2% at 0.9904, USDCHF has started a new pullback. The possible targets may be the retracements of 50.0% and 61.8% at 0.9836 and 0.9765 respectively. The resistance level is the high at 1.0128.
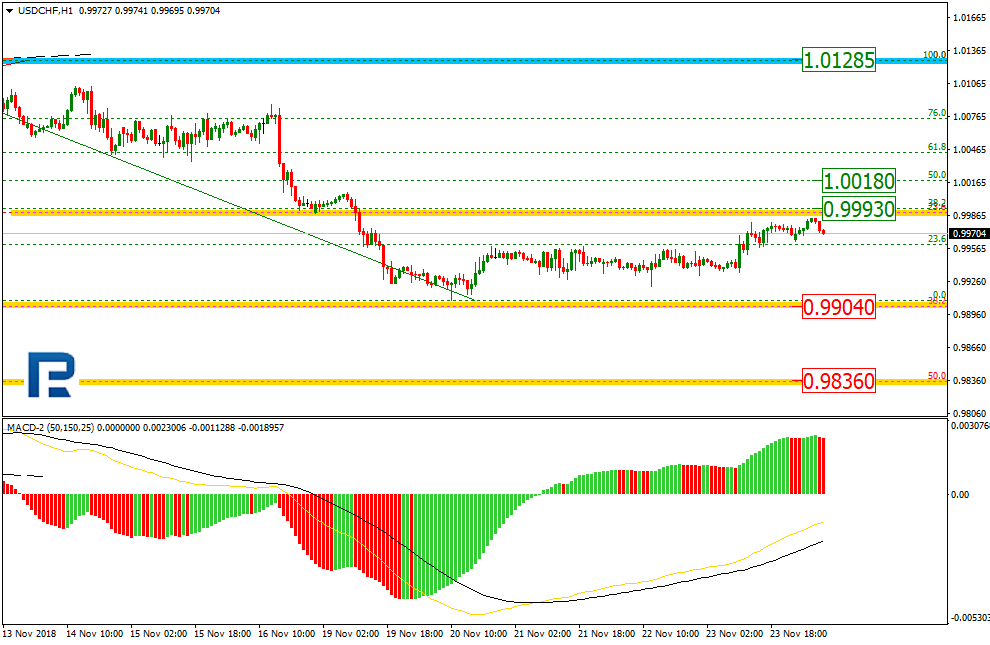
In the H1 chart, the pair is being corrected to the upside. The targets of this pullback may be the retracements of 38.2% and 50.0% at 0.9993, and 1.0018 respectively.
Attention! Forecasts presented in this section only reflect the author’s private opinion and should not be considered as guidance for trading. RoboForex LP bears no responsibility for trading results based on trading recommendations described in these analytical reviews.
On Friday, aggressive sales were observed on the EUR/USD currency pair. Drop in quotes exceeded 70 points. At the moment, the euro has recovered most of the losses. Local support and resistance levels are 1.13500 and 1.13850, respectively. Positions should be opened from these marks. We recommend following the current information on the budget process in Italy.
The news feed on 26.11.2018:
– German IFO business climate index at 11:00 (GMT+2:00).
We also recommend paying attention to the speech by the ECB President Draghi.
Indicators do not send accurate signals: the price has crossed 50 MA and 200 MA.
The MACD histogram is in the negative zone, but above the signal line, which gives a weak signal to sell EUR/USD.
Stochastic Oscillator is in the overbought zone, the %K line has crossed the %D line. There are no accurate signals.
Trading recommendations
Support levels: 1.13500, 1.13200, 1.13000
Resistance levels: 1.13850, 1.14100, 1.14400
If the price fixes below the support level of 1.13500, a further fall in the EUR/USD quotes is expected. The movement is tending to 1.13200-1.13000.
An alternative may be the EUR/USD currency pair growth to the level of 1.14100-1.14400.
The GBP/USD currency pair
Technical indicators of the currency pair:
Prev Open: 1.28739
Open: 1.28202
% chg. over the last day: -0.50
Day’s range: 1.28146 – 1.28438
52 wk range: 1.2662 – 1.4378
On Friday, the bearish sentiment was observed on the GBP/USD currency pair. The decrease in quotes exceeded 70 points. At the moment, investors assess Brexit deal between the EU and the UK. The local support and resistance levels are 1.28150 and 1.28500, respectively. Positions should be opened from these marks.
Today the publication of important economic reports from the UK is not planned. We recommend paying attention to the speech by the Bank of England Governor Carney.
Indicators do not send accurate signals: 50 MA is crossing 200 MA.
The MACD histogram is located near the 0 mark.
Stochastic Oscillator is near the overbought zone, the %K line has crossed the %D line. There are no accurate signals.
Trading recommendations
Support levels: 1.28150, 1.27900, 1.27700
Resistance levels: 1.28500, 1.28800, 1.29000
If the price fixes below the support level of 1.28150, the GBP/USD quotes are expected to fall. The movement is tending to 1.27900-1.27700.
An alternative may be the further growth of the GBP/USD currency pair to 1.28800-1.29000.
The USD/CAD currency pair
Technical indicators of the currency pair:
Prev Open: 1.31866
Open: 1.32209
% chg. over the last day: +0.36
Day’s range: 1.31870 – 1.32015
52 wk range: 1.2248 – 1.3387
There is a variety of trends on the USD/CAD currency pair. On Friday, there were ambiguous economic reports on inflation and retail sales in Canada. At the moment, the key support and resistance levels are 1.31800 and 1.32100, respectively. Positions should be opened from these marks. We recommend paying attention to the dynamics of oil prices.
The news feed on the economy of Canada is calm.
Indicators do not send accurate signals: 50 MA has crossed 200 MA.
The MACD histogram has moved to the negative zone, which gives a signal to sell USD/CAD.
Stochastic Oscillator is in the oversold zone, the %K line has crossed the %D line. There are no signals.
Trading recommendations
Support levels: 1.31800, 1.31500, 1.31300
Resistance levels: 1.32100, 1.32400, 1.32700
If the price fixes above the resistance level of 1.32100, it is necessary to consider purchases of USD/CAD. The movement is tending to 1.32400-1.32700.
Alternative option. If the price fixes below the 1.31800 mark, we recommend looking for entry points to the market to open short positions. The movement is tending to 1.31500-1.31300.
The USD/JPY currency pair
Technical indicators of the currency pair:
Prev Open: 112.939
Open: 112.866
% chg. over the last day: +0.01
Day’s range: 113.241 – 113.294
52 wk range: 104.56 – 114.74
The bullish sentiment is observed on the USD/JPY currency pair. At the moment, quotes are consolidating. The local support and resistance levels are 113.150 and 113.350, respectively. We recommend paying attention to the dynamics of the US government bonds yield. Positions should be opened from the key levels. The USD/JPY quotes have the potential for further growth.
Publication of important economic reports from Japan is not planned.
Indicators point to the power of buyers: the price has fixed above 50 MA and 200 MA.
The MACD histogram is in the positive zone, above the signal line, which gives a strong signal to buy USD/JPY.
Stochastic Oscillator is in the neutral zone, the %K line has crossed the %D line. There are no accurate signals.
Trading recommendations
Support levels: 113.150, 112.850, 112.650
Resistance levels: 113.350, 113.550, 113.800
If the price fixes above the resistance of 113.350, further growth of the USD/JPY quotes is expected. The movement is tending to 113.550-113.800.
On Friday, the US dollar rose against a basket of currency majors amid a decrease in demand for risky assets and drop in oil prices. Investors are concerned about a slowdown in global economic growth. The US dollar index (#DX) closed in the positive zone (+0.25%). This week, financial market participants expect a meeting between the US President, Donald Trump, and China’s leader, Xi Jinping, at the G-20 summit, which will be held from November 30 till December 1.
Investors assess the results of the Brexit negotiations, which took place on Sunday, November 25. 27 EU leaders approved a 600-page Brexit deal. It sets out the terms for the exit of the country from the European Union on March 29, 2019, and the subsequent transition period for two-three years. The EU believes that this agreement is the best option for the UK.
The “black gold” prices are rising after the collapse the day before. At the moment, futures for the WTI crude oil are testing a mark of $51.05 per barrel.
Market Indicators
On Friday, aggressive sales were observed in the US stock market: #SPY (-0.64%), #DIA (-0.75%), #QQQ (-0.72%).
The 10-year US government bonds yield has become stable. Currently, the indicator is at the level of 3.04-3.05%.
The news feed on 2018.11.26:
– German IFO business climate index at 11:00 (GMT+2:00).
We also recommend paying attention to the speech by the ECB President Draghi and the Bank of England Governor Carney.
In the past few months, the Trump White House has started trade wars against its major trade partners, particularly China, and security allies. Without international opposition, the next target will be the World Trade Organization.
As the White House began to escalate the U.S.-Sino trade war last spring, President Trump’s trade adviser Peter Navarro was asked on CNN whether the United States is planning to leave the World Trade Organization (WTO).
The controversial advocate of American neo-protectionism known for his China-bashing books and documentaries, Navarro said that “a lot of problem has been the World Trade Organization, which is over 160 countries, and a lot of them simply don’t like us and so we don’t get good results there.”
When Navarro was asked whether the U.S. will ultimately leave the WTO, he dodged the question saying that it was “a provocative question.” But it was a fair question.
At the turn of the 1930s, Washington opted for the Smoot-Hawley Tariff to re-energize the U.S. economy. In reality, the 1930 Act made the Great Depression even worse paving the way to World War II. In fact, if today’s “Trump tariffs” were to prevail and broaden, they would be at the level of those U.S. tariffs that last prevailed around 1945. With its “America First” stance, the Trump administration aims to reverse seven decades of world trade expansion in just seven months (Figure).
That’s what Trump’s trade hawks are after and that’s why they are targeting the WTO (which contributed to the dead-end of the recent APEC Summit). The goal is to bury the WTO – or to “reform” and “modernize” it into an “America First” WTO.
Figure How “Trump Tariffs” Reverse 7 Decades of History in 7 Months
How Obama paved way to Trump’s anti-WTO attacks
Ironically, the U.S. was the key architect of the WTO; the 164-member international organization established in 1995 that replaced the General Agreement on Tariffs and Trade (GATT), which was created in 1948. Today, the WTO oversees global trade rules and resolves trade disputes on the basis of international trade law and practices. It covers some 98% of global trade.
In the postwar era, successive rounds of trade liberalization promoted great expansion of trade. As a result, the average most-favored nation applied tariff of WTO members fell from 25% in 1994 to less than 10% today – before the Trump era.
As president, Trump prefers bilateral agreements to exploit US economic might – not multilateral, international cooperation. As a candidate, he already called WTO trade deals a “disaster” urging the U.S. to “renegotiate” or “pull out” from such agreements. Along with the WTO, Trump’s trade hawks targeted China. As Trump declared in Iowa in 2016, “China is not a market economy.” But what’s less understood that he built his attack on his predecessor’s legacy.
Trump’s attack against the WTO and China was preceded by the refusal of former President Obama, the EU and Japan to grant China its market economy status (MES) as the key clause in China’s 2001 agreement to join the WTO expired on December 11, 2016. It is this distortion of market realities –which paralleled the Obama-Clinton “pivot to Asia” – that now fuels Trump’s tariff wars and the effort to undermine the postwar international trading regime. Trump has greatly benefited from the decisions of those who now criticize him.
When China joined the WTO on December 11, 2001, it was written into the agreement that member states could treat China as a “non-market economy.” Due to the size of the Chinese economy, government intervention, and state-owned enterprises, advanced economies argued that Chinese domestic price comparisons must be ignored and “constructed values” be used to gain a “true picture” of China’s economy. That’s why, since the early 2000s, the surrogate figures have permitted wide discretion and manipulation of price data, which was then used as the basis for anti-dumping charges; i.e., tariffs up to 40% higher than normal anti-dumping duties. On the campaign trail, Trump exploited precisely such figures when he pledged he would introduce 45% tariffs against Chinese products.
In the Trump White House, not only China but all emerging and developing economies are potential targets, as evidenced by the Trump administration’s criticisms of emerging economies claims of special treatment under WTO rules for developing countries.
The WTO is just the latest, though very symbolic, target of those who see America as a “victim” of “unfair” trade – in contrast to the historical record.
America First Versus WTO
Setting the scene, the White House has suggested that the U.S. may ignore WTO rulings that are not in its favor, amid alleged concerns that dispute settlement infringes on U.S. sovereignty. It is a curious premise: If every member country of the WTO would opt for a similar approach, a Hobbesian “war of all against all” would replace international cooperation – in the name of “fair trade.”
Starting already with the Obama administration, the U.S. has been blocking new appointments to the WTO’s Appellate Body (AB), which is responsible for appeals. As more judicial terms are set to expire, AB may no longer meet its quorum after December 2019. The tactic basically exploits WTO to dig its own grave.
Unsurprisingly, the Trump administration’s overall approach has sparked questions regarding the future of U.S. leadership and participation in the WTO, as well as the role of Congress in U.S. trade policy. Yet, although unease about the ‘America First’ world trade is growing, many countries still seek bilateral deals with the U.S. Such opportunism enables the Trump administration to divide and rule over its allies.
In the absence of effective Democratic opposition, a sustained effort by President Trump to withdraw the U.S. unilaterally from the WTO – if legal under U.S. law – would devastate America’s foreign trade and debilitate the WTO. It would certainly accelerate the major U.S. contraction or severe recession that already looms in the horizon. The more global its impact, the greater the likelihood that it will herald the kind of headwinds and horrors that led to the postwar WTO in the first place.
There is a way to defuse such challenges, but that requires unity and cooperation among and between the major advanced and emerging economies – not against America, but with America (most Americans disapprove “America First” policies).
The world can live without “America First” supremacy. But the world cannot live without relatively open free trade.
About the Author:
Dr Dan Steinbock is the founder of global consultancy Difference Group and has served as the research director at the India, China, and America Institute (USA) and a visiting fellow at the Shanghai Institutes for International Studies (China) and the EU Center (Singapore). For more information, see http://www.differencegroup.net/