On Friday the 23rd of November, trading on the EURUSD pair closed down. The single currency shed 94 pips against the greenback to hit a weekly low of 1.1327. The pair’s slide was the result of disappointing data from the Eurozone and Germany, as well as increased demand for the dollar on the back a renewed retreat from risky assets ahead of the weekend. As US markets were operating on a shortened schedule due to the Thanksgiving holidays, there was nothing to stop the bears from hitting fresh lows.
Day’s news (GMT):
12:00 Germany: IFO – business climate (Nov), IFO – current assessment (Nov), IFO – expectations (Nov).
12:00 Eurozone: ECB’s Praet speech.
12:30 UK: BBA mortgage approvals (Oct).
15:00 Eurozone: ECB’s Novotny speech.
15:30 Eurozone: ECB’s Cœuré Speech.
16:30 US: Chicago Fed national activity index (Oct).
17:00 Eurozone: ECB President Draghi’s speech.
21:30 BoE Governor Carney’s speech.
Fig 1. EURUSD hourly chart.
Current situation:
The euro lost ground against the dollar on Friday. My expectations of a drop and a breakout of the trend line were proven correct.
The euro started recovering its losses in Monday’s Asian session. In my forecast, I expect to see movements against Friday’s up to 1.1380. I thought that the euro and pound would start rising as soon as trading opened. Over the weekend, the leaders of all 27 EU member states convened in Brussels and reached a deal on the UK’s terms of exit. The pound barely reacted to this news as this had been expected. Clearly the bulls are saving their energy for later when the British parliament ratifies this deal.
ECB President Mario Draghi will give a speech to the European parliament’s monetary policy committee today at 17:00 (EET). Ahead of this, starting from 15:00, board members Novotny and Cœuré will also give speeches.
I can’t see anything getting in the way of a correction to 1.14 today, except for the balance line and 45th degree. The situation in Italy isn’t currently having any effect on markets, but you should remain vigilant all the same if you have a long position.
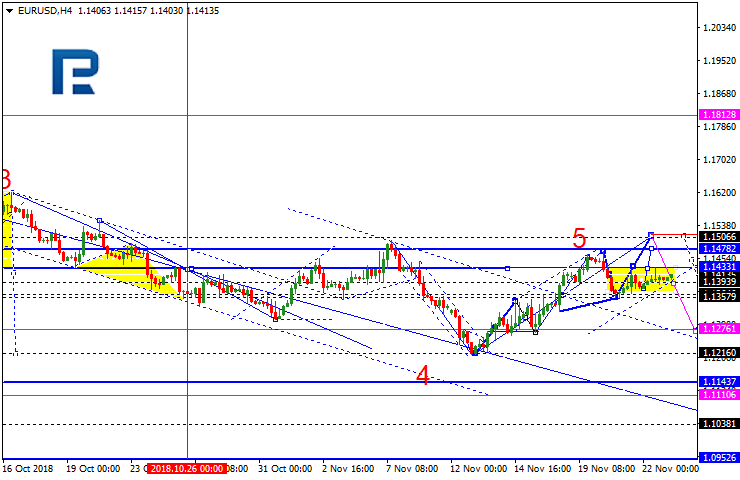
EURUSD hasn’t been able to the lows and right now is trading upwards. Possibly, the pair may choose an alternative scenario to form one more ascending wave with the target at 1.1500. Today, the price may form this wave by growing towards 1.1478, returning to 1.1433, and then reaching the above-mentioned target. After that, the instrument may resume trading inside the downtrend with the first target at 1.1276.
GBPUSD, “Great Britain Pound vs US Dollar”
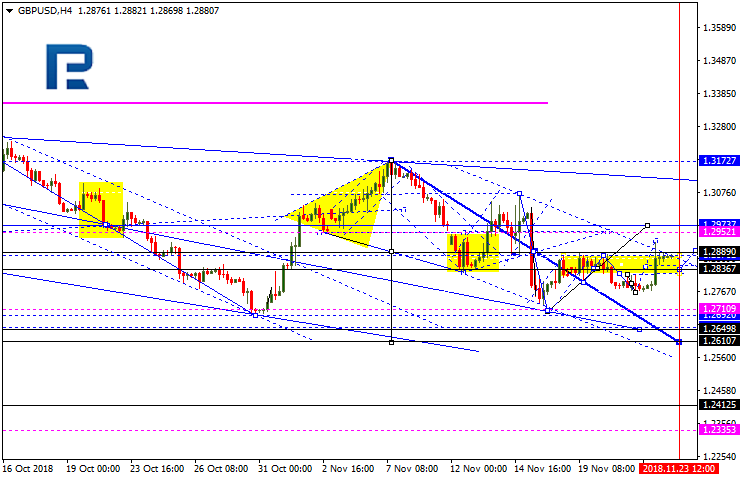
GBPUSD may choose an alternative scenario to grow with the target at 1.2973. Today, the pair may trade upwards to reach 1.2950, fall towards 1.2888, and then start another growth to return to the above-mentioned target. Later, the market may resume falling to reach 1.2650, at least.
USDCHF, “US Dollar vs Swiss Franc”
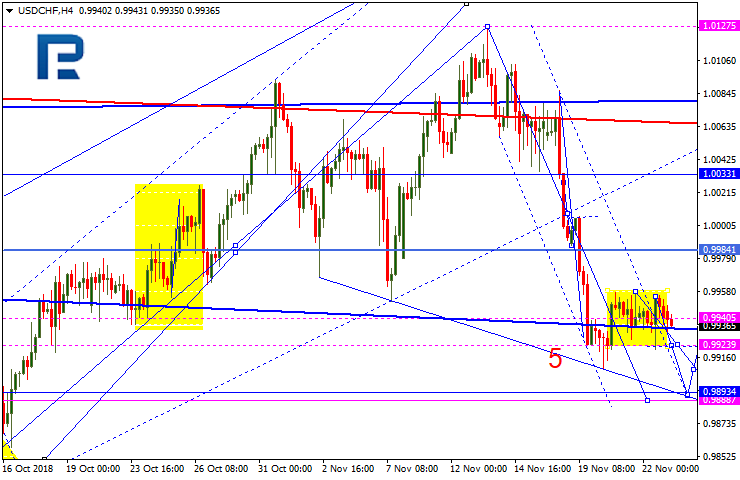
USDCHF is consolidating around 0.9945. If later the instrument breaks this range to the upside, the price may reach 0.9977; if to the downside – form a new descending structure towards 0.9888 and then resume trading inside the downtrend with the first target at 1.0007.
USDJPY, “US Dollar vs Japanese Yen”
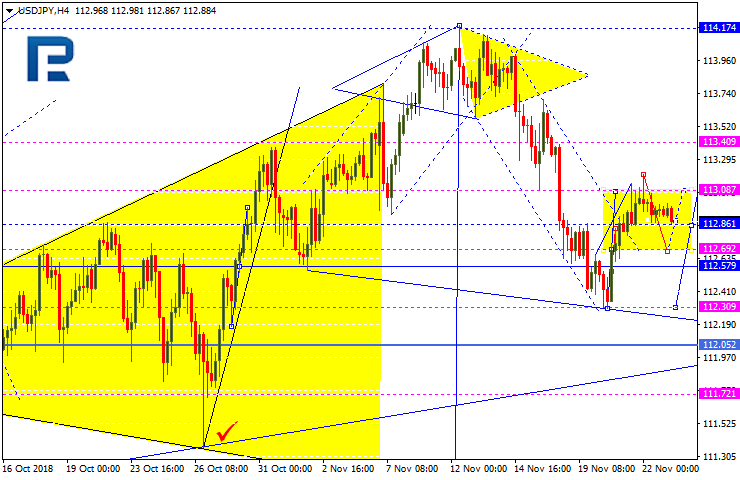
USDJPY has completed the first ascending structure. Possibly, today the price may start a new correctional decline towards 112.70 and then form one more ascending structure to reach 113.40.
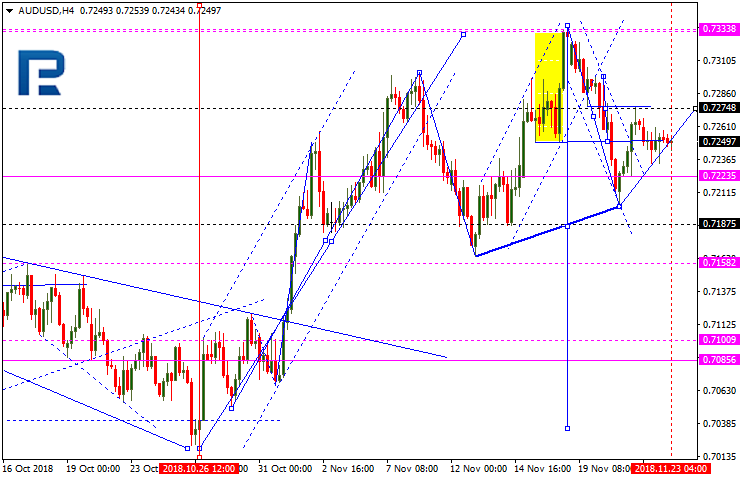
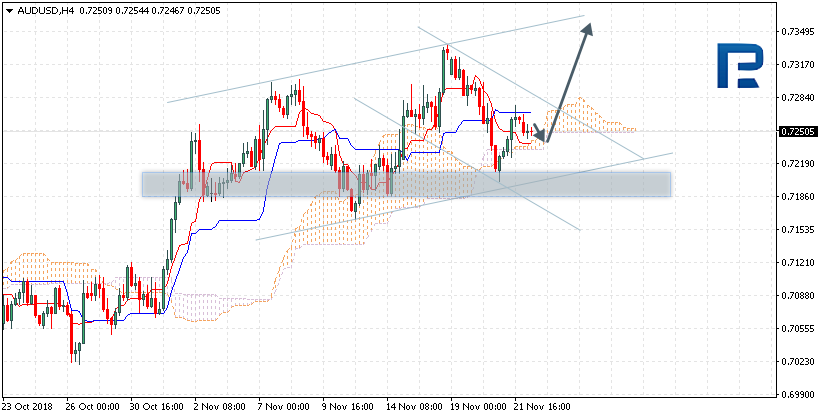
AUDUSD, “Australian Dollar vs US Dollar”
AUDUSD is consolidating around 0.7249. If later the instrument breaks this range to the upside, the price may choose an alternative scenario to reach 0.7333; if to the downside – resume trading inside the downtrend towards 0.7000. The short-term target is at 0.7187.
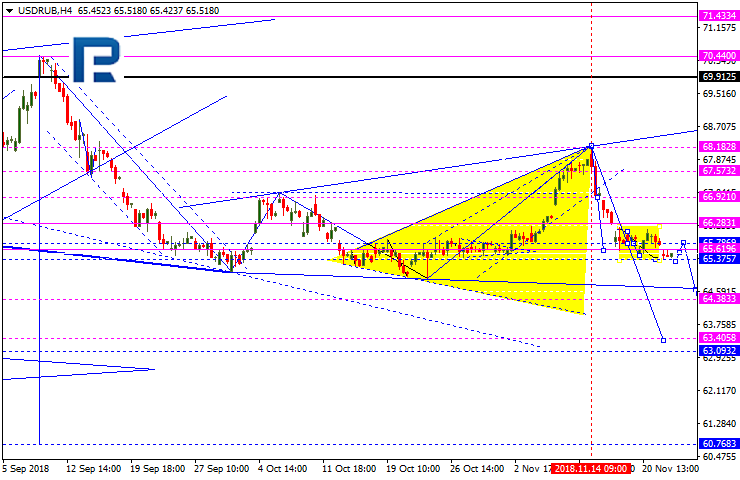
USDRUB, “US Dollar vs Russian Ruble”
USDRUB is consolidating above 65.75. Possibly, today the price may form a new descending structure towards 65.37 and then resume growing to reach 65.76. If later the instrument breaks this range to the downside, the price may continue falling inside the downtrend with the short-term target at 63.43; if to the upside – start a new correction towards 66.50 and then resume trading towards the above-mentioned target.
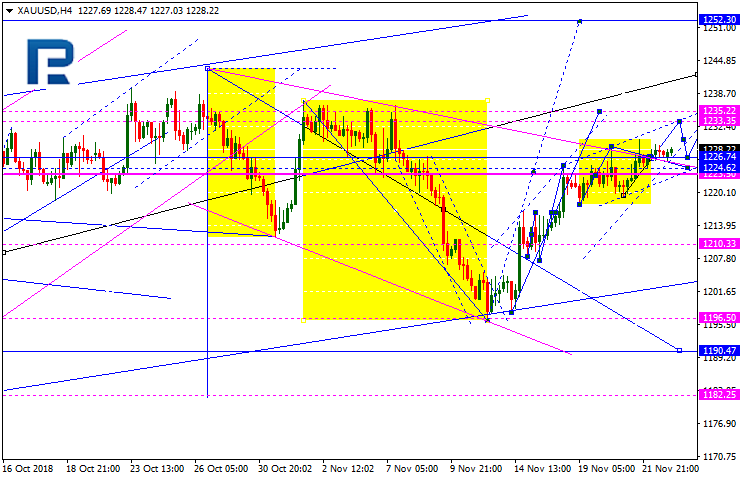
XAUUSD, “Gold vs US Dollar”
Gold is trading upwards. Possibly, the price may choose an alternative scenario to reach 1233.35. After that, the instrument may fall towards 1226.74 and then start another growth to reach 1235.25. In fact, the pair may form the fifth ascending wave with the target at 1252.30. Considering that the correction was a three-wave structure, the price may start plummeting towards 1190.00 at any moment and then start forming the fifth wave described above. Later, the market may resume falling to reach 1110.00.
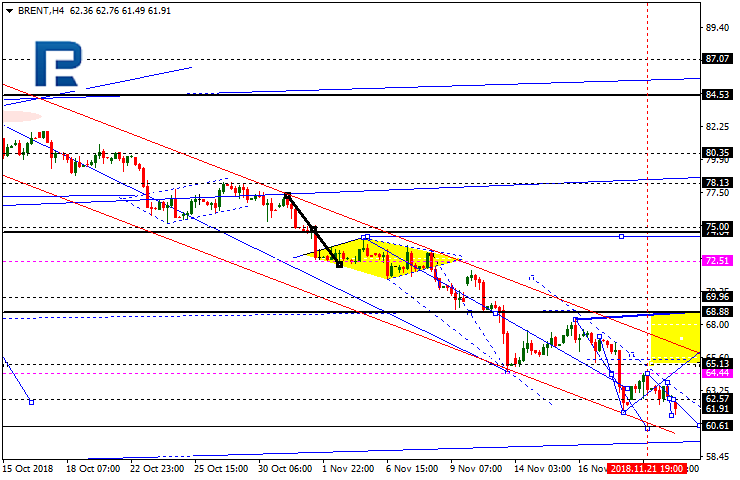
BRENT
Brent is trading downwards. Today, the price may reach 61.40 and then resume growing towards 62.57. Later, the market may start a new decline with the target at 60.60. After that, the instrument may form a reversal pattern for a new ascending wave with the first target at 68.88.
Attention! Forecasts presented in this section only reflect the author’s private opinion and should not be considered as guidance for trading. RoboForex LP bears no responsibility for trading results based on trading recommendations described in these analytical reviews.
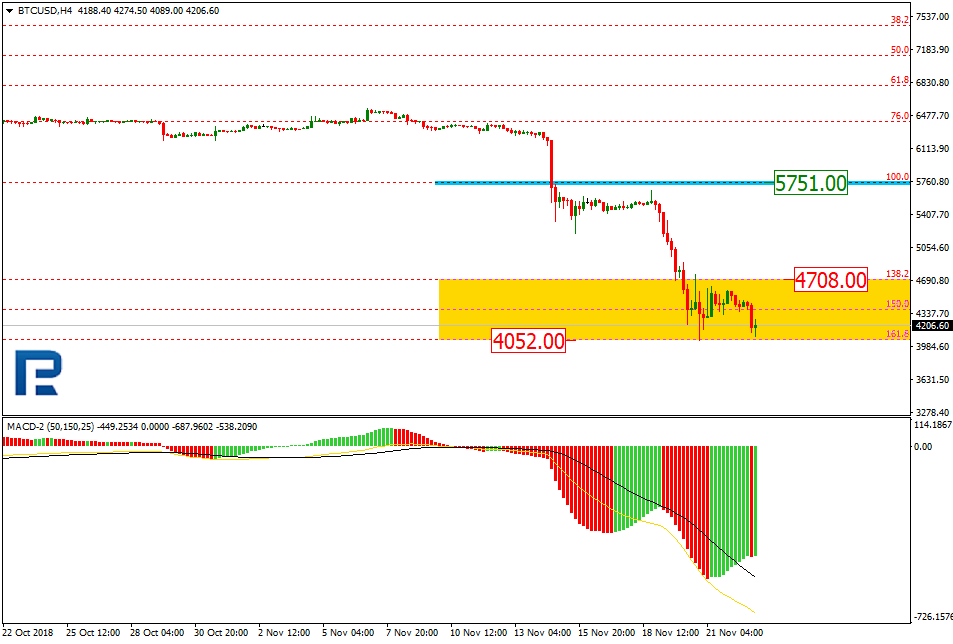
As we can see in the H4 chart, BTCUSD is still trading inside the post-correctional extension area between the retracements of 138.2% and 161.8%. The key resistance is at 5751.00. If the price breaks the support at 4052.00, the instrument continue falling towards the psychologically-crucial level at 3000.00.
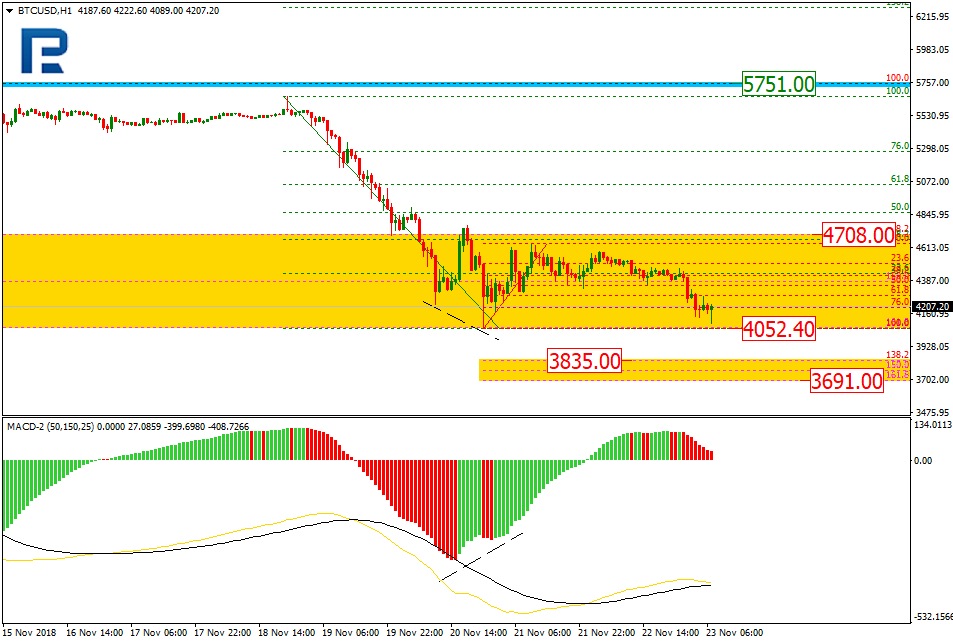
In the H1 chart, the pair is testing 4052.40. If the price breaks this level, the instrument may continue falling towards the post-correctional extension area between the retracements of 138.2% and 161.8% at 3835.00 and 3691.00 respectively.
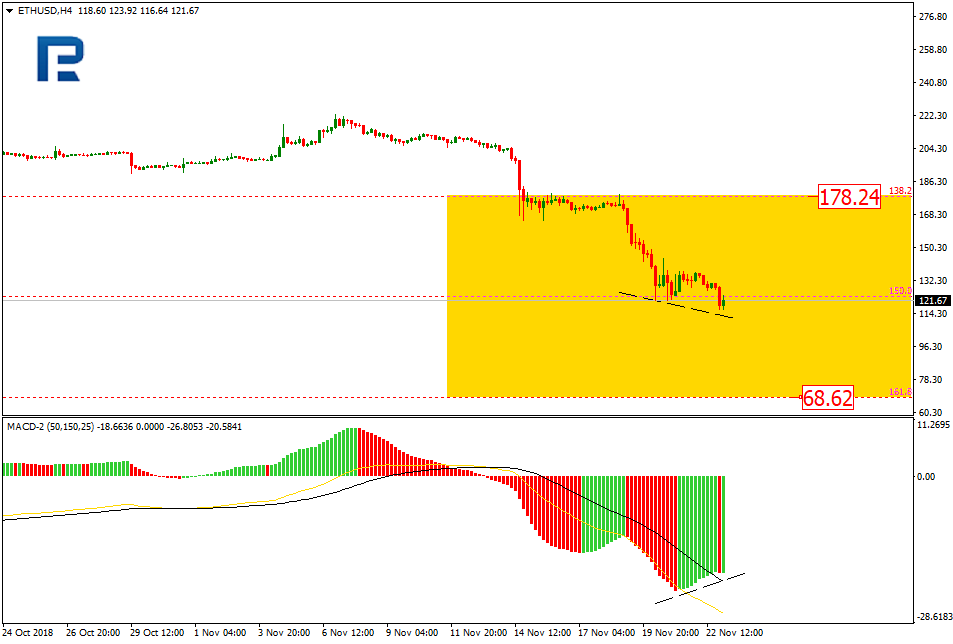
ETHUSD, “Ethereum vs. US Dollar”
In the H4 chart, the downtrend continues. Right now, ETHUSD is trading inside the post-correctional extension area between the retracements of 138.2% and 161.8% at 178.24 and 68.62 respectively. However, there is convergence on MACD, which may indicate a possible short-term correction.
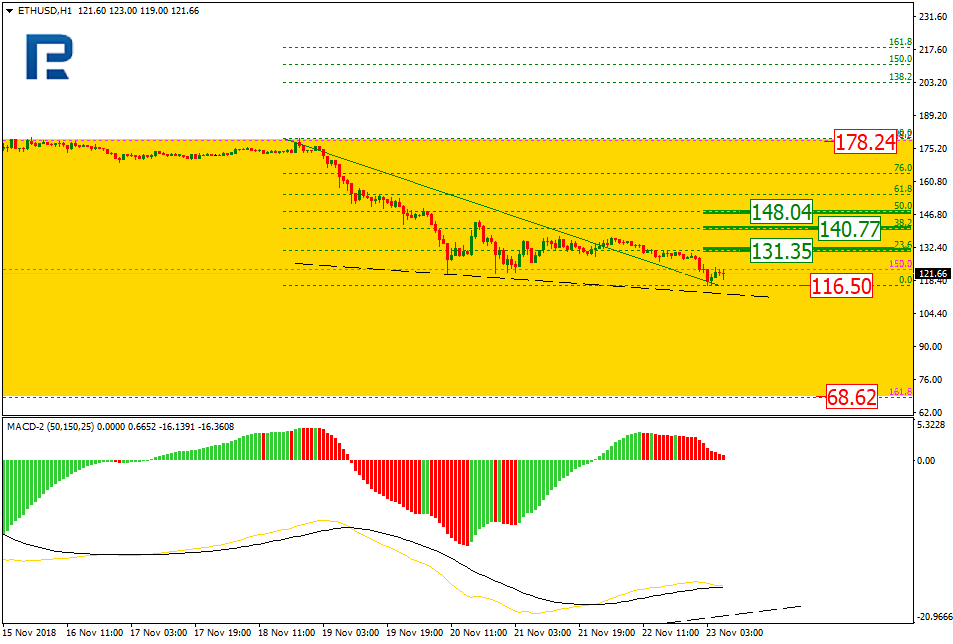
As we can see in the H1 chart, the convergence may force the pair to start a new pullback. The possible targets may be the retracements of 23.6%, 38.2%, and 50.0% at 131.35, 140.77, and 148.04 respectively.
Attention! Forecasts presented in this section only reflect the author’s private opinion and should not be considered as guidance for trading. RoboForex LP bears no responsibility for trading results based on trading recommendations described in these analytical reviews.
Yesterday the EUR/USD were in a sidewards trend. The trading activity was lowered due to the Thanksgiving in the US. At the moment the quotes started to descend. The key support and resistance levels are 1.13600 and 1.14100. Positions should be opened from these levels.
Investors expect an array of business indices from the EU and Germany at 10:30 (GMT+2) and 11:00 (GMT+2).
Indicators do not send accurate signals: the price has crossed 50 MA.
The MACD histogram is near the 0 mark.
Stochastic Oscillator is in the neutral zone, the %K line has is below the %D line, which indicates a bearish sentiment.
Trading recommendations
Support levels: 1.13600, 1.13200, 1.13000
Resistance levels: 1.14100, 1.14500, 1.14800
If the price fixes below the 1.13600 support, expect the EUR/USD to fall further. The movement will tend toward 1.13200-1.13000.
Alternatively, the quotes can grow toward 1.14000-1.14200.
The GBP/USD currency pair
Technical indicators of the currency pair:
Prev Open: 1.27710
Open: 1.28739
% chg. over the last day: +0.78
Day’s range: 1.28303 – 1.28746
52 wk range: 1.2662 – 1.4378
Yesterday, GBP/USD was showing an aggressive buy-out. The quotes grew by 120 points. GBP is supported by the great prospects regarding Brexit. The key range is 1.28300-1.28750. Positions should be opened from these levels.
Today the publication of important economic reports from the UK is not planned.
The price has fixed between 50 MA and 200 MA, which act as the dynamic support and resistance levels.
The MACD histogram is in the positive zone but below the signal line, which give a weak signal towards the purchase of GBP/USD.
Stochastic Oscillator is in the neutral zone, the %K line is below the %D line, which indicates the bearish sentiment.
Trading recommendations
Support levels: 1.28300, 1.27900, 1.27500
Resistance levels: 1.28750, 1.29200, 1.29600
If the price fixes below the support level of 1.28300, the GBP/USD quotes are expected to fall. The movement is tending to 1.27900-1.27500.
An alternative may be the GBP/USD currency pair growth to 1.29200-1.29600.
The USD/CAD currency pair
Technical indicators of the currency pair:
Prev Open: 1.32314
Open: 1.31866
% chg. over the last day: -0.30
Day’s range: 1.31941 – 1.32205
52 wk range: 1.2248 – 1.3387
USD/CAD currency pair was showing a variety of trends. The financial market participants expect for the important economic stats from Canada. The key support and resistance levels are 1.32000 and 1.32250. Positions should be opened from these levels.
At 15:30 (GMT+2) Canada will publish reports on inflation and retail sales.
Indicators do not provide precise signals, the price is testing 200 MA.
The MACD histogram is in the negative zone, but above the signal line, which gives a weak signal to sell USD/CAD.
Stochastic Oscillator is in the neutral zone, the %K line is above the %D line, which indicates the bullish sentiment.
Trading recommendations
Support levels: 1.32000, 1.31700, 1.31450
Resistance levels: 1.32250, 1.32550, 1.32800
If the price fixes above the mirror resistance level of 1.32250, you should consider purchasing USD/CAD. The movement will tend toward 1.32500-1.32800.
Alternatively, if the price fixes below 1.32000, you should look for the market entry points to open the short positions. The movement will tend toward 1.31700-1.31500.
The USD/JPY currency pair
Technical indicators of the currency pair:
Prev Open: 113.056
Open: 112.939
% chg. over the last day: -0.06
Day’s range: 112.834 – 112.883
52 wk range: 104.56 – 114.74
The technical pattern on the USD/JPY currency pair is ambiguous. At the moment, quotes are consolidating. The key support and resistance levels are 112.750 and 113.000, respectively. We recommend paying attention to the dynamics of the US government bonds. Positions should be opened from the key levels. The trading instrument is tending to decline.
Publication of important economic reports from Japan is not planned. Financial markets are closed due to a national holiday.
Indicators indicate the power of the sellers: the price has fixed below 50 MA and 200 MA.
The MACD histogram moved into the negative zone, which creates a signal to sell USD/JPY.
Stochastic Oscillator is in near the oversold zone, the %K line crosses the %D line. There are no signals at the moment.
Trading recommendations
Support levels: 112.750, 112.500, 112.300
Resistance levels: 113.000, 113.250, 113.500
If the price fixes below the support level of 112.750, the USD/JPY quotes are expected to fall. The movement is tending to 112.500-112.300.
An alternative may be the USD/JPY currency pair growth to 113.250-113.500.
The USD didn’t change much relative to the basket of other currencies. Yesterday the US celebrated Thanksgiving, which made the trading a lot more calm. The USD kept the current levels. Today the attention of the financial market participants is focused on the Canadian economic reports. We recommend you keep an eye on the relevant data regarding the US/China trade conflict. Japanese financial markets will be closed due to a government holiday.
GBP and EUR strengthened due to the good prospects regarding the Brexit conundrum. The countries finally agreed on a project that will allow tight partnership even after UK leaves the EU. On November 25, the EU summit will be held, where both sides will sign this project.
The prices on oil keep falling. The WTI futures are testing the 53.30 USD/barrel mark.
Market Indicators
Yesterday the US stock market was closed due to a holiday. Currently, the major indices are testing the monthly minimums.
The 10-year US government bonds yield has stabilized at 3,06-3,07%.
The News Feed for 23.11.2018:
– an array of Business indices (EU and GER) – 10:30 (GMT+2:00) and 11:00 (GMT+2:00);
– reports on inflation and retail sales in Canada – 15:30 (GMT+2:00).
On Thursday the 22nd of November, the euro closed slightly up. High volatility was observed during the European session in connection with the news on Brexit and Italy. The euro/dollar rate rose to 1.1434, after which it stabilised near the trend line at 1.14. Sellers did not pass through this trend line, as US markets were closed and volumes were lowered due to the holiday.
Despite the abundance of news on Brexit and Italy, yesterday’s movement coincided with the forecast. I believe that the correctional model from 1.1359 ended at 1.1343. The price is close to the trend line. Considering the position of the stochastic oscillator in the sell zone and the CCI indicator crossing the level of +100 from the top, according to the forecast, I am expecting a breakout of the trend line and long positions to drop to the 45th degree. Since the US session today is short, in this thin market the decline may increase to 1.1354.
AUDUSD is trading at 0.7250; the instrument is moving above Ichimoku Cloud, thus indicating an ascending tendency. The markets could indicate that the price may test the upside border of the cloud at 0.7245 and then resume moving upwards to reach 0.7350. Another signal to confirm further ascending movement is the price’s rebounding from the channel’s downside border. However, the scenario that Implies further growth may be cancelled if the price breaks the downside border of the cloud and fixes below 0.7210. In this case, the pair may continue falling towards 0.7100. After breaking the channel’s upside border and fixing above 0.7285, the price may continue moving upwards.
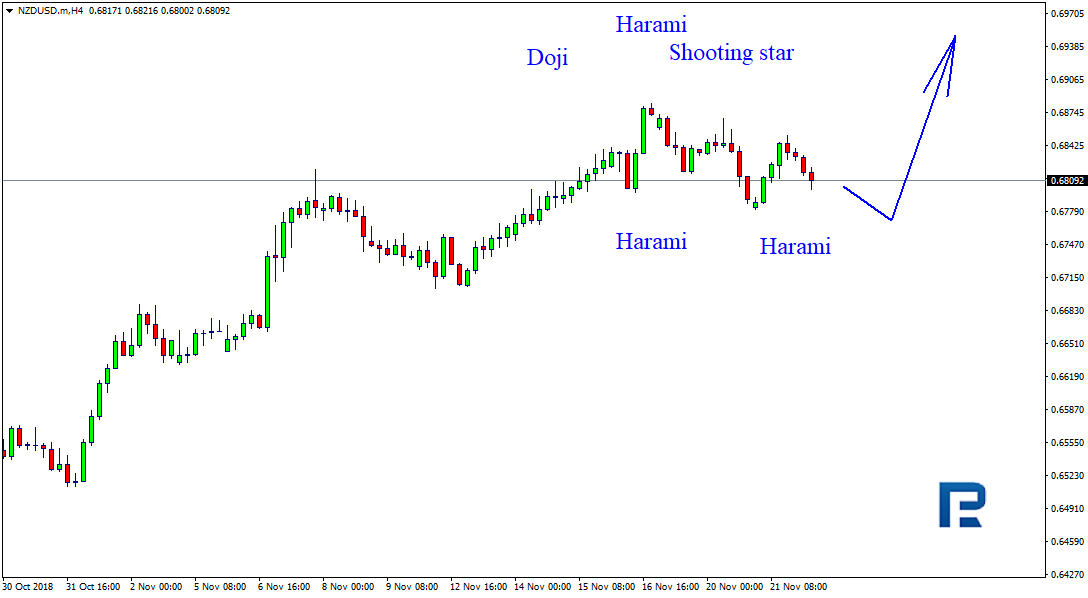
NZDUSD, “New Zealand Dollar vs US Dollar”
NZDUSD is trading at 0.6807; the instrument is moving above Ichimoku Cloud, thus indicating an ascending tendency. The markets could indicate that the price may test the upside border of the cloud at 0.6795 and then resume moving upwards to reach 0.6925. Another signal to confirm further ascending movement is the price’s rebounding from the channel’s downside border. However, the scenario that Implies further growth may be cancelled if the price breaks the downside border of the cloud and fixes below 0.6730. In this case, the pair may continue falling towards 0.6655.
USDCAD, “US Dollar vs Canadian Dollar”
USDCAD is trading at 1.3228; the instrument is moving above Ichimoku Cloud, thus indicating an ascending tendency. The markets could indicate that the price may test the upside border of the cloud at 1.3215 and then resume moving upwards to reach 1.3360. Another signal to confirm further ascending movement is the price’s rebounding from the channel’s downside border. However, the scenario that implies further growth may be cancelled if the price breaks the downside border of the cloud and fixes below 1.3145. In this case, the pair may continue falling towards 1.3045.
Attention! Forecasts presented in this section only reflect the author’s private opinion and should not be considered as guidance for trading. RoboForex LP bears no responsibility for trading results based on trading recommendations described in these analytical reviews.
As we can see in the H4 chart, XAUUSD has completed another growth and formed several Hanging Man, Engulfing, and Shooting Star reversal patterns. Right now, the pair may be corrected again. Judging by the previous movements, it may be assumed that after finishing the pullback the instrument may start a new ascending movement.
NZDUSD, “New Zealand vs. US Dollar”
As we can see in the H4 chart, NZDUSD is still testing the resistance level and forming Harami, Shooting Star, and Doji reversal patterns. Judging by the previous movements, it may be assumed that the test may result in another breakout and the instrument will continue its growth.
Attention! Forecasts presented in this section only reflect the author’s private opinion and should not be considered as guidance for trading. RoboForex LP bears no responsibility for trading results based on trading recommendations described in these analytical reviews.
The EUR/USD currency pair is in a sideways trend. The technical pattern is ambiguous. Investors expect additional drivers. At the moment, the key support and resistance levels are 1.13800 and 1.14150, respectively. Positions should be opened from these marks. Today, trading volume and liquidity will be reduced due to Thanksgiving Day. We recommend reducing the risks when opening positions.
Investors expect the minutes of the ECB monetary policy meeting at 14:30 (GMT+2:00).
Indicators do not send accurate signals: the price has crossed 50 MA.
The MACD histogram is near the 0 mark.
Stochastic Oscillator is in the neutral zone, the %K line has crossed the %D line. There are no signals at the moment.
Trading recommendations
Support levels: 1.13800, 1.13400, 1.13000
Resistance levels: 1.14150, 1.14500, 1.14800
If the price fixes above the resistance level of 1.14150, it is necessary to consider purchases of EUR/USD. The movement is tending to 1.14500-1.14800.
An alternative may be a drop in the EUR/USD quotes to the level of 1.13400-1.13000.
The GBP/USD currency pair
Technical indicators of the currency pair:
Prev Open: 1.27834
Open: 1.27710
% chg. over the last day: -0.09
Day’s range: 1.27791 – 1.27908
52 wk range: 1.2662 – 1.4378
The technical pattern on the GBP/USD currency pair is ambiguous. At the moment, the trading instrument is consolidating. Investors expect additional drivers. The key range is 1.27600-1.28100. Positions should be opened from these marks.
Today the publication of important economic reports from the UK is not planned.
The price has fixed below 50 MA and 200 MA, which indicates the power of sellers.
The MACD histogram is located near the 0 mark. There are no accurate signals at the moment.
Stochastic Oscillator is in the neutral zone, the %K line is below the %D line, which indicates the bearish sentiment.
Trading recommendations
Support levels: 1.27600, 1.27200
Resistance levels: 1.28100, 1.28600, 1.29000
If the price fixes below the support level of 1.27600, the GBP/USD quotes are expected to fall. The movement is tending to 1.27200-1.27000.
An alternative may be the GBP/USD currency pair growth to 1.28400-1.28600.
The USD/CAD currency pair
Technical indicators of the currency pair:
Prev Open: 1.32920
Open: 1.32314
% chg. over the last day: -0.59
Day’s range: 1.32314 – 1.32452
52 wk range: 1.2248 – 1.3387
Yesterday, a technical correction was observed on the USD/CAD currency pair after a significant increase on Tuesday, November 20. Quotes fell by more than 80 points. At the moment, the loonie is consolidating in the range of 1.32250-1.32500. Positions should be opened from these marks. The trading instrument is tending to recover.
The news feed on the economy of Canada is calm.
The price has fixed between 50 MA and 200 MA, which are dynamic support and resistance levels.
The MACD histogram is in the negative zone, but above the signal line, which gives a weak signal to sell USD/CAD.
Stochastic Oscillator is in the neutral zone, the %K line is above the %D line, which indicates the bullish sentiment.
Trading recommendations
Support levels: 1.32250, 1.32000, 1.31750
Resistance levels: 1.32500, 1.32800, 1.33000
If the price fixes above the resistance level of 1.32500, it is necessary to consider purchases of USD/CAD. The movement is tending to 1.32800-1.33000.
An alternative may be a further correction of the USD/CAD currency pair to 1.32000-1.31750.
The USD/JPY currency pair
Technical indicators of the currency pair:
Prev Open: 112.744
Open: 113.056
% chg. over the last day: +0.23
Day’s range: 112.885 – 112.928
52 wk range: 104.56 – 114.74
The technical pattern on the USD/JPY currency pair is ambiguous. At the moment, quotes are consolidating. The key support and resistance levels are 112.800 and 113.100, respectively. We recommend paying attention to the dynamics of the US government bonds. Positions should be opened from the key levels. The trading instrument is tending to decline.
Publication of important economic reports from Japan is not planned.
Indicators do not send accurate signals: the price has fixed between 50 MA and 200 MA.
The MACD histogram is located in the positive zone, but below the signal line, which gives a weak signal to buy USD/JPY.
Stochastic Oscillator is in the neutral zone, the %K line is below the %D line, which indicates the bearish sentiment.
Trading recommendations
Support levels: 112.800, 112.500, 112.300
Resistance levels: 113.100, 113.400, 113.650
If the price fixes below the support level of 112.800, the USD/JPY quotes are expected to fall. The movement is tending to 112.500-112.300.
An alternative may be the USD/JPY currency pair growth to 113.400-113.600.
The US dollar weakened slightly against a basket of major currencies. Yesterday, ambiguous economic statistics from the United States were published. Thus, core durable goods orders rose by 0.1% in October, while experts expected +0.4%. However, existing home sales rose to 5.22M instead of 5.20M. The US dollar index (#DX) closed in the negative zone (-0.14%). Today, trading volume and liquidity will be reduced due to Thanksgiving Day. We recommend reducing the risks when opening positions.
The euro may be under pressure, as it became known that the European Commission intended to punish Italy for the discrepancy of the budget project to the EU rules with a penalty of 0.2% of GDP. Earlier, the European Commission rejected the draft budget of Italy, which suggested a deficit of 2.4% of GDP in 2019. The Italian government was supposed to submit a new draft budget with a revised deficit before November 13. But yesterday, Italian Deputy Prime Minister, Matteo Salvini, made it clear that Italy did not intend to change plans.
The “black gold” prices continue to consolidate after a sharp collapse on Tuesday, November 20. At the moment, futures for the WTI crude oil are testing a mark of $54.40 per barrel.
Market Indicators
The US stock market recovered some losses: #SPY (+0.34%), #DIA (+0.06%), #QQQ (+0.76%).
The 10-year US government bonds yield has become stable. Currently, the indicator is at the level of 3.05-3.06%.
The news feed on 2018.11.22:
Today, the attention of financial markets participants will be focused on the minutes of the ECB monetary policy meeting at 14:30 (GMT+2:00).