Author Archive for InvestMacro – Page 324

Brexit Special: T – 1 Month for Brexit

By Evan Lucas, FPMarkets.com

GBP volatility is through the roof at the moment – GBPUSD and EURGBP implied volatilities are at some of their highest levels in the post-Brexit vote era. The reason: the next 4 weeks is realistically ‘make or break’ for Brexit.

The possible permutations of how Brexit will play out over the coming period are near enough to endless. However, there several outcomes that are more probable than others which is what I want to cover.

I need to quantify and outline the crux of Brexit. The June 2016 Brexit vote asked a binary question for what was really a multi-dimensional, multi-political idea.

• Did the UK people vote to the leave the Single-Market or to change the rules around immigration?

• Did the UK want to use the Westminster legal system rather than that of Brussels?

• Was it a combination of these issues or other issues not mentioned?

This was then rolled up into one Yes/No question – that is why Brexit is such a mess.

Upcoming key date – likely to see max intra-day volatility.

• 25th November – Emergency EU Summit

• 13th – 14th December – Final European Summit of 2018

• 10th – 18th December – Date range for the Commons Vote (actual date not confirmed yet)

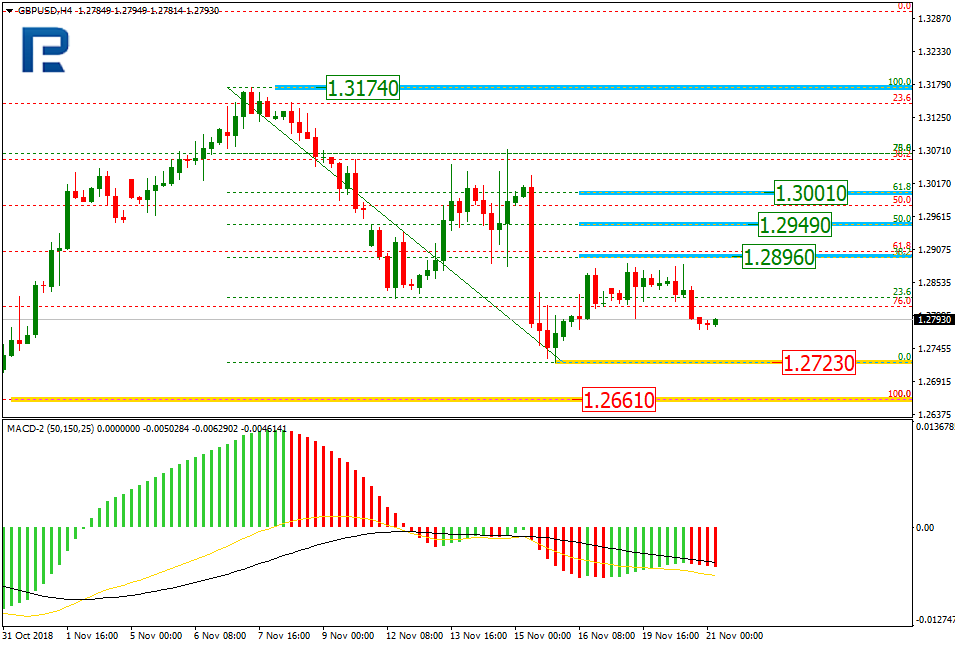
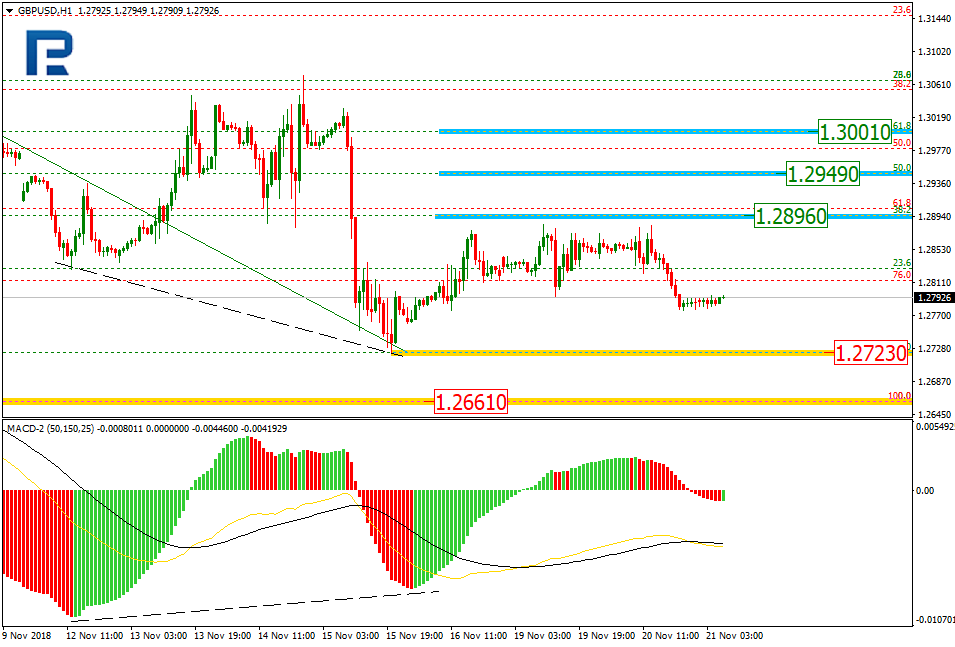
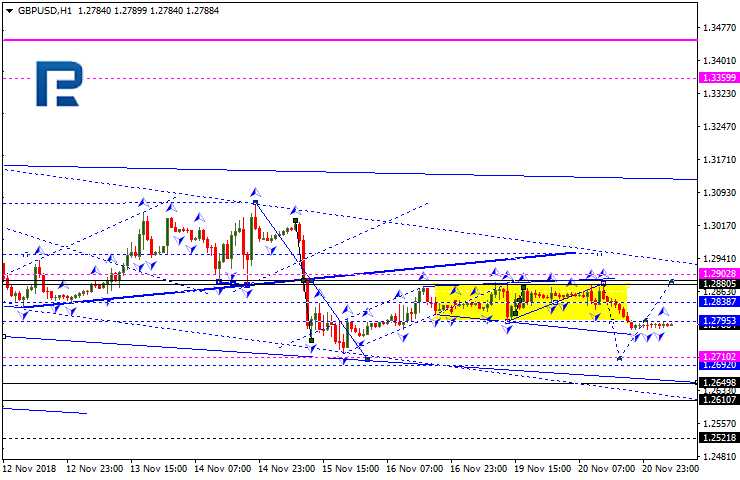
The intraday trading in and around these events as critical – This chart of GBPUSD over the 3 days the draft Withdrawal Agreement was ‘agreed’ upon illustrates perfectly the volatility that is likely to occur around these dates.

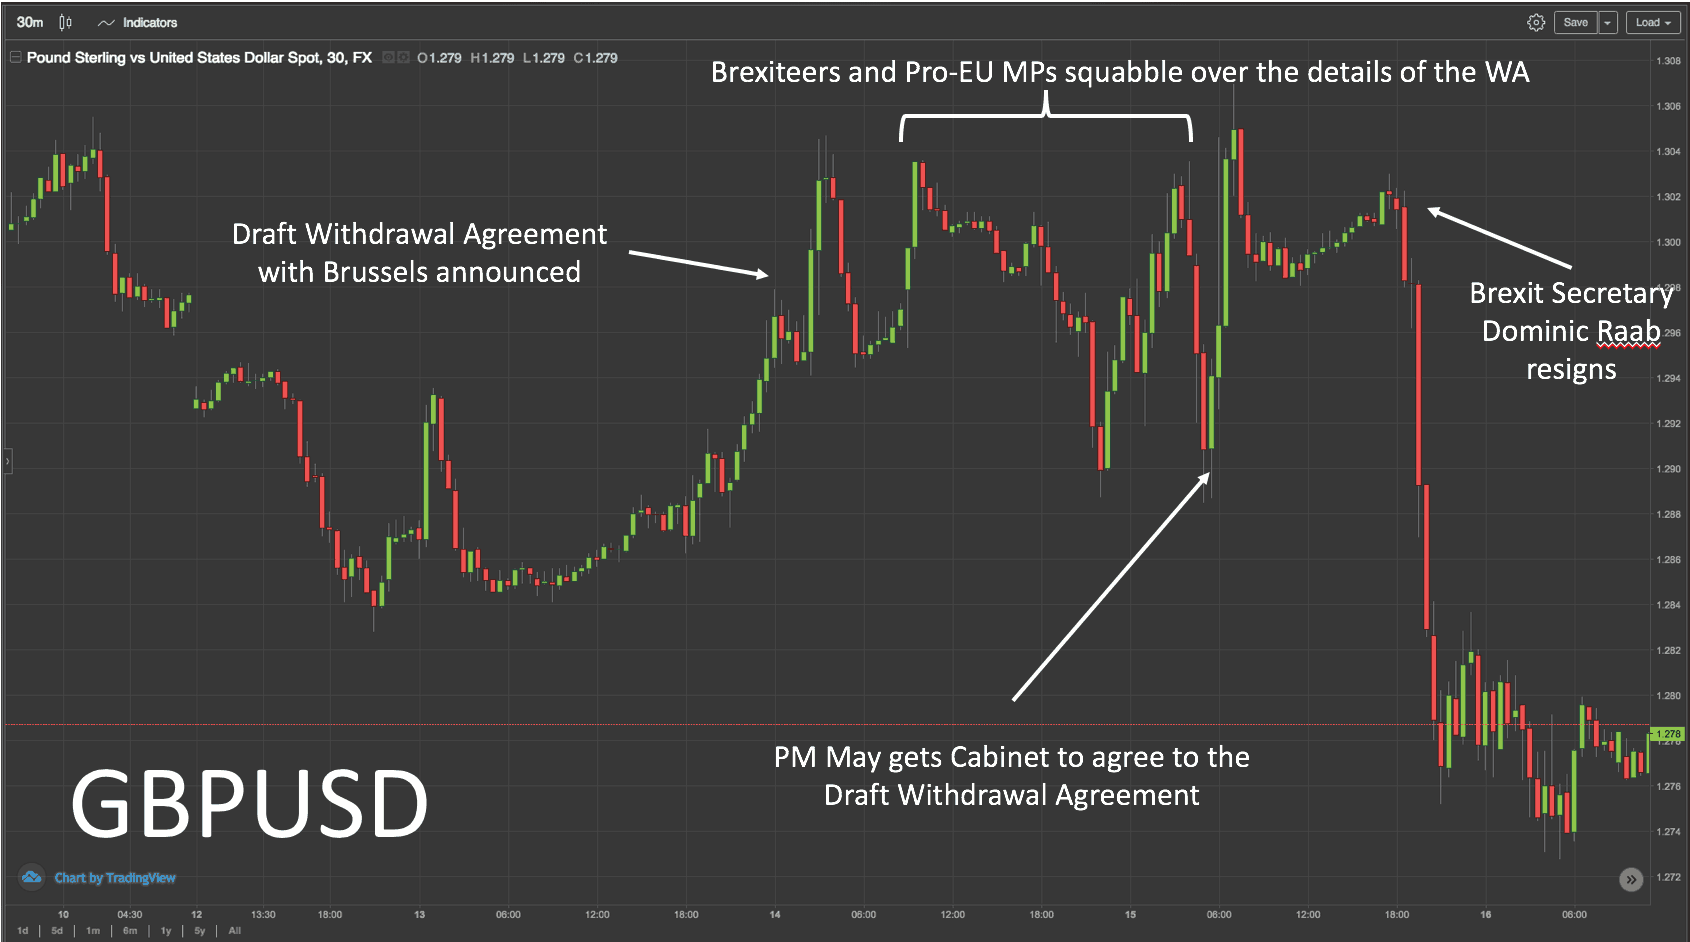
The conclusion from the trading pattern is to have a slight GBP bias v USD and EUR with a strategy of reducing exposure into the votes and to be mindful of the ‘political fallouts’ post the dates.

Possible political permutations of Brexit

‘No Confidence’ vote – leadership spill

1. Looks unlikely now having survived the peak ‘sniping’ period – only 25 letters were received during this time. 48 letters are needed just to start a spill motion and then the majority of conservative MPs need to vote against May’s leadership to bring on a spill – meaning a total 159 Tory MPs need to vote against her.

2. The contenders: Who could replace her as PM is evenly split over at least three candidates making the process of replacing her even more unruly than it already would be. The risk for the (or any) challenger is ‘spill failure’ which would mean a 12 month relief period for May as she cannot be challenged for a year post a spill challenge.

3. The PM position right now is a poison chaise – finding a deal with Brussels and the Commons and then that deal to be accepted by the people is near impossible and thus will tarnish any PM – thus any MP with leadership ambitions is unlike to want to have an actioned Brexit as their legacy.

Thus, will there be a leadership challenge in 2018? No. Again this has a GBP long bias, look to pick up pips here and there. However come April 2019 post the Brexit timeframe, May will most likely be challenged and ousted, in my opinion.

Parliament Votes on ‘Deal’
• The question is how many attempts will be needed to get a deal through the Commons. I believe it will fail at least once as the numbers are razor thin and the current Withdrawal Agreement is already on the ropes from inside the Tory party, so at least two vote take place.

• The group to watch is the DUP which have stated they will not support the current draft Agreement, thus for it to pass the Commons in its current state every single Tory MP plus 4 ‘other’ (Labour, Lib Dems, Greens et. al.) MPs would need to support it.

• Now, the PM’s Whips are likely to pull the DUP and some of the 25 Letter senders into line with ‘doomsday’ predictions if nothing is voted through. BUT even in this scenario reaching the magical 320 MPs needed for a Deal looks THIN!

• Another thought is the 25 Letter senders hold firm the DUP supports the PM meaning 19 ‘others’ would be needed for deal.

In short we have to assume at least one failure at a minimum.

The vote is expected between the 10th and 18th of December – it is the single biggest risk event for GBP for 2018. A short GBP bias leading into the first vote looks like the correct trade but only with small parcels due to the risk involved.

A General Election

Least like of all the ‘permutations’ suggested currently. It is highly discussed topic in GBP markets as it brings into focus what a Corbyn-led government would mean for the UK, Brexit and the like?

However for a general election to be called, 66% of all sitting MPs need to vote for it. That would mean over 100 Tory MP’s would have to vote in favour of a general election – HA! That would mean risking power and putting their ‘scorched earth’ scenario in play – a Corbyn-led government. A general election isn’t even worth discussing. Have a GBP long bias each time you hear this being discussed.

Second Referendum

Has a slightly higher probability than a general election in my opinion however would have to say the probability is sub-10%. However,

• If the first vote fails as expected, the chance of a second Brexit referendum will rise as the market panic will lead to a growing call for a second referendum vote.

• However, the political and democratic repercussions of a second vote are monumental. Thus, the panic would only be a small step towards a second vote, things would have to worsen further still to get this idea to get up.

Would have to suggest that a second referendum is a pipedream and that holding a GBP long bias around this talk would be beneficial.

Other Permutations

• PM May loses support of her Cabinet – the Gang of 5 (Gove is the kingpin here) continue to hold their resignations over the PM. Risk here is there is no real time frame to this event and thus is a general short GBP risk to be aware of. Look at the reaction to Raab’s resignation.

• May tries one more pass at EU on trade – EU won’t budge so May will continue to look weak and thus loses support.

• Irish border issue cause DUP to completely walk and thus Parliamentary vote is doomed.

Conclusion

GBP will remain highly volatile on an intra-day and intra-week basis over this coming period.

However, leading into the second week of December is likely to net appreciate – thus long bias on Cable and short EURGBP are the best options for right now. However once timeline for Parliament Vote is announced, strategy is to reduce exposures and even reverse trade as it is highly likely the vote will fail on first attempt – Remember the vote is the most important event of the 2018 Brexit timeline.

By Evan Lucas, FPMarkets.com


EURUSD: market lull sets in due to Thanksgiving holiday in US

By Matthew Anthony, Alpari

Summary:

On Wednesday the 21st of November, trading on the euro closed slightly up. The stock indices and oil prices correction supported the euro during the day. Market participants even ignored the European Commission’s decision to turn down Italy’s latest budget plan. This decision increased the likelihood of sanctions being imposed on the country. Due to the fact that this process could take several months, the market didn’t react very much to this news.

Day’s news (GMT+3):

  • 15:30 Eurozone: ECB monetary policy meeting accounts.
  • 17:45 Canada: BoC Wilkins speech.
  • 18:00 Eurozone: consumer confidence (Nov).
  • 20:00 Eurozone: ECB’s Mersch speech.
  • 23:55 UK: MPC member Saunders speech.

Fig 1. EURUSD hourly chart.

Current situation:

My expectations that the euro would weaken on the European Commission’s decision did not materialize. The upward correction was delayed in time. Against the backdrop of the overall weakening of the US dollar and the recovery of prices across stock markets, buyers were able to raise the exchange rate to 1.1415 (high: 1.1425). By the close of trading, the price returned to 1.1332.

The technical picture remains bearish despite the corrective movement to the upward movement from the low of 1.1226. The price is trading near the balance and trend lines. Given that the market has leveled out due to uncertainty around Italy, I still expect the euro to weaken to 1.1340 by the close of the trading week.

Today is likely to be flat due to the Thanksgiving holiday in the US. In this regard, I expect fluctuations within yesterday’s range of 1.1365-1.1425. If in the midst of the US dollar’s overall strengthening crosses with the euro go down, then it’s worth lowering the target level from 1.1340 to 1.1345. Now they are all trading in the plus, so it is unlikely that anyone will sell the euro against them.

RoboForex Launches Ethereum Accounts

Nov 22, 2018

Limassol, Cyprus

RoboForex, an international financial broker, is ready to launch accounts with Ethereum as a base currency. The traders will now be able to open accounts, deposit and withdraw ETH. This is yet another crypto based account for RoboForex, the first being Bitcoin in early 2018.

ETH will be available as a base currency for most account types, such as Standard, Cent, ECN, and Prime. Funding and withdrawal is available through Ethereum platform. RoboForex Clients will be able to trade with EHT accounts on MetaTrader 4 and 5. Just like with BTC accounts, ETH will be available as mETH on the platform, with 1 mETH being equal to 0,001 ethers. The maximum leverage is same as for BTC, too, being 50:1.

Ether-based accounts will be especially useful for those who store their funds in ETH. With the newly added account currency it will be easier to diversify risks in a more efficient manner by re-investing the funds into other financial assets.

Our clients are actively using all our crypto products and services‘, says Denis Golomedov, CMO at RoboForex. ‘What we do is try to help them trade in the most comfortable and convenient way possible. We had launched BTC accounts earlier this year and it was quite successful service supply. ETH accounts launch is the result of our global effort invested towards the improvement of the crypto trading solutions.

About RoboForex

RoboForex Ltd is a brokerage company catering to clients from various countries. The company’s focus is providing the traders with access to its own financial market platforms. RoboForex Ltd is a licensed company (License No. IFSC/60/271/TS). To learn more about RoboForex, please go to: www.roboforex.com.


Fibonacci Retracements Analysis 21.11.2018 (GBPUSD, EURJPY)

Article By RoboForex.com

GBPUSD, “Great Britain Pound vs US Dollar”

As we can see in the H4 chart, GBPUSD is being corrected to the upside and has already reached the retracement of 23.6%. In case the correction continues, the possible targets may be the retracements of 38.2%, 50.0%, and 61.8% at 1.2896, 1.2949, and 1.3001 respectively. If the pair breaks the local support at 1.2723, the instrument may fall to test the key support level at 1.2661.

GBPUSD1
Risk Warning: the result of previous trading operations do not guarantee the same results in the future

The H1 chart show more detailed structure of the current correction with a local consolidation range before a new rising impulse.

GBPUSD2
Risk Warning: the result of previous trading operations do not guarantee the same results in the future

EURJPY, “Euro vs. Japanese Yen”

As we can see in the H4 chart, after being corrected by 50.0%, EURJPY hasn’t been able to reach the support level. The current consolidation range in the form of the Flag indicates that the correctional uptrend may yet continue. The upside target may be the retracements of 61.8% and 76.0% at 130.65 and 131.57 respectively.

EURJPY1
Risk Warning: the result of previous trading operations do not guarantee the same results in the future

In the H1 chart, the pair continues moving sideways inside the ascending correction; it has already reached the retracement of 61.8%. The next possible upside targets may be the retracement of 76.0% at 129.51 or even the high at 130.14. The support level is at 127.50.

EURJPY2
Risk Warning: the result of previous trading operations do not guarantee the same results in the future

Article By RoboForex.com

Attention!
Forecasts presented in this section only reflect the author’s private opinion and should not be considered as guidance for trading. RoboForex LP bears no responsibility for trading results based on trading recommendations described in these analytical reviews.

Forex Technical Analysis & Forecast 21.11.2018 (EURUSD, GBPUSD, USDCHF, USDJPY, AUDUSD, USDRUB, GOLD, BRENT)

Article By RoboForex.com

EURUSD, “Euro vs US Dollar”

EURUSD is forming the first descending wave. Possibly, today the price may test 1.1391 from below and then fall with the first target at 1.1313. After that, the instrument may start a new correction to return to 1.1391 and then resume trading inside the downtrend to reach 1.1150.

EURUSD
Risk Warning: the result of previous trading operations do not guarantee the same results in the future

GBPUSD, “Great Britain Pound vs US Dollar”

GBPUSD has completed another consolidation range around 1.2848, broken it to the downside, and right now is trading without any particular direction below 1.2795. According to the main scenario, the price may form a new descending structure to reach 1.2710 and then start another growth to return to 1.2795. Later, the market may resume falling with the target at 1.2650.

GBPUSD
Risk Warning: the result of previous trading operations do not guarantee the same results in the future

USDCHF, “US Dollar vs Swiss Franc”

USDCHF has broken 0.9937 upwards. Possibly, the price may form the first impulse to reach 0.9971 and then start a new correction to return to 0.9937. After that, the instrument may resume trading inside the uptrend with the target at 1.0033.

USDCHF
Risk Warning: the result of previous trading operations do not guarantee the same results in the future

USDJPY, “US Dollar vs Japanese Yen”

USDJPY has broken its descending channel. Possibly, the price may start a new correction; the first target is at 113.08. Later, the market may resume falling towards 112.69 and then grow to complete the correction at 113.40. After that, the instrument may continue trading inside the downtrend with the target at 111.00.

USDJPY
Risk Warning: the result of previous trading operations do not guarantee the same results in the future

AUDUSD, “Australian Dollar vs US Dollar”

AUDUSD has broken 0.7250 downwards and may continue falling with the target at 0.7170. Today, the pair may test 0.7250 from below and then resume falling towards the above-mentioned target. Later, the market may start a new correction to return to 0.7250 and then resume trading inside the downtrend to reach 0.7000.

AUDUSD
Risk Warning: the result of previous trading operations do not guarantee the same results in the future

USDRUB, “US Dollar vs Russian Ruble”

USDRUB is consolidating above 65.60. If later the instrument breaks this range to the upside, the price may start a new correction to reach 66.92; if to the downside – resume trading inside the downtrend with the short-term target at 63.03.

USDRUB
Risk Warning: the result of previous trading operations do not guarantee the same results in the future

XAUUSD, “Gold vs US Dollar”

Gold is consolidating around 1223.10. Possibly, today the price may reach 1216.75 and then start another growth towards 1220.70. After that, the instrument may resume falling with the first target at 1209.85.

GOLD
Risk Warning: the result of previous trading operations do not guarantee the same results in the future

BRENT

Brent is forming the first ascending impulse. Possibly, the price may reach the target at 68.30 and then resume falling towards 65.20. Later, the market may form one more ascending structure with the short-term target at 71.50.

BRENT
Risk Warning: the result of previous trading operations do not guarantee the same results in the future

Article By RoboForex.com

Attention!
Forecasts presented in this section only reflect the author’s private opinion and should not be considered as guidance for trading. RoboForex LP bears no responsibility for trading results based on trading recommendations described in these analytical reviews.

The Analytical Overview of the Main Currency Pairs on 2018.11.21

Analytics by JustForex

The EUR/USD currency pair

Technical indicators of the currency pair:
  • Prev Open: 1.14520
  • Open: 1.13648
  • % chg. over the last day: -0.71
  • Day’s range: 1.13571 – 1.14017
  • 52 wk range: 1.1299 – 1.2557

EUR/USD started to descend. The demand for the risky assets is weakened. Yesterday the EUR/USD quotes fell by more than 85 points, updating the local minimums. At the moment EUR is testing 1.14000 level, which became a mirror resistance. The key support is 1.13650. We expect important economic reports from the US. Positions should be opened from the key levels.

The News Feed for 2018.11.21

  • Core Durable Goods Orders (US) – 15:30 (GMT+2:00);
  • – Secondary Real Estate Reports (US) – 17:00 (GMT+2:00).
EUR/USD

The indicators do not provide precise signals, the price fixed between 50 MA and 200 MA.

The MACD histogram is in the negative zone but above the signal line, which give a weak signal towards the sale of EUR/USD.

The Stochastic Oscillator is in the overbought zone, the %K line started to cross the %D line. There are no signals at the moment.

Trading recommendations
  • Support levels: 1.13650, 1.13300, 1.12800
  • Resistance levels: 1.14000, 1.14350, 1.14650

If the price fixes above 1.14000, expect further growth. Potentially towards 1.14350-1.14600.

Alternatively, the movement will keep falling toward 1.13650-1.13400.

The GBP/USD currency pair

Technical indicators of the currency pair:
  • Prev Open: 1.28470
  • Open: 1.27834
  • % chg. over the last day: -0.49
  • Day’s range: 1.27746 – 1.28200
  • 52 wk range: 1.2662 – 1.4378

Yesterday GBP/USD has been showing a bearish sentiment. The pound has weakened against the USD by more than 65 points and is consolidating. The key range is 1.27750-1.28250. The quotes can descend further. The investors keep waiting for new intel regarding Brexit.

No important news are planned for today.

GBP/USD

The price is below 50 MA and 200 MA, which indicates the power of the sellers.

The MACD histogram is in the red, but above the signal line, which gives a weak signal towards the sale of GBP/USD.

The Stochastic Oscillator is in around the overbought zone, the %K line started to cross the %D line. There are no signals at the moment.

Trading recommendations
  • Support levels: 1.28250, 1.27750, 1.27250
  • Resistance levels: 1.28250, 1.28850, 1.29500

If the price fixes below the support 1.27750, expect further descend of the quotes toward 1.27250-1.27000.

Alternatively, the quotes can grow towards the round 1.28700-1.29000..

The USD/CAD currency pair

Technical indicators of the currency pair:
  • Prev Open: 1.31693
  • Open: 1.32920
  • % chg. over the last day: +1.02
  • Day’s range: 1.32809 – 1.33174
  • 52 wk range: 1.2248 – 1.3387

CAD also weakened against USD yesterday. The USD/CAD quotes grew by 150 points and almost reached the annual maximums. It happened due to the fall of the quotes on oil, wince WTI futures lost 5.5% of their value. At the moment the currency pair is consolidating around 1.32800-1.33150. Positions should be opened from the key levels.

At 15:30(GMT+2) Canada will publish a Wholesale Sales Report.

USD/CAD

The price fixed above 50 MA and 200 MA, which indicates a bullish mood.

The MACD histogram is in the greed but below the signal line, which provides a weak signal towards a purchase of USD/CAD.

The Stochastic Oscillator is in the oversold zone, the %K line crosses the %D line. There are no signals at the moment.

Trading recommendations
  • Support levels: 1.32800, 1.32500, 1.32200
  • Resistance levels: 1.33150, 1.33500, 1.33850

If the price fixes above the resistance level 1.33150, consider buying USD/CAD. The movement will tend toward the round 1.33500-1.33800.

Alternatively, the currency pair can correct to 1.32500-1.32300.

The USD/JPY currency pair

Technical indicators of the currency pair:
  • Prev Open: 112.517
  • Open: 112.744
  • % chg. over the last day: +0.13
  • Day’s range: 112.644 – 112.938
  • 52 wk range: 104.56 – 114.74

The USD/JPY quotes started to grow. At the moment the safe haven currency is testing the resistance level of 112.900. 112.650 is the mirror support. The investors expect important economic reports from the US. We recommend you keep an eye on the trends regarding the US Treasury bonds. Positions should be opened from the key levels.

The news feed is calm for today.

USD/JPY

The price is between 50 MA and 200 MA, indicators do not provide signals.

The MACD histogram is in the positive zone and keeps rising, which give a strong signal towards the purchase of USD/JPY.

The Stochastic Oscillator is in the neutral zone, the %K line crosses the %D line. There are no signals.

Trading recommendations
  • Support levels: 112.650, 112.350
  • Resistance levels: 112.900, 113.200, 113.400

If the price fixes above the resistance 112.900, expect a further growth of the quotes. The movement will tend toward 113.200-113.400.

Alternatively, USD/JPY can fall towards 112.500-112.350.

Analytics by JustForex

The USD Index Recovered Most of the Losses

by JustForex

Yesterday the USD strengthened against the basket of major currencies. The USD index (#DX) updated the local maximums and closed in the green (+0.68%). The demand for the risky assets noticably decreased. The financial market participants are worried about the slowdown of the world economy growth and trading conflicts between the US and China. Additional pressure comes from the aggressive sell-offs on the stock market.

An sudden drop in the prices of oil hit the raw resource currencies hard. During the yesterday’s trading, the CAD weakened against the USD by more than 1%. AUD and NZD also demonstrated a negative trend. The US published some ambiguous reports regarding the retail market. Investors keep evaluating the Brexit conundrum.

Price on oil started to recover after a sharp drop. At the moment the WTI futures are testing the 54.40 USD/barrel mark. We recommend you keep an eye on the reports on the reserves of crude oil in the US at 17:30 (GMT+2:00).

Market Indicators

The US stock market closed in the red again: #SPY (-1,85%), #DIA (-2,15%), #QQQ (-1,79%).

The 10-year US government bonds yield started to recover. At the moment it is at 3,07-3,08%.

The Economic News Feed for 21.11.2018:
  • – Core Durable Goods Orders (US) – 15:30 (GMT+2:00);
  • – Wholesale Reports (CAD) – 15:30 (GMT+2:00);
  • – Secondary Real Estate Reports (US) – 17:00 (GMT+2:00).

by JustForex

EURUSD: euro bulls await European Commission’s decision on Italy’s draft budget

By Matthew Anthony, Alpari

Summary:

On Tuesday the 20th of November, trading on EURUSD closed down. Three bearish movements of 50 pips each were observed during the day. The overall fall amounted to about 1% (from 1.1472 to 1.1359). The fall was facilitated by the overall strengthening of the US currency in response to investors opting to flee from risk and uncertainly around the situation surrounding Italy, which doesn’t want to make changes to its budget. Also, pressure on the dollar’s competitors increased due to the collapse in oil prices (-7.7%) through commodity currencies.

Here are some reasons to sell the euro: falling prices on the European stock exchange, sales of Italian bonds, widening the spread between the yields of Italian and German 10-year securities, and concerns among investors about the Italian banking sector.

Day’s news (GMT+3):

  • 13:30 UK: public sector net borrowing (Oct).
  • 16:30 Canada: wholesale sales (Sep).
  • 16:30 US: durable goods orders (Oct), initial jobless claims.
  • 18:00 US: existing home sales (Oct), Michigan Consumer Sentiment Index (Nov).
  • 18:30 US: EIA natural gas storage change (Nov 16).

Fig 1. EURUSD hourly chart.

Current situation:

The price did not reach the estimated level, however we did hit a Tuesday high. The double bearish divergence worked out excellently. Sellers successfully passed the level of 1.1400, driving buyers to 1.1359.

The current price is 1.1386. The euro is recovering along with oil prices, and according to the forecast, there’ll be a drop to 1.1312. The European Commission today will announce its decision on the Italy’s new draft budget. The EC is expected to reject the it, which will increase the likelihood of new sanctions being imposed. This perhaps the key event of the day. The level of 1.1339 will act as an interim support.

Cryptocurrencies prices take a hit – here’s why it’s a buyers market

By George Prior

Volatility is back in the cryptocurrency market after a relatively long absence – and investors will use it as a major buying opportunity, affirms the CEO of one of the world’s largest independent financial advisory organizations.
The clear message from deVere Group’s founder and chief executive, Nigel Green, comes as leading cryptocurrencies Bitcoin and Ethereum (ETH) were in the red on Monday.
Bitcoin, the largest digital currency by market cap, has fallen in price by $1,400 in 12 days, going below the $5,000 threshold for the first time since October 2017.  The bearish sentiment is echoed in a broader decline in the overall crypto market capitalization over the last few days.
Mr Green observes: “Just a few weeks ago crypto traders were airing concerns about the lack of volatility in the crypto market.
“Now volatility is back and many savvy investors will be using this as a major buying opportunity, perhaps the last one of 2018.
“Savvy investors understand that digital currencies are the future of money and, as such, they will be capitalizing on the lower prices in order to build their portfolios and shore-up their positions.”
He continues: “There are three main drivers for the current bout of volatility.
“First, is the uncertainty surrounding the Bitcoin Cash hard fork.”
Last week, a new version of Bitcoin Cash was launched, which was itself a ‘fork’ from the original Bitcoin blockchain. Bitcoin Cash is now known as Bitcoin ABC and the new fork is called Bitcoin SV.
These forks generate turbulence in the market because investors have to choose which version they will support.
“Second is the recent scrutiny of the SEC, the U.S. financial regulator.  However, I have long supported and called for regulation of the crypto sector.  Indeed, regulation of the digital currencies is now, I believe, inevitable and will in the longer term give investors even more protection, driving confidence and prices in the burgeoning market.
“And third is the infamous ‘herd mentality’ of some investors. Simply, some of the cryptocurrencies are lower because they went lower.
“Prices might fall further over the next few days, but we can expect a long-term upward trajectory for the crypto sector.”
The deVere CEO concludes: “Crypto cynics are using this current wave of volatility to knock digital currencies.  Whether it is Bitcoin, or any of the current generation of coins, or not, cryptocurrencies are here to stay.
“Financial traditionalists view cryptocurrencies the way traditional stores used to view online retailers.”
“But with their hands in the sand they are failing to see that cryptocurrencies have already changed forever the way the world handles money, makes transactions, does business, and manages assets.”

About:

deVere Group is one of the world’s largest independent advisors of specialist global financial solutions to international, local mass affluent, and high-net-worth clients.  It has a network of more than 70 offices across the world, over 80,000 clients and $12bn under advisement.


Can We Expect A Major Rebound In Oil Prices?

By OilPrice.com

After declining by more than 20 percent from the October peak, oil prices are showing some signs that they have now bottomed out.

WTI hit a low point at $56 per barrel on Wednesday and Brent hit a low just below $65 per barrel. Both crude benchmarks regained some ground at the end of the week, despite the huge increase in U.S. crude oil inventories. In fact, rising prices in the face of the 10-million-barrel increase in crude stocks suggests that oil may have already hit a bottom. “[Y]esterday’s price reaction to the US inventory data shows that negative news is now largely priced in,” Commerzbank said in a note. “This is the only way to explain why an increase in US crude oil stocks of a good 10 million barrels failed to put further pressure on prices.”

At the same time, crude stocks have now climbed for eight consecutive weeks, surely a sign that the market is decidedly back in a surplus situation. That is bearish, to be sure, and helps explain the collapse in oil prices over the past month.

But it also significantly increases the odds of a response from the OPEC+ coalition in early December. “[W]e believe oil is oversold and will likely bounce up from the current levels, as OPEC+ dials back production in December,” Bank of America Merrill Lynch said in a note on Wednesday. The bank said that it no longer sees Brent rising to $95 per barrel next year, as it previously thought, noting that “oil bulls have capitulated and so have we.”

However, the liquidation of net-long positioning by hedge funds and other money managers has taken a lot of pressure out of the market. As a result, there is more room on the upside once again. “[T]he oil market is a lot cleaner now from a positioning standpoint. Given that inventories are still not too high, we believe oil prices should find some support from a fundamental perspective,” BofAML wrote.

Barclays pointed to some fundamentals to suggest that things aren’t as bad as they seem. For instance, OECD stocks in terms of “days of demand cover,” remain below the five-year average. “Based on our balances, we expect the amount of inventories in the OECD on a days of demand cover basis to remain supportive of prices through the end of next year,” Barclays said in a note.

Moreover, the waivers on Iran sanctions are temporary, and even though the U.S. was more lenient than expected, Iran should continue to lose exports in the months ahead. Indeed, the recent price crash actually gives the Trump administration a lot more room to work with, and it can take a harder line with the eight countries it granted waivers to the next time around.

Finally, lower prices could shut in marginal supply and stimulate demand. Barclays even suggests that Iran may step up threats on the Strait of Hormuz because of lower prices, while Venezuela might lose output at a faster rate.

Still, a price increase from current levels hinges on action from OPEC+. Saudi Arabia has already signaled that it intends to lower exports by 500,000 bpd in December, and that further action might be forthcoming from OPEC+. Russian officials told Reuters that they are not enthusiastic about the 1.4-million-barrel-per-day cut that was reported in the media, but that they might sign on to something more on the order of 1 mb/d.

These rumors tend to drive the market and the price gains seen on Thursday and Friday may have been somewhat driven by rising expectations of OPEC+ action. As these things go, oil traders buy and sell on the rumor. More specifically, the 500,000-bpd Saudi cut is already being priced into the market, and the potential 1-mb/d cut from OPEC+ collectively is now increasingly being factored into the market as well. Because there are now rumors of a cut as large as 1.4 mb/d, the 1 mb/d option could take on a “middle-of-the-road” option. Anything less will be a huge disappointment and could drag oil prices back down.

The IEA noted that the global supply surplus could rise to as much as 2 mb/d in the first half of 2019 based on the trajectory of the current fundamentals. It will require OPEC+ action to head that off.

Link to article: https://oilprice.com/Energy/Oil-Prices/Can-We-Expect-A-Major-Rebound-In-Oil-Prices.html

By Nick Cunningham of Oilprice.com