Article By RoboForex.com
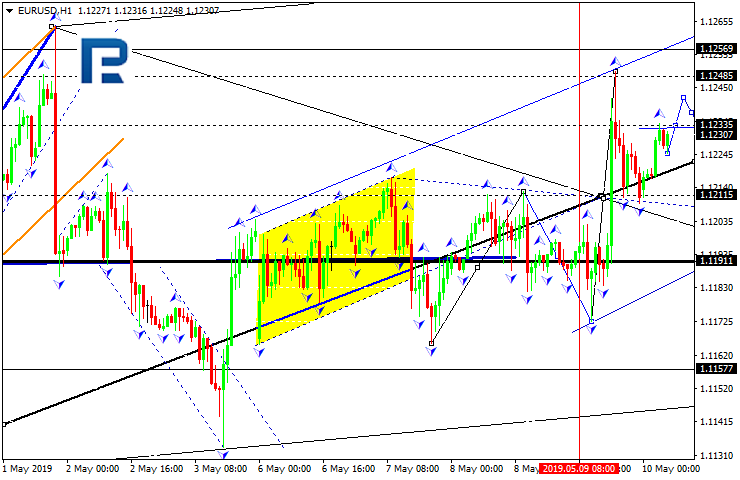
EURUSD, “Euro vs US Dollar”
EURUSD is trading above 1.1211; it is forming a new consolidation range around 1.1233 and may move to reach the target at 1.1257. Possibly, today the pair may form a new descending structure towards 1.1216 and then start another growth to reach 1.1257. Later, the market may be corrected to return to 1.1211 and then resume growing with the target at 1.1289.


GBPUSD, “Great Britain Pound vs US Dollar”
GBPUSD has finished the first ascending impulse along with the correction; right now, it is still consolidating. If later the price breaks the range to the upside, the instrument may continue the correction with the short-term target at 1.3073; if to the downside – form a new descending structure towards 1.2956.

USDCHF, “US Dollar vs Swiss Franc”
USDCHF has reached the target of the third descending wave. Today, the pair may be corrected towards 1.0157. After that, the instrument may form a new descending structure with the target at 1.0080.

USDJPY, “US Dollar vs Japanese Yen”
USDJPY is still consolidating near the lows. If later the price breaks the range to the upside, the instrument may start a new correction with the target at 110.61; if to the downside – continue falling towards 108.98.

AUDUSD, “Australian Dollar vs US Dollar”
AUDUSD is still consolidating around 0.6996. Possibly, today the pair may fall to reach 0.6950 and start a new growth to return to 0.6996.

USDRUB, “US Dollar vs Russian Ruble”
USDRUB is moving upwards; it has broken 65.30 and may continue growing to reach 66.01. Today, the pair may reach this level and then start a new decline to break 64.85. Later, the market may continue trading inside the downtrend with the target at 62.77.

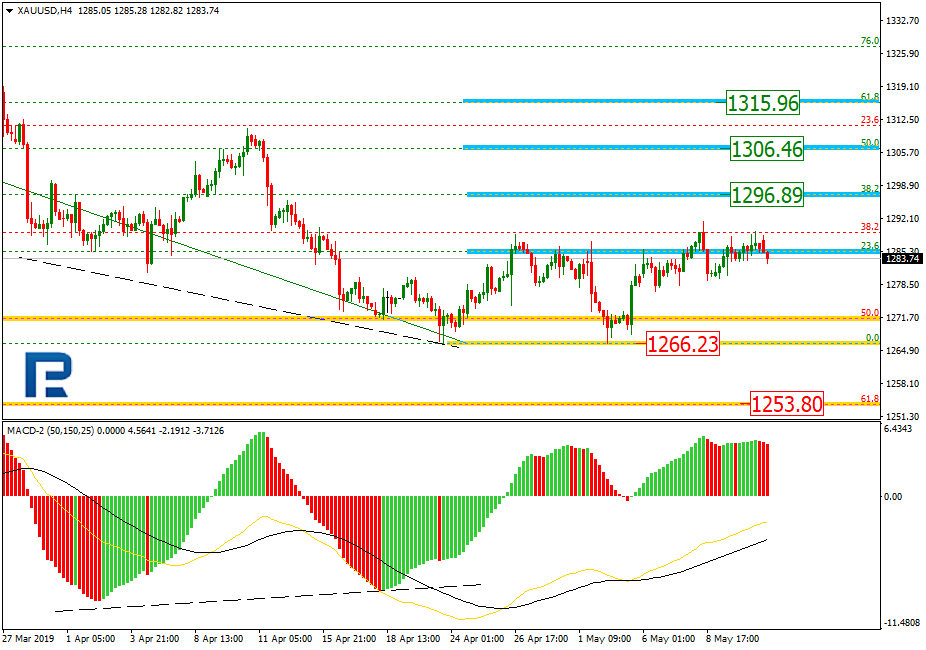
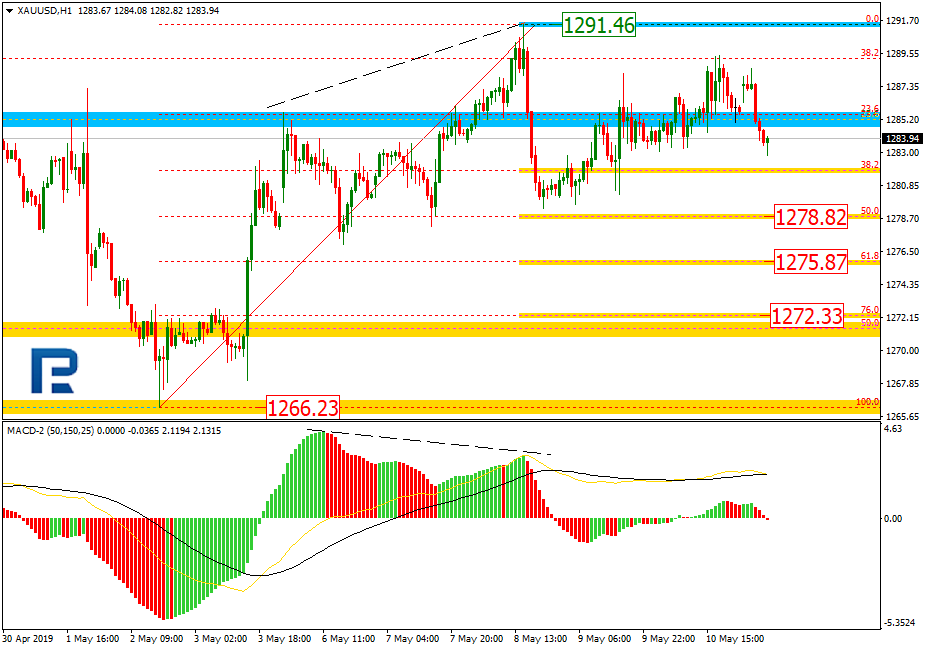
XAUUSD, “Gold vs US Dollar”
Gold is consolidating around 1284.24. If later the price breaks the range to the downside, the instrument may resume trading inside the downtrend with the target at 1277.01; if to the upside – form one more ascending structure towards 1293.30.

BRENT
Brent has broken 70.70 and may continue growing to break 72.30. If later the price breaks this level to the upside, the instrument may resume trading inside the uptrend with the target at 76.50. However, if the pair breaks 70.70 to the downside, the market may continue the correction to reach 68.00.

Article By RoboForex.com
Attention!
Forecasts presented in this section only reflect the author’s private opinion and should not be considered as guidance for trading. RoboForex LP bears no responsibility for trading results based on trading recommendations described in these analytical reviews.