The US dollar fell slightly against a basket of major currencies. The dollar index (#DX) closed in the negative zone (-0.07%). Investors are closely monitoring the development of the trade relationship between the US and China. According to the US President, Donald Trump, countries will probably close a deal this week. “It’s possible to do it, they’re all here. The vice premier one of the most respected men one of the highest officials in China is coming,” Trump said in Washington on Thursday. Also, the US President said that he might soon hold talks with Chinese President Xi Jinping by telephone.
Yesterday, mixed economic data were also published in the United States. Thus, the producer price index rose by 0.2% in April, which met the expectations of experts. However, initial jobless claims rose to 228K, while investors expected an increase by 215K. Today, we expect important economic data from the US, the UK, and Canada.
The “black gold” prices are consolidating. At the moment, futures for the WTI crude oil are testing the mark of $62.15 per barrel.
Market Indicators
Yesterday, sales were observed in the US stock market: #SPY (-0.30%), #DIA (-0.47%), #QQQ (-0.54%).
The 10-year US government bonds yield is at 2.44-2.45%.
The news feed on 2019.05.10:
– UK GDP data at 11:30 (GMT+3:00); – Manufacturing production in the UK at 11:30 (GMT+3:00); – Core consumer price index in the US at 15:30 (GMT+3:00); – Statistics on the labor market in Canada at 15:30 (GMT+3:00).
Smart traders are already asking themselves “where is the bottom for this move”. They’ve likely been through these types of rotations in market price before and understand the fundamentals of the US economy are strong enough to support further upside price activity in the near future. The current US/China trade worries could result in a pricing disruption of 4 to 8%, seen as rotation, yet the US Fed is continuing to leave rates unchanged and most US economic numbers are still posting strong levels.
So, smart traders want to know where the bottom in the market is likely to be found and when they should start to accumulate new long positions – which is understandable. We’re here to help.
Our proprietary Fibonacci price modeling system is one of the unique modeling tools we use to hone into any market move. The reason for this is because it shows us so much data that we can “read into” our analysis/research. The other reason is that it is an “adaptive learning” model – which means it continues to learn from price data and adapt its analysis of that data.
Let’s start with the Weekly YM chart. The GREEN highlighted box on this chart shows where the past two Bullish Fibonacci price trigger levels were generated. These, obviously, become key support levels going forward. The narrow ORANGE box near the current peak is the resistance channel we highlighted many weeks ago that suggested a volatility rotation peak may be setting up. We have also drawn an oblique/circle on the chart in BLUE that highlights upside Fibonacci target price levels.
It is our opinion that a further downside leg, possibly to levels below $25,000, are possible as this Shake-Out continues and as the global markets continue to revalue expectations. We are watching the currencies very closely as the Chinese Yuan has devalued extensively over the past few days. This US Dollar strength will keep metals fairly flat while prompting some extra stability in the US stock market over time.
This next chart, the NQ Weekly, shows a similar chart format to that of the YM. Clear resistance can be seen near the recent highs and support is found near the $6600 level from previous Fibonacci Bullish Price Trigger Levels. The NQ, being very heavily weighted in Technology and Internet stocks, may have the ability to fall the furthest within this price rotation – possibly as much as -700 to -800 pts before finding support. Currently, a support level near $7400 is the first level we are watching. If the NQ breaks below this level, then we could see a much bigger move to the downside unfold fairly quickly.
Lastly, the Transportation Index (TRAN) is showing us that the downside price move may have already reached a level that may prompt intermediate price support – or a potential base formation. The $10,400 to $10,500 level, which was already reached, appears to be the initial support level for the TRAN. It would make sense that the TRAN may begin to base near this level over the next few days/weeks while the US stock market attempts to hammer out a bottom.
Ultimately, the $10,000 level has proven to be very strong historical support for the TRAN. So any breakdown in this index would immediately prompt a target level of $10,000 for the next support level. Again, pay attention to the US Dollar and Gold as this movement continues. Any real fear will translate into a weaker US Dollar and increasing prices in precious metals.
In closing, we believe the early signs of a potential price bottom are setting up right now. This may not be the ultimate bottom, but the clear support level in the TRAN is a very good sign that the markets are setting up a support base that may prompt some sideways trading over the next few weeks as the market continues to digest all this global trade news. A deeper “washout-low” price formation may set up in the INDU or the NQ over the next few days which means we may see a deeper price rotation before the downtrend actually ends.
Right now, pay attention to our continued research and we’ll help you find the bottom when it forms. Our current expectations are for a continued downside price move that will establish a washout-low formation over the next 3 to 10 trading days. We’re not out of the woods yet, but we are starting to see the early signs of price support – which means a bottom may not be too far off.
UNIQUE OPPORTUNITY ONLY IN MAY
On May 1st we talked about the old saying goes, “Sell in May and Go Away!” and that is excactly what is happening now right on queue. In fact, we closed out our SDS position today for a quick 3.9% profit and our other new trade started today is up already 10%.
Second, my birthday is only a few days away and I think its time I open the doors for a once a year opportunity for everyone to get a gift that could have some considerable value in the future.
Right now I am going to give away and shipping out silver rounds to anyone who buys a 1-year, or 2-year subscription to my Wealth Trading Newsletter. I only have 13 left as they are going fast so be sure to upgrade your membership to a longer-term subscription or if you are new, join one of these two plans, and you will receive:
1-Year Subscription Gets One 1oz Silver Round FREE (Could be worth hundreds of dollars)
2-Year Subscription Gets TWO 1oz Silver Rounds FREE (Could be worth a lot in the future)
I only have 13 more silver rounds I’m giving away so upgrade or join now before its too late!
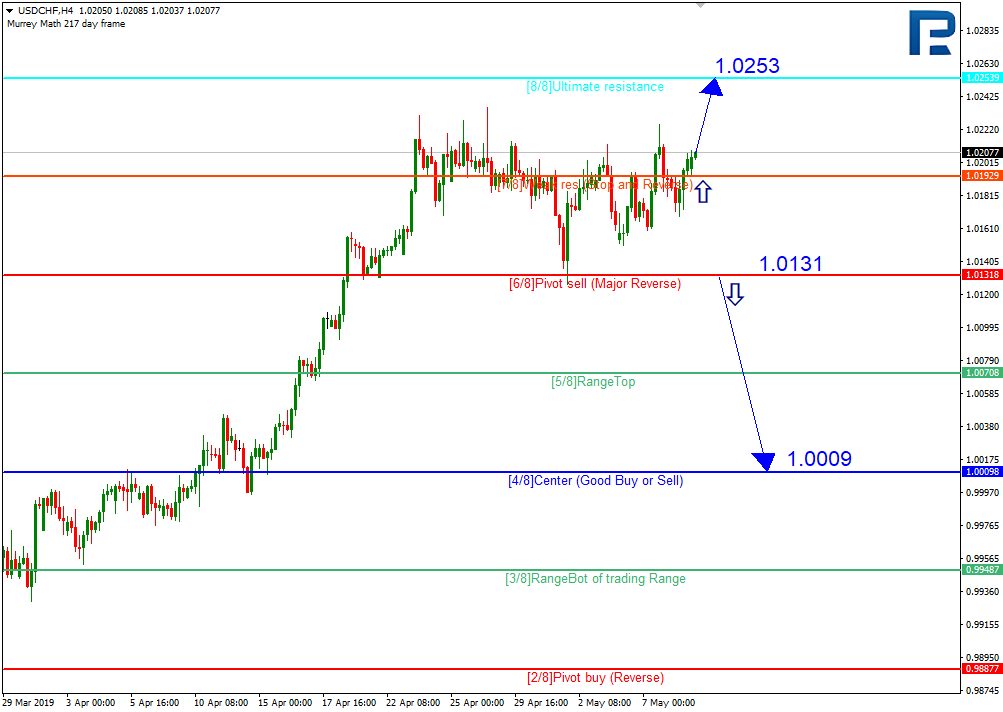
As we can see in the H4 chart, USDCHF is trading upwards and may continue this movement towards the resistance at the 8/8 level. However, this scenario may be cancelled if the instrument breaks the 6/8 level. In this case, the price may continue falling towards the support at the 4/8 one.
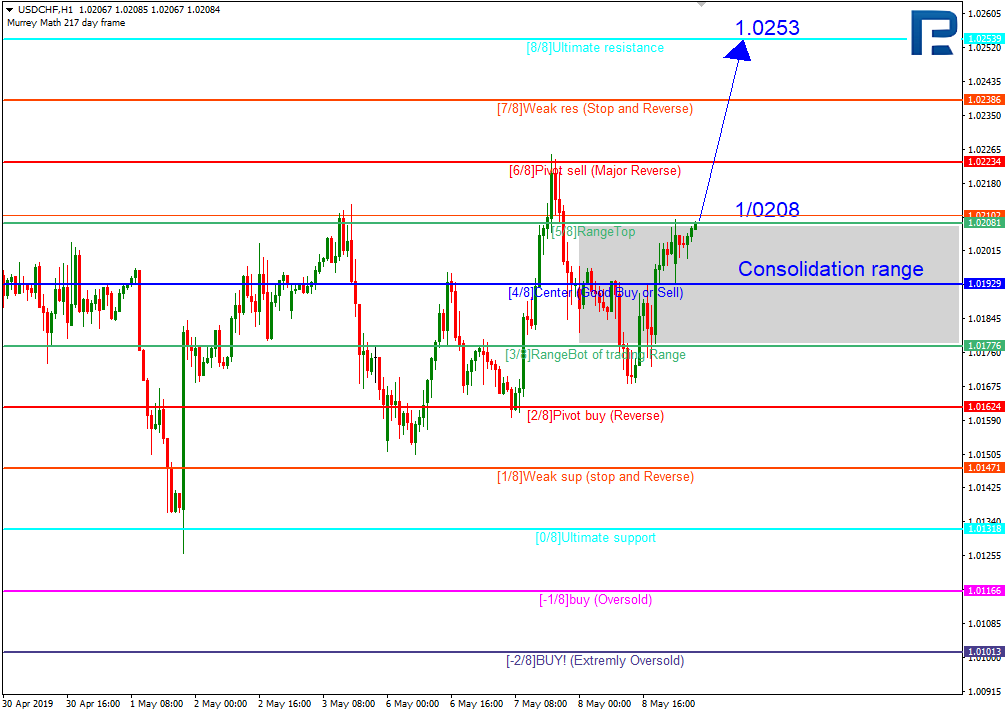
In the H1 chart, the pair is consolidating close to the upside border of the range. In this case, the instrument may break the 5/8 level and continue moving upwards to reach the resistance at the 8/8 one.
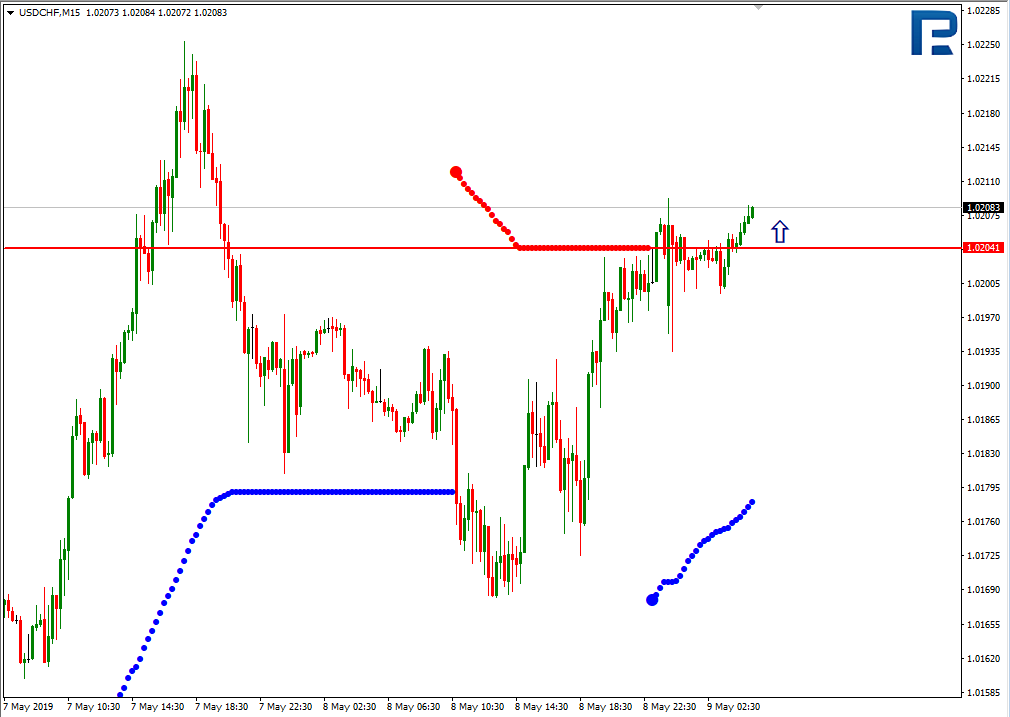
As we can see in the M15 chart, the pair has broken the upside line of the VoltyChannel indicator and, as a result, may continue trading upwards.
XAUUSD, “Gold vs US Dollar”
In the H4 chart, XAUUSD is still consolidating. In this case, one should wait until the price breaks one of the borders and decides on where to go in the future. There are two possible scenarios. The first scenario implies that the pair may break the 5/8 level and continue growing to reach the resistance at the 7/8 one. According to the second one, the instrument may break the 3/8 level and continue falling towards the support at the 1/8 one.
As we can see in the M15 chart, the pair has broken the downside line of the VoltyChannel indicator and, as a result, may continue trading downwards. However, if the price breaks the indicator’s upside line, the above-mentioned scenario may be cancelled.
Attention! Forecasts presented in this section only reflect the author’s private opinion and should not be considered as guidance for trading. RoboForex LP bears no responsibility for trading results based on trading recommendations described in these analytical reviews.
(Or How Carl Schmitt Took Over the 21st Century White House)
By Dan Steinbock
Since the Nixon era, the lure of executive power has increased in the White House. After decades of global integration, misguided policy decisions, legitimized in the name of ‘national security,’ can derail economic prospects in America and worldwide. The doctrines share a dark history.
The first administration to make explicit reference to the “Unitary Executive” was the Reagan administration. Typically, the practice has evolved since the 1970s, when President Nixon decoupled U.S. dollar from the Bretton Woods gold standard and trade deficits began to rise.
The terrorist attacks of 9/11 allowed the George W. Bush administration to make the unitary executive theory a common feature of signing statements, particularly in the execution of national-security decisions, which divided the Capitol Hill and were opposed by most Americans.
In the case of Trump, the need for inflated unitary executive power arose with the Mueller investigation, which restricted the president’s strategic maneuverability to operate with the Republican Congress in 2017-18 but permitted actions that required only executive power, typically in tax and trade policy.
In this view, efforts at a U.S.-Sino trade compromise may prove more challenging than anticipated, as evidenced by the extended truce talks. Even a trade compromise may prove unlikely to deter subsequent bilateral technology wars, which have been heralded by U.S. actions in the case of Huawei and longstanding efforts to sustain American primacy in 5G technologies. As U.S. production capacity has been offshored since the 1980s, such efforts rely on national security considerations.
If the trade war is less about trade than about U.S. effort at economic and strategic primacy, no “concession” may prove enough to the Trump White House which may be more likely to re-define the status quo on the basis of a national emergency. That would explain recent flirting with 25% tariffs and the renewed trade war with China by the Trump administration.
Executive Power and the ‘State of Exception’
What looms behind the Trump White House in the 21st century is a tradition of conservative thought relying on the unitary executive theory in American constitutional law, which deems that the President possesses the power to control the entire executive branch. Its precursors go back to the darkest 20th century.
As the controversial German jurist Carl Schmitt saw it in the interwar Third Reich, legal order ultimately rests upon the decisions of the sovereign, who only can meet the needs of an “exceptional” time and transcend legal order so that order can then be reestablished: “Sovereign is he who decides on the exception.”
In the post-Weimar Germany, such ideas contributed to the eclipse of liberal democracy. Following September 11, 2001, similar arguments renewed neoconservative interest in Schmitt and the “state of exception.” In this world the status quo is in a permanent state of exception, as enemies -”adversaries, others, and strangers” – will unite “us” against ‘them.” In this view, the U.S. response to 9/11 was not unusual because liberal wars are ‘exceptional”. Rather, it was a manifestation of ever more violent types of war within the very attempt to fight wars which would end ‘war” as such.
Similarly, it is politically expedient to legitimize a trade war and other political battles in the name of “national security,” which allows the sovereign to redefine a new order on the basis of a state of exception. Subsequently, a new national security strategy redefines “friends” as ”enemies” and “us” as victims who are thus justified to seek justice from our “adversaries” – “them.”
The logic of the state of exception leaves open the question how the White House could establish such a trade war as a sovereign, when such trade wars have not been supported by most Trump constituencies and have been opposed by much of the Congress and by most Americans.
The Lure of Imperial Presidency
Historically, the idea of the “Imperial Presidency” in America is hardly new, as historian Arthur M. Schlesinger, Jr. demonstrated in the Nixon era: “The weight of messianic globalism was indeed proving too much for the American Constitution… In fact, the policy of indiscriminate global intervention, far from strengthening American security, seemed rather to weaken it by involving the United States in remote, costly and mysterious wars.”
Ostensibly moderate administrations, including President Obama’s, have not been exception to the rule, as evidenced by multiple decisions to use force without congressional approval. During Obama’s first term in office, America expanded its military presence in Afghanistan and increased drone missile strikes across Pakistan, Yemen, and Somalia. The administration also deployed the military to combat piracy in the Indian Ocean, engaged in a sustained bombing operation in Libya, and deployed U.S. Special Forces in Central Africa. In these cases, President Obama decided to use force without congressional approval.
In the course of the past half a century and a series of asset bubbles, a slate of new foreign interventions, the Iraq War debacle and the $22 trillion U.S. sovereign debt, Imperial Presidency has become a target of broader criticism. But why has it proven grown even harder to challenge?
Certainly, one critical force has been campaign finance and the increasing role of “big money” in American politics. In particular, the Supreme Court’s 5-4 decision in Citizens United v. Federal Election Commission, which struck down a federal prohibition on independent corporate campaign expenditures, paved the way for corporate power to override democratic power in the White House.
At the same time, the ultra-rich have begun to play more active part in politics, with serious consequences for American democracy, as many American political scientists have warned.
In the new status quo, neither 20th century American Empire nor 21st century Third Reich is needed for majestic policy mistakes. Imperial Presidency will do. Indeed, even the sovereign’s executive power may suffice.
Emergency Powers in Time of Peace
The uses of executive power are likely to go far beyond the current rivalry for artificial intelligence (AI), as evidenced by President Trump’s efforts to re-define, re-negotiate or reject major U.S. trade deals on the basis of national security. By the same token, foreign investment reviews will be overshadowed by national security considerations.
As postwar multilateralism has been replaced with unilateralism, the White House sees itself in international strategic competition with other great powers, particularly Russia and China, yet old allies – including Europe and Japan – are not excluded.
Since U.S. Constitution ensures the president a relatively broad scope of emergency powers that may be exercised in the event of crisis, exigency, or emergency circumstances (other than natural disasters, war, or near-war situations), it matters how the White House chooses to apply its definition of a ‘state of exception.’
Under the current, wide definition, it is prudent to expect escalated international trade disputes between the U.S. and other members of the World Trade Organization (WTO), even against the WTO. Citing diffuse national security reasons, the White House defends its tariffs under the GATT Article XXI; the so-called “national security exception.”
There is a big difference between the repercussions of such executive decisions in the postwar era and the early 21st century. In the past, policy mistakes could penalize U.S. economy and democracy. After half a century of increasing global interdependency, they can derail global economic prospects.
About the Author:
Dr. Dan Steinbock is the Founder and Director of Difference Group and has served at the India, China and America Institute (US), Shanghai Institute for International Studies (China) and the EU Center (Singapore). For more, see http://www.differencegroup.net/
The commentary draws in part from his new analysis, “U.S.-Sino Futures,” released by Chinese Quarterly of International Studies (CQISS). The original version was released by U.S.-based ConsortiumNews on May 6, 2019.
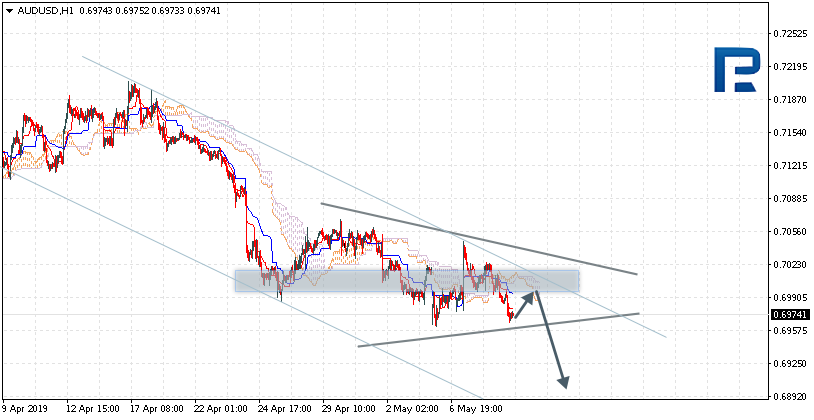
AUDUSD is trading at 0.6974; the instrument is moving below Ichimoku Cloud, thus indicating a descending tendency. The markets could indicate that the price may test the downside border of the cloud at 0.7005 and then resume moving downwards to reach 0.6895. Another signal to confirm further descending movement is the price’s rebounding from the channel’s upside border. However, the scenario that implies further decline may be cancelled if the price breaks the upside border of the cloud and fixes above 0.7035. In this case, the pair may continue growing towards 0.7115. After breaking the downside border of the Triangle pattern and fixing below 0.6945, the price may continue moving downwards.
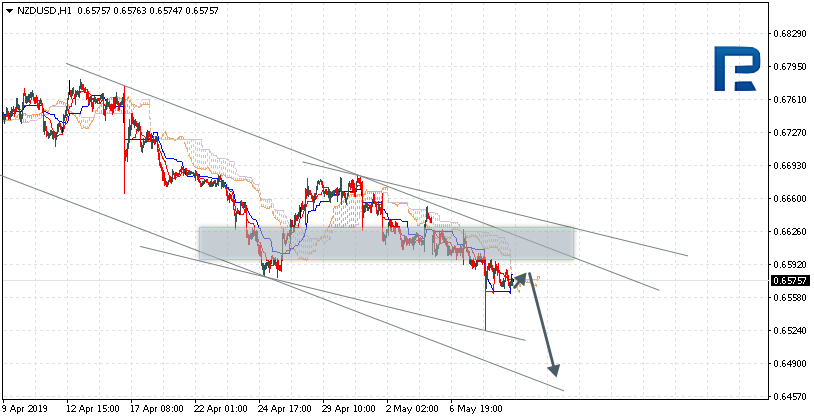
NZDUSD, “New Zealand Dollar vs US Dollar”
NZDUSD is trading at 0.6575; the instrument is moving below Ichimoku Cloud, thus indicating a descending tendency. The markets could indicate that the price may test the upside border of the cloud at 0.6580 and then resume moving downwards to reach 0.6475. Another signal to confirm further descending movement is the price’s rebounding from the channel’s upside border. However, the scenario that implies further decline may be cancelled if the price breaks the upside border of the cloud and fixes above 0.6605. In this case, the pair may continue growing towards 0.6685.
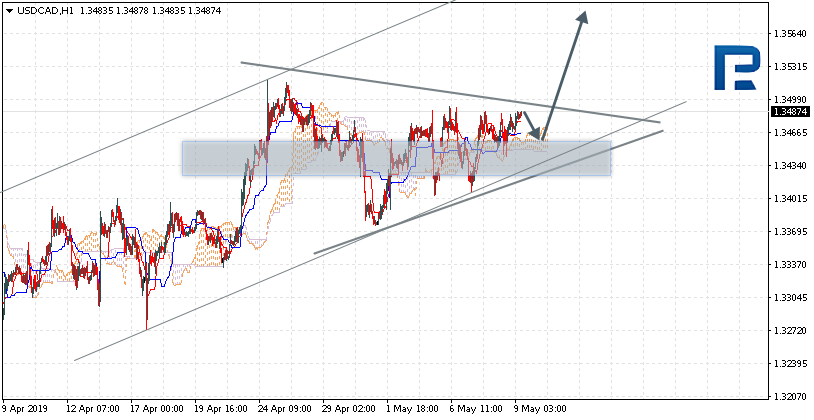
USDCAD, “US Dollar vs Canadian Dollar”
USDCAD is trading at 1.3487; the instrument is moving above Ichimoku Cloud, thus indicating an ascending tendency. The markets could indicate that the price may test the upside border of the cloud at 1.3465 and then resume moving upwards to reach 1.3575. Another signal to confirm further ascending movement is the price’s rebounding from the channel’s downside border. However, the scenario that implies further growth may be cancelled if the price breaks the downside border of the cloud and fixes below 1.3415. In this case, the pair may continue falling towards 1.3335. After breaking the upside border of the Triangle pattern and fixing above 1.3510, the price may continue moving upwards.
Attention! Forecasts presented in this section only reflect the author’s private opinion and should not be considered as guidance for trading. RoboForex LP bears no responsibility for trading results based on trading recommendations described in these analytical reviews.
The US dollar slightly strengthened against a basket of major currencies. The dollar index (#DX) closed near current levels (+0.07%). The trade war between the US and China led to a sharp drop in stocks on world stock markets. Markets were under pressure due to the fact that yesterday, US President Donald Trump imposed sanctions on Iran’s metals industry. The purpose of the deal is to deny Iran income from the export of products related to the production of iron, steel, aluminum, and copper.
Today, during the Asian trading session, mixed economic data have been published in China. Thus, the producer price index rose to 0.9% in April, while experts forecasted 0.6%. The consumer price index rose by 0.1% in April, which met investors’ expectations.
Today, the delegation from China should arrive in Washington to conclude a trade agreement with the United States. However, whether countries will be able to reach an agreement is not yet known, especially in the light of Donald Trump’s recent comments on that. Trump tweeted: “The reason for the China pullback & attempted renegotiation of the Trade Deal is the sincere HOPE that they will be able to “negotiate” with Joe Biden or one of the very weak Democrats, and thereby continue to ripoff the United States (($500 Billion a year)) for years to come… Guess what, that’s not going to happen! China has just informed us that they (Vice-Premier) are now coming to the U.S. to make a deal. We’ll see, but I am very happy with over $100 Billion a year in Tariffs filling U.S. coffers…great for U.S., not good for China!”
The “black gold” prices have been declining due to the escalation of the trade conflict between the US and China. At the moment, futures for the WTI crude oil are testing the mark of $61.50 per barrel.
Market Indicators
Yesterday, there was a variety of trends in the US stock market: #SPY (-0.14%), #DIA (+0.05%), #QQQ (-0.25%).
The 10-year US government bonds yield is declining. At the moment, the indicator is at the level of 2.44-2.45%.
The news feed on 2019.05.09:
– Producer price index in the US at 15:30 (GMT+3:00).
We also recommend paying attention to the speech by Fed Chairman Powell.
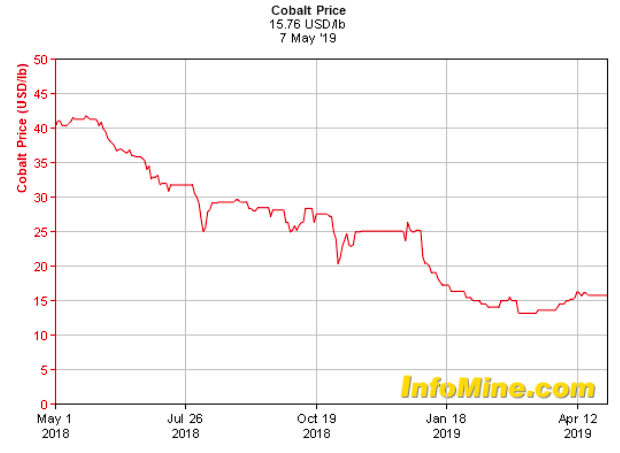
The Cobalt price continues to languish below US$20/lb. This is an unexpected development given that last year the price was at or above > $40/lb. for much of March, April & May. In speaking with experts and reading industry analysis, the consensus is that the Cobalt price will settle in the $20-$25/lb. range later this year and into 2020. I agree, that seems to be a sweet spot where end users are comfortable and the better quality Cobalt juniors can get financed.
That price range is not aggressive, but if that’s as high as prices are headed, it will knock out many Cobalt juniors that require $30+/lb. pricing. Of course, $20-$25/lb. might not seem that conservative when the price is at roughly $16/lb. (according to infomine.com). Of the 100+ names, surprisingly few can get financed in a sub $20/lb. scenario. After the upcoming industry shakeout (Cobalt mgmt. teams are likely looking at cannabis deals by now), the survivors will thrive, perhaps enjoying a price of $30+/lb. in the early 2020’s.
First Cobalt’s Refinery Could be in Production Within 24 Months
Few Cobalt juniors will survive this pricing cycle, most face a slow death through equity dilution, waiting for the Cobalt price to double or triple. However, First Cobalt Corp. (TSX-V: FCC) / (OTCQX: FTSSF) appears to be a survivor and could thrive next decade. Notice that news from peers has slowed to a crawl, First Cobalt is one of the few with news to report, such as today’s press release of May 8th. It’s about First Cobalt’s 100%-owned Refinery, a hydro-metallurgical Cobalt-Silver-Nickel facility, located ~5 km east of Cobalt, Ontario, and a few hours north by road or rail from the U.S. border.
In the image below — top left to right; cobalt sulfate produced using the FCC Refinery flow sheet; current autoclave circuit — bottom left to right; external & areal images of the facility.
Mgmt. Commissions Scoping Study to Find ways to Enhance Refinery Economics
Management has commissioned a study to estimate capital & operating requirements for a range of production scenariosusing Cobalt hydroxide as feedstock in its Ontario, Canada Refinery (the only fully-permitted Cobalt refinery in N. America capable of producing battery-grade Cobalt sulfate). Once operational, it would be the only N. American producer of refined Cobalt for the N. American EV market. Third-party discussions are underway to supply feedstock & investment capital to restart the Refinery within 18-24 months of securing feed. The Study will estimate production capacity, under various scenarios, using higher grade feed, and provide detailed capital & operating costs estimates.
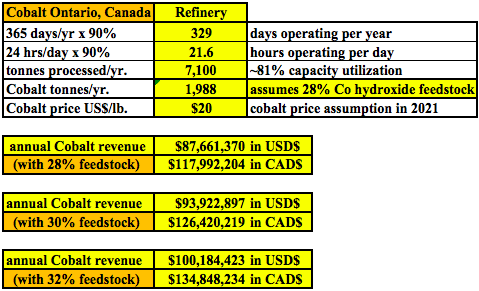
Below is a Refinery production model that estimates annual gross revenue from Cobalt alone (no by-product revenue). I stuck with a 24 tonne per day assumption, but management is looking at ways to as much as double it. But, that would require considerably more cap-ex. With 28%Cobalt hydroxide feed and the assumptions shown below, annualized gross revenue at $20/lb. of final Cobalt product could be ~C$118M. (US/CAD FX rate = 1.346). With 30% Cobalt hydroxide feed, annual production could rise to 2,130 tonnes, for gross revenue of ~C$126M. With 32% Cobalt hydroxide feed, annual production jumps to 2,272 tonnes and gross revenue could be ~C$135M. Finally, not in the image below, but with 30% Cobalt hydroxide feed, and a US$25/lb. Cobalt price (instead of US$20/lb.), annualized gross revenue could be C$158M.
Trent Mell, President & CEO, commented:
“First Cobalt is focused on becoming the first N. American refiner of battery-grade cobalt sulfate and is in discussions with potential sources of cobalt hydroxide feed material. The study is expected to identify upside within the Refinery by treating higher grade hydroxide feed and removing the autoclave circuit, which is the current bottleneck to increasing throughput capacity.”
Readers may recall that on April 3rd First Cobalt announced the production of battery-grade Cobalt sulfate using the current flow sheet by SGS Canada. The Company concluded that Cobalt hydroxide was the preferred feed material, and that throughput & costs could be enhanced by excluding the autoclave circuit. Management has engaged Ausenco Engineering Canada to complete a scoping study. Results are expected before the end of May.
From the press release,
“The conceptual study will update baseline production capacity & capital estimates, without the autoclave circuit, as well as explore additional production capacity for the Refinery under additional process flow sheets, estimating the capital & operating costs for each scenario. The report will support First Cobalt in further developing the business case for the restart, and serve as a foundation for future work to generate a financeable project.”
Revenue From 2,000 tonnes of Cobalt Product/yr. Could be Substantial
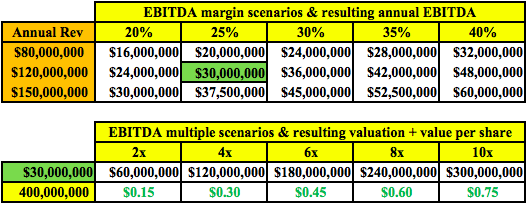
In the next 2 charts I take things to a logical conclusion… if we have an estimate of annual gross revenue, we can estimate EBITDA margins and an EBITDA multiple from metal producing peers to come up with a Company valuation. However, I don’t choose a specific margin or a multiple, I leave that up to readers. Why? I don’t have enough information to make a stock price prediction. And, small changes in assumptions can make a big difference. For example, the difference in realized price of US$20/lb. vs. US$25/lb. or in the feedstock grade of 28% vs. 32%. Instead, I show a range of possibilities that I think are reasonable. I assume moderate equity dilution, rounding up outstanding shares to 400 M, which is conservative as management says they can get the Refinery up and running with minimal or no more additional equity issuance.
In the first chart are assumed EBITDA margins from 20% to 40% and annualized revenue from C$80,000,000 to C$150,000,000. I took a 5% discount to gross revenue to account for fees/deductions at the Refinery. The results are annual EBITDA estimates in CAD$. Then I took the C$30M EBITDA estimate in the second chart and applied EBITDA multiples ranging from 2 to 10 times. For example, at a 4x multiple of C$30M EBITDA, First Cobalt could be worth C$120M (assuming no debt). Divide that by 400M shares = C$0.30/share. These are just rough numbers. Note, annualized revenue & EBITDA run-rates like those shown below are likely at least 2 years away, so it might make sense to discount share price estimates back 1 or 2 years at a 10%-15% discount factor.
First Cobalt Acquires Shares in eCobalt Solutions
Switching gears to other recent news…. the Company acquired 9,640,500 shares (~6% of issued & outstanding) of a Cobalt pure-play, eCobalt Solutions, (“ECS”) that also has a project in Idaho. In addition, First Cobalt is issuing 21,265,809 common shares at C$0.17 to fund the investment in ECS. eCobalt Solutions’ primary asset is described as being “an advanced-stage development Project with near-term primary Cobalt production potential.” Both ECS & First Cobalt had market caps of ~C$50M at the close on Monday, May 7th.
There has been some speculation as to what First Cobalt might be up to. I noticed that combined, ECS & Jervois Corp. would have about C$16 M in cash. First Cobalt might be trying to draw attention to the fact that in Idaho, it & ECS are the only games in town and that it makes sense for their projects to be combined. Also, some or a lot of ECS’ & Jervois’ cash could be invested in First Cobalt’s Refinery to generate nearer-term cash flow for First Cobalt and a merged ECS & Jervois.
Some shareholders are wondering about the arbitrage opportunity, is First Cobalt merely trying to make an attractive short-term return on its investment if the deal between Jervois & ECS closes? Based on the latest closing price of Jervois @A$0.26, I believe that First Cobalt has an unrealized gain of roughly C$300,000 on its 9,640,500 shares of ECS (if the merger had closed on May 7th). Locking in that gain would be like issuing those 21,265,809 shares of (TSX-V: FCC) at ~C$0.18, in a bad market, with no warrants attached. That alone would be a pretty good outcome. But, is there more to the story here? I don’t know, I think it was a dynamic, thinking out-of-the-box move that opens up options for the Company.
Conclusion
The natural resource space is dead, will it ever come back? Yes, there’s blood in the streets, but despite one’s bearishness, the global economy is still growing, and 1 or 2 billion of the planet’s 7.5 billion want to access not just reliable & safe electricity, but also the Internet and smart phone. Once there, they are one step away from electric scooters, bikes EVs. The Li-ion battery is, without question, here to stay for at least the next 2 decades. Cobalt is not getting engineered out of batteries, even if its use declines, slowly, over many years.
First Cobalt’s Refinery could be in production (when no one else in N. America is) in 1H 2021. As one looks at the hypothetical valuation metrics above, consider this. the Company could probably sell a minority stake in the Refinery, and get free-carried through cash flow break even. Dozens of companies could write a check for C$30-C$40M, imagine what that might do for the share price….. There are several near-term catalysts here — the scoping study report, talks on off-take, talks on strategic investment, talks on securing feedstock, perhaps discussions with Royalty / Streaming companies, and the possibility of a higher Cobalt price in coming months. If readers want to bet on a pure-play Cobalt junior, there are very few to choose from. First Cobalt Corp. TSX-V: FCC) / (OTCQX: FTSSF) is my one and only bet in the Cobalt space.
Disclosures: The content of this article is for information only. Readers fully understand and agree that nothing contained herein, written by Peter Epstein of Epstein Research[ER], (together, [ER]) about First Cobalt Corp., including but not limited to, commentary, opinions, views, assumptions, reported facts, calculations, etc. is not to be considered implicit or explicit investment advice. Nothing contained herein is a recommendation or solicitation to buy or sell any security. [ER] is not responsible under any circumstances for investment actions taken by the reader. [ER] has never been, and is not currently, a registered or licensed financial advisor or broker/dealer, investment advisor, stockbroker, trader, money manager, compliance or legal officer, and does not perform market making activities. [ER] is not directly employed by any company, group, organization, party or person. The shares of First Cobalt Corp. are highly speculative, not suitable for all investors. Readers understand and agree that investments in small cap stocks can result in a 100% loss of invested funds. It is assumed and agreed upon by readers that they will consult with their own licensed or registered financial advisors before making any investment decisions.
At the time this article was posted, Peter Epstein owned shares of First Cobalt Corp. and the Company was an advertiser on [ER].Readers understand and agree that they must conduct their own due diligence above and beyond reading this article. While the author believes he’s diligent in screening out companies that, for any reasons whatsoever, are unattractive investment opportunities, he cannot guarantee that his efforts will (or have been) successful. [ER] is not responsible for any perceived, or actual, errors including, but not limited to, commentary, opinions, views, assumptions, reported facts & financial calculations, or for the completeness of this article or future content. [ER] is not expected or required to subsequently follow or cover events & news, or write about any particular company or topic. [ER] is not an expert in any company, industry sector or investment topic.
Last year just days before the big Bitcoin breakdown we notified everyone publicly to get ready for a swift drop from $6000 to $4000 which played out perfectly within a few days. Our cycle system and technical analysis skills combined can pack a powerful punch and this one of those incredible moves where the stars aligned for us as traders.
We then further updated our followers in March of this year that a breakout was about to take place and a run to $6000 should take place. After that upside breakout move on April 8th, we posted this video further confirming $5800-$6000 was still the target.
Today/May Bitcoin appears to be setting up a broader top formation that suggests another move lower is about to unfold.
This first Daily chart highlights both support and resistance in Bitcoin. The Resistance goes all the way back to July 2018 where a Three River Morning Star pattern set up a gap with a Doji Star formation. This created the support level that was ultimately broken in November 2018. Support formed near $4000 in early 2019 with similar types of gap formations. This support level was ultimately broken in April 2019 with a move back up to resistance near $6000.
We believe the setup of the most recent price activity is setting up a classic three mountains top formation. A weak price rotation prompting a downside price move right now could be a short term ultimately top with next support near $5000. We believe a fairly quick downside price move toward the $4400 level (or lower) – near support.
Once price move to near the $4400 price level, or lower, if the support level is broken, we could see the price of Bitcoin fall all the way towards the $3500 level or lower. Fibonacci price theory suggests the failed high price move, near $7500, would represent a major failed high. This failure suggests a move lower attempting to establish a new price low. For this to happen, the price of Bitcoin would have to fall below $3000 which may sound crazy, but so was $20,000 bitcoin!
Watch for a reversal to unfold in the coming days, could be another opportunity to profit from another cryptocurrency collapse. Any failure of this breakdown/reversal move would suggest Bitcoin is setting up a new Pennant/Flag formation where the price will trade sideways before prompting a bigger breakout move. We believe a price breakdown is about to unfold and we expect prices to fall below $4400 within 14 to 28 days.
If you want to become a technical trader and pull money from the markets during times when most others cannot be sure to join the Wealth Trading Newsletter today. Plus, for a few days only I’m giving away and shipping Free Silver Rounds to subscribers who join our select membership levels.
08 May 2019, Limassol, Cyprus. RoboMarkets launches trading stocks of the famous American company, Uber Technologies Inc., which filed for an initial public offering (IPO) and is expected to float on May 9th 2019 on the New York Stock Exchange (NYSE). From the very first trading session, RoboMarkets will offer its clients an opportunity to buy and sell both real stocks and CFDs on Uber stocks in R Trader multi-asset platform.
Kiryl Kirychenka, RoboMarkets Product Manager: “Uber’s IPO is anticipated to be one of the largest in the market history. At RoboMarkets, we are actively developing our products and offers, improving trading conditions for the Company’s clients, that’s why we will be very pleased to provide them with access to Uber stocks starting from the very first day they appear on the market.”
Uber is the largest car-hailing service in the world with more than 14 million rides a day. During the upcoming IPO, the company is planning to be estimated at 84 billion USD and attract about 10 billion USD, thus making this IPO the third biggest among technological companies ever (after Facebook and Alibaba).
About RoboMarkets
RoboMarkets is an investment company with the CySEC license No. 191/13. RoboMarkets offers brokerage services in many European countries by providing traders, who work on financial market, with access to its proprietary trading platforms. The Company’s clients have access to trading 8 types of assets and more than 11,700 trading instruments.
About R Trader
R Trader is brought to you by RoboMarkets and UMSTEL, a fintech company working on a cloud-based multi-market trading platform. R Trader enables access to over 11,000 instruments across 8 asset classes. This platform is user friendly and guarantees maximum transaction transparency, while also being in line with the leading desktop trading terminals.
Rockridge Resources(TSX-V: ROCK) is a fairly new mineral exploration company focused on the acquisition, exploration & development of mineral resource properties in Canada. Its focus is copper & base metals. More specifically, base, green energy & battery metals, of which copper is all three! Not just any place in Canada, world-class mining jurisdictions such as Saskatchewan. And, not just good jurisdictions, but in mining camps with significant past exploration, development or production, in close proximity to key mining infrastructure.
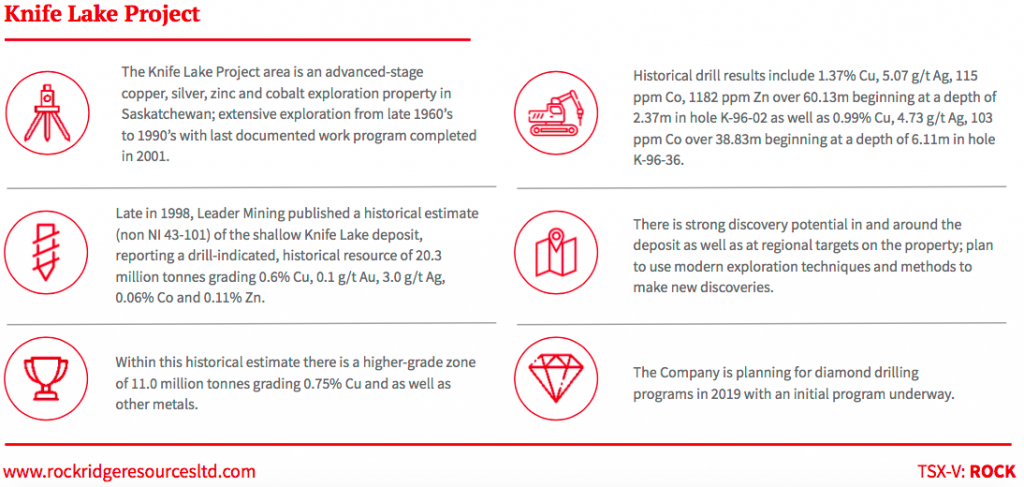
The Company’s flagship project Knife Lake is in Saskatchewan, Canada, (ranked 3rd best mining jurisdiction in the world) in the Fraser Institute Mining Company Survey. The Project hosts the Knife Lake deposit, a near-surface, (high-grade copper) VMS copper-cobalt-gold-silver-zinc deposit open along strike and at depth. Management believes there’s strong discovery potential in and around the deposit area, and at additional targets on ~85,000 hectares of contiguous claims.
On May 7th Rockridge reported additional results from its Winter diamond drill program at its flagship Knife Lake project in Saskatchewan. Hot on the heels of last week’s press release (April 30th) of 2 holes, comes 3 more. I was planning on writing an article on those excellent results, but Equity.Guru beat me to the punch, putting out this well done piece. Readers following along may recall that the key takeaway was that holes KF19001 & KF19002 largely confirmed historical grades, intercept widths & geological conditions. Fast forward to May 7th, and management’s interpretation of drill holes KF19003, KF19004 & KF19005 was announced. Results on the remaining 7 holes will be released over the next 20-30 days. As a reminder, Rockridge has an option agreement with Eagle Plains Resources to acquire a 100% Interest in the majority of the Knife Lake Cu-Zn-Ag-Au-Co VMS deposit.
Earlier this year, Rockridge drilled 12 holes for a total of 1,053 meters. Importantly, this represents the first work on the property since 2001. Readers may recall from reading past articles & interviews on Epstein Research andEquity.Guru and viewing videos of CEO Trimble, that the Company’s primary goal is to explore districts that have been under-explored, never explored, or not recently explored. Management’s highly skilled and experienced technical team & advisors deploy the latest exploration technologies & methods. A lot has changed in 18 years; a simple example would be the use of drones to fly various surveys. Whatever management is doing seems to be working, as evidenced by 2 of the first 5 holes returning very strong results, and the third hole, KF19003 a true blockbuster.
Hole KF19003 was even better than the first 2 holes. In fact, significantly better, with a grade (Cu Eq.) x thickness (in meters) value of 91, compared to 41 & 49. Make no mistake, KF19001 / 19002 were great, they averaged1.21 Cu Eq. over an average 38.5m. But, KF19003, WASsomething to write home about…. [if under the age of 30, Google the idiom, “nothing to write home about“]. Near-surface like the first 2 holes, the 37.6m interval assayed 2% Cu, 0.2 g/t Au, 9.9 g/t Ag, 0.36% Zn & 0.01% Co, for an estimated 2.42% Cu Eq. grade. 2% Cu over 37.6 meters is a tremendous showing at under 41 meters downhole.
Holes KF19004 & KF19005 were mineralized, but had narrower intercept widths of interest. Still, there were attractive Cu Eq. grades (1.25% & 1.20%, respectively). Interestingly, Gallium (up to 25.6 ppm) & Indium (up to 15.2 ppm) values were found in the mineralized zones of all 3 holes. Those 2 Rare Earth Metals trade at an average of about US$300/kg. Each 10 ppm = 1kg/tonne. KF19004 & KF19005 confirmed mineralization up-dip of historically drilled high grade mineralization. So, those 2 holes were like KF19001 & KF19002, important in building the potential resource size. All activities this year advance the Project toward a NI 43-101 compliant mineral resource estimate.
Perhaps best of all, drill hole KF19003 confirmed high-grade mineralization up-dip of KF19002 in an area where no historical drilling is known to have been done. Therefore, this assay, and perhaps nearby assays to follow, will increase the size & grade of the upcoming mineral resource estimate. There was also encouraging zinc values, incl. 4m (from the 37.6m) of 1.32% Zn, nearly C$50/tonne rock. Gold values up to 0.63 g/t are interesting, but like the zinc I’m referring to only the best grades, from smaller intercepts. That 4m interval I mentioned also had 7.54% Cu. This is clearly a COPPER deposit, Knife Lake is a near-surface, high-grade Cu project. See drill hole results from KF19001 – KF19005 below. Holes KF19001 & KF19002 were released on April 30th, and KF19003-KF19005 on May 7th
Rockridge’s President & CEO, Jordan Trimble commented: “The results from drill hole KF19003, specifically 2.42% Cu Eq. over 37.6m, far exceeded our expectations and represents one of the best holes ever drilled on the project. It is important to note that this drill hole was collared in an area where no historical drilling has been reported. As such these drill results are expected to have a positive impact on the historical resource. Final results from the remaining 7 drill holes are pending and will provide steady news flow over the near term.”
Drill indicated intercepts (core length) are reported as drilled widths and true thickness is undetermined. {details about calculation of Cu Eq. grade can be found in the press release}.{details about calculation of Cu Eq. grade can be found in the press release}.
From the press release, “The Knife Lake area saw extensive exploration from the late 1960s to the 1990s with the last documented work program completed in 2001. Between 1996 and 1998, Leader Mining completed 315 diamond drill holes, outlining a broad zone of mineralization occurring at a depth of less than 100 m. Late in 1998, Leader published an historical estimate, reporting a, “drill-indicated” resource of 20.3 M tonnes, grading 0.6% Cu, 0.1 g/t Au, 3 g/t Ag, 0.06% Co & 0.11% Zn. Within the historical estimate there is a higher grade zone containing 11.0 M tonnes of 0.75% Cu, plus other metals.”
NOTE: These mineral resource estimates are not supported by a compliant NI 43-101 technical report. A qualified person has not done the work to classify these estimates as current mineral resources in accordance with NI 43-101 standards. Furthermore, the categories used for these historical resource estimates are described as, “drill-indicated”. This is not a NI 43-101 resource category, but based on the methodologies & drill hole spacing, management believes it would likely be classified as Inferred.
The Project is within the word famous Flin Flon-Snow Lake mining district that contains a prolific VMS base metals belt. Management paid < half a penny/lb. of copperand they believe there’s tremendous exploration upside. The goal? High-grade discoveries in a mineralized belt that could host multiple deposits, as VMS-style zones often contain clusters of mineralized zones. Of course, the trick is finding them. No modern exploration, drilling or technology has been deployed at Knife Lake. It was discovered 50 years ago and last explored in the 1990s. Airborne geophysics, regional mapping & geochemistry was done. Management believes that modern geophysics; high resolution, deep penetrating EM & drone mag surveys to cover large areas in detail, could make a big difference.
The deposit remains open at depth. Additional discoveries are very possible as the property is > 85,000 hectares in size. The Winer drill program marks the end of the beginning of this highly prospective Project. Importantly, the program gives the Company’s technical team valuable information about geology, alteration & mineralization that will be applied to regional exploration targets. According to the press release, most of the historical work was shallow drilling in and around the deposit area. Very little regional or district work has been documented. In fact, there wasn’t even much drilling done below the deposit. That’s why management is optimistic about the discovery potential both at depth and regionally. I’m excited to see what the next 7 assays add to the Rockridge Resources (TSX-V: ROCK) story!
Disclosures: The content of this article is for information only. Readers fully understand and agree that nothing contained herein, written by Peter Epstein of Epstein Research [ER], (together, [ER] about Rockridge Resources, including but not limited to, commentary, opinions, views, assumptions, reported facts, calculations, etc. is to be considered implicit or explicit investment advice. Nothing contained herein is a recommendation or solicitation to buy or sell any security. [ER] is not responsible under any circumstances for investment actions taken by the reader. [ER] has never been, and is not currently, a registered or licensed financial advisor or broker/dealer, investment advisor, stockbroker, trader, money manager, compliance or legal officer, and does not perform market making activities. [ER] is not directly employed by any company, group, organization, party or person. The shares of Rockridge Resources are highly speculative, not suitable for all investors. Readers understand and agree that investments in small cap stocks can result in a 100% loss of invested funds. It is assumed and agreed upon by readers that they will consult with their own licensed or registered financial advisors before making any investment decisions.
At the time this article was posted, Peter Epstein owned stock in Rockridge Resources and the Company was an advertiser on [ER].Readers understand and agree that they must conduct their own due diligence above and beyond reading this article. While the author believes he’s diligent in screening out companies that, for any reasons whatsoever, are unattractive investment opportunities, he cannot guarantee that his efforts will (or have been) successful. [ER] is not responsible for any perceived, or actual, errors including, but not limited to, commentary, opinions, views, assumptions, reported facts & financial calculations, or for the completeness of this article or future content. [ER] is not expected or required to subsequently follow or cover events & news, or write about any particular company or topic. [ER] is not an expert in any company, industry sector or investment topic.