EURUSD has formed another consolidation range around 1.1195; right now, it is expected to move towards its upside border. Possibly, the pair may reach 1.1208, start a new decline towards 1.1187, and then form one more ascending structure with the target at 1.1230. If later the price breaks the range to the upside, the instrument may continue the correction to reach 1.1250; if to the downside – resume trading inside the downtrend towards 1.1050.
GBPUSD, “Great Britain Pound vs US Dollar”
GBPUSD has broken 1.3084 and reached the short-term downside target; right now, it is moving to return to the above-mentioned level. After that, the instrument may form a new descending structure with the first target at 1.2992.
USDCHF, “US Dollar vs Swiss Franc”
USDCHF is consolidating around 1.0188. Today, the pair may fall to reach 1.0163 and then form one more ascending structure with the target at 1.0255.
USDJPY, “US Dollar vs Japanese Yen”
USDJPY is moving downwards inside the fifth wave with the first target at 109.55. Later, the market may start a new correction towards 111.44.
AUDUSD, “Australian Dollar vs US Dollar”
AUDUSD is consolidating around 0.7010. Possibly, today the pair may reach 0.7061 and fall to return to 0.7010. If later the price breaks the range to the upside, the instrument may start a new correction with the target at 0.7128; if to the downside – resume trading inside the downtrend to reach 0.6925.
USDRUB, “US Dollar vs Russian Ruble”
USDRUB is still falling to reach 64.85. Later, the market may form one more ascending structure with the target at 66.02 and then start another decline towards 64.44.
XAUUSD, “Gold vs US Dollar”
Gold is consolidating around 1282.10. Possibly, the pair may form one more ascending structure to reach 1287.50 and then start a new decline to return to 1282.10. If later the price breaks the range to the upside, the instrument may continue the correction with the target at 1292.00; if to the downside – resume trading inside the downtrend towards 1260.00.
BRENT
Brent is consolidating around 70.81. If later the price breaks the range to the downside, the instrument may continue the correction with the target at 68.70; if to the upside – form the fifth ascending wave towards 76.50.
Attention! Forecasts presented in this section only reflect the author’s private opinion and should not be considered as guidance for trading. RoboForex LP bears no responsibility for trading results based on trading recommendations described in these analytical reviews.
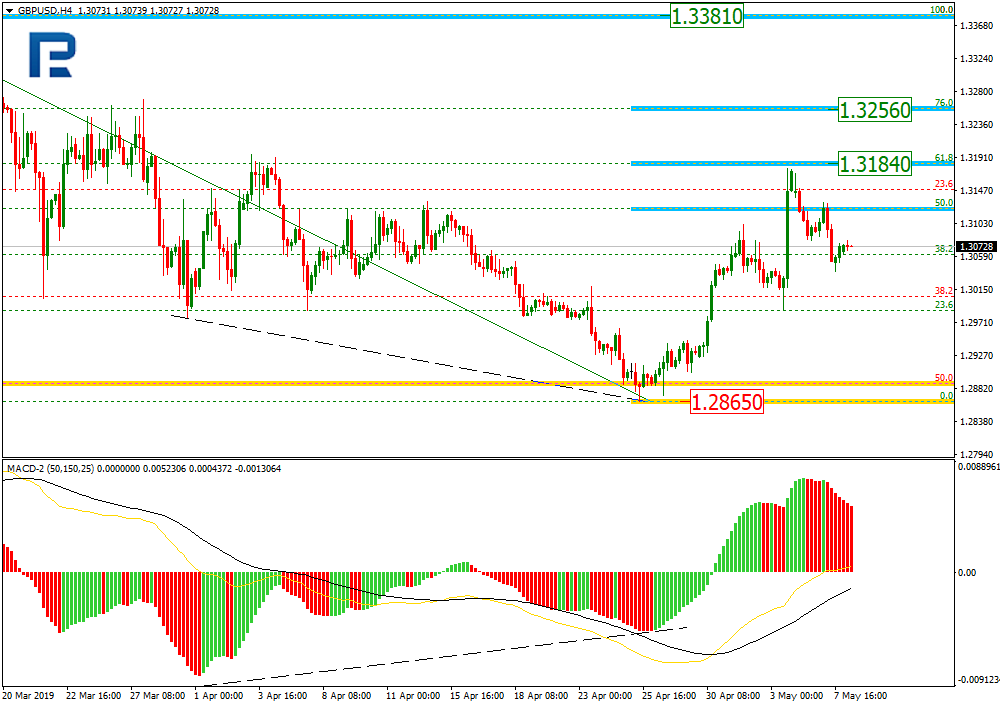
As we can see in the H4 chart, the convergence made GBPUSD start a new correctional uptrend, which has already reached the retracement of 61.8% at 1.3184. In the nearest future, the price may start a short-term pullback. After that, the pair may continue growing towards the retracement of 76.0% at 1.3256 and the high at 1.3381. The support level is the low at 1.2865..
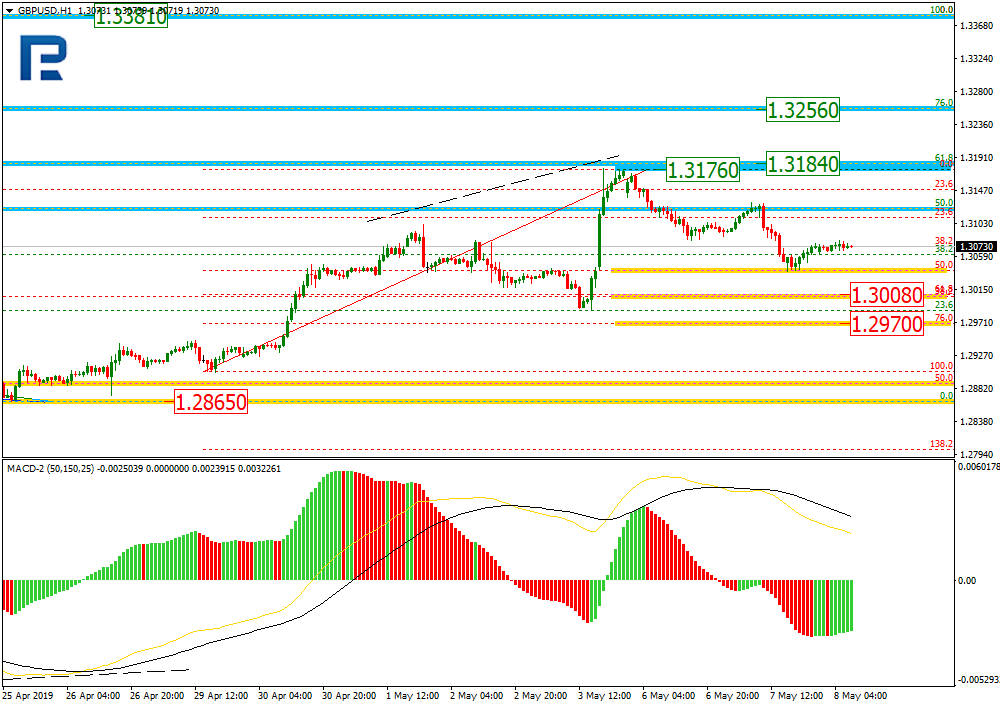
In the H1 chart, the divergence made the price start a new correction downwards, which has already reached the retracement of 50.0%. The next downside targets may be the retracements of 61.8% and 76.0% at 1.3008 and 1.2970 respectively. However, if the pair breaks the high at 1.3176, the uptrend will continue.
EURJPY, “Euro vs. Japanese Yen”
As we can see in the H4 chart, EURJPY is trading downwards and getting closer to the retracement of 50.0% at 122.73. The next target may be the retracement of 61.8% at 121.61. At the same time, there is a convergence on MACD, which may indicate a possible pullback.
In the H1 chart, there is a convergence on MACD, which may indicate a new pullback after the pair reaches the retracement of 50.0% at 122.73. The targets of this pullback may be the retracements of 38.2%, 50.0%, and 61.8% at 123.69, 123.99, and 124.28 respectively.
Attention! Forecasts presented in this section only reflect the author’s private opinion and should not be considered as guidance for trading. RoboForex LP bears no responsibility for trading results based on trading recommendations described in these analytical reviews.
Renewable energy deployment stalled out last year, raising alarm bells about the pace of the clean energy transition.
In 2018, total deployment of renewable energy stood at about 180 gigawatts (GW), which was the same as the previous year. It was the first time since 2001 that capacity failed to increase year-on-year, according to the International Energy Agency (IEA).
Adding 180 GW of clean energy is a massive total, but still falls short of what is needed to clean up the electricity sector. It equates to roughly 60 percent of what is needed each year in order to meet long-term climate goals, the IEA said. The agency said that the world needs to add about 300 GW of renewable energy each year through 2030 in order to meet the targets laid out in the Paris Climate Agreement.
Worse, last year, CO2 emissions from energy rose 1.7 percent, setting another record high at 33 Gigatonnes. So, while emissions need to decline sharply, they haven’t even flattened out yet. Renewable energy continues to grow, but so does demand for oil and gas.
“The world cannot afford to press “pause” on the expansion of renewables and governments need to act quickly to correct this situation and enable a faster flow of new projects,” Fatih Birol, the IEA’s Executive Director, said in a statement.
“Thanks to rapidly declining costs, the competitiveness of renewables is no longer heavily tied to financial incentives. What they mainly need are stable policies supported by a long-term vision but also a focus on integrating renewables into power systems in a cost-effective and optimal way. Stop-and-go policies are particularly harmful to markets and jobs,” Birol added.
For the last four years, growth of wind had slowed, but the gap was made up by faster growth from solar. The difference in 2018 was that solar’s exponential growth flattened out. The reason for that lies in China, where the government pared back incentives on solar in order to cut expenditures and cope with grid integration challenges, the IEA said. Still, China added 44 GW of solar last year, the most by far out of any other country and nearly half of the 97 GW global total. But that was down from 53 GW that China installed in 2017.
Costs continue to fall, making renewable energy the cheapest option in many markets, which should ensure strong growth going forward. In the U.S., wind and solar are now cheaper than operating existing coal plants in much of the country. In fact, in April, renewable energy surpassed coal in terms of electricity generation for the first time, accounting for 24 percent of the total, compared to coal’s 20 percent market share.
But, despite the momentum, the transition is not fast enough. A new UN report finds that the world is facing a mass die-off of biodiversity, with as many as one million plant and animal species at risk of extinction. Also, the world is on track to blow through its carbon budget within 12 years.
Because of this urgency, a wave of new policies supporting a faster roll out of electric vehicles and renewable energy is inevitable. At the state level, renewable energy mandates are proliferating. In the Democratic primary for president, candidates are trying to outdo each other in terms of ambition on clean energy and climate change. For instance, what was once considered an extreme position, such as banning oil and gas drilling on public lands, has now become a mainstream position in the Democratic Party, at least for the candidates running for president.
Another example of the shifting Overton window came in late April when former Texas Congressman and presidential contender Beto O’Rourke recently called for $5 trillion in spending over the next 10 years in an effort to cut emissions to zero by 2050. It’s ambitious by any measure, but faced some pushback for not going far enough, which says a lot about the growing concern about climate change. In fact, climate change ranked as the top issue for Democratic voters, according to a recent poll.
The oil and gas industry has enjoyed a golden era under the Trump administration, but it may only be temporary.
EUR/USD retains an ambiguous technical picture. The financial market participants are waiting for additional drivers. The EU commission has decreased the expectations for the EU growth for 2019-2020. The trading conflict between the US and China remains in the spotlight. Chinese Vice-Premier Liu He will go to the United States on Thursday to continue trade negotiations. Right now the local support and resistance levels are 1.11900-1.12200. Open positions from these levels.
At 14:30 (GMT+3:00) the investors will evaluate the latest ECB meeting on monetary policy.
The indicators do not provide precise singals, 50 MA started to cross 200 MA.
The MACD histogram is in the positive zone but started to fall, which gives a weak signal to buy EUR/USD.
The Stochastic Oscillator started to leave the overbought zone, the %K line is below the %D line which points to a bearish mood.
Trading recommendations
Support levels: 1.11900, 1.11650, 1.11400
Resistance levels: 1.12200, 1.12500
If the price fixes above 1.12200, expect further growth toward 1.12500-1.12700.
Alternatively, the quotes can descend toward 1.11650-1.11500.
The GBP/USD currency pair
Technical indicators of the currency pair:
Prev Open: 1.30954
Open: 1.30645
% chg. over the last day: -0.23
Day’s range: 1.30386 – 1.30803
52 wk range: 1.2438 – 1.3631
The GBP/USD currency pair started to descend. The trading instrument has updated the local minimums. The GBP is under pressure due to the Brexit ambiguousness. The British press obtained information that the Parliament will pursue Theresa May’s resignation this week, should she accept a deal with the oppositions. Right now GBP/USD quotes are consolidating around 1.30400-1.30800. GBP can descend further, you should open positions from the key levels.
The Economic News Feed for 08.05.2019 is calm.
The indicators do not provide precise signals: the price fixed between 50 MA and 200 MA.
The MACD histogram is in the negative zone and keeps falling which gives a strong signal to sell GBP/USD.
The Stochastic Oscillator is in the neutral zone, the %K line is below the %D line which points toward a bearish mood.
Trading recommendations
Support levels: 1.30400, 1.29900, 1.29400
Resistance levels: 1.30800, 1.31300, 1.31750
If the price fixes below 1.30400, expect further descend toward 1.30000.
Alternatively, the qutoes can recover toward 1.31200-1.31500.
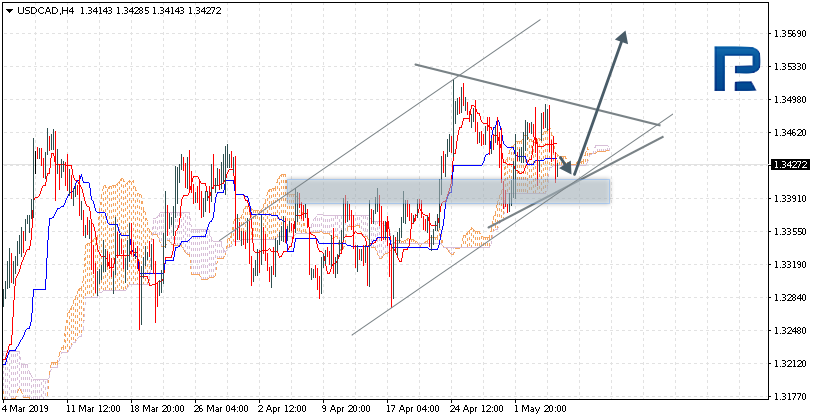
Since the beginning of the year, USD/CAD has been in a very active trading. There are no defined trends. The local support and resistance levels are 1.34500-1.34750. The USD/CAD quotes started to descend. Keep an eye on the oil quotes dynamics and open positions from the key levels.
The Economic News Feed for 08.05.2019 is calm.
The indicators do not provide precise signals, the price has crossed 50 MA and 200 MA.
The MACD histogram is close to 0.
The Stochastic Oscillator is near the oversold zone, the %K line has crossed the %D line. There are no signals at the moment.
Trading recommendations
Support levels: 1.34500, 1.34150, 1.33800
Resistance levels: 1.34750, 1.34900, 1.35200
If the price fixes below 1.34500, consider selling USD/CAD. The movement will tend toward 1.34200-1.34000
Alternatively, the qutoes can grow toward 1.35000.
The USD/JPY currency pair
Technical indicators of the currency pair:
Prev Open: 110.713
Open: 110.228
% chg. over the last day: -0.46
Day’s range: 109.905 – 110.293
52 wk range: 104.97 – 114.56
USD/JPY is in the bearish mood. The trading instrument has updated the local minimums. The demand for safe assets remains high due the US/China trading conflict. Right now the quotes are consolidating between 109.900 and 110.300. The trading instrument can grow further. You should open positions from the key levels.
The Economic News Feed for 08.05.2019 is calm.
The price fixed below 50 MA and 200 MA which points toward the power of the buyers.
The MACD histogram is in the negative zone but above the signal line which gives a weak signal to sell USD/JPY.
The Stochastic Oscillator is in the neutral zone, the %K line is above the %D line which points toward a bullish mood.
Trading recommendations
Support levels: 109.900, 109.500
Resistance levels: 110.300, 110.850, 111.250
If the price fixes below the 109.900, expect the quotes to fall toward 109.500-109.300.
Alternatively, the quotes can recover toward 110.700-111.000.
The US dollar did not changed a lot against the basket of major currencies during yesterday’s trading. The dollar index (#DX) closed with a slight increase (+0.02%). Due to the escalation of the trade conflict between the US and China, the demand for safe assets has increased. Therefore, the Japanese yen has reached six-week highs against the US currency. On Thursday-Friday, talks will be held in Washington, during which Vice Premier Liu He will try to save the agreement.
The euro was under pressure after the European Commission lowered the growth rates of the Eurozone economy for the current and next years. The EC has worsened its estimate for the Eurozone’s GDP growth for 2019 to 1.2% from the expected 1.3% in February. The growth forecast for the region’s economy in 2020 has been lowered to 1.5% from 1.6%.
The UK will take part in the elections to the European Parliament, as it hasn’t exit the EU. Elections will be held on May 23. At the same time, the Conservative Party is dissatisfied with the negotiations with the Labour Party. Negotiations between the two parties have been going on for several weeks, so far neither side has taken and has not supported any decisions on Brexit. Members of the Conservative Party, who stand for Brexit, are ready to consider the urgent resignation of T. May.
Today, during the Asian trading session, the RBNZ has decided on the interest rate. As expected, the regulator lowered the key interest rate by 25 basis points to 1.50%. The Central Bank does not exclude a further reduction in interest rates in the future.
The “black gold” prices have recovered most of the losses after a decline the previous day. At the moment, futures for the WTI crude oil are testing the mark of $61.80 per barrel. At 17:30 (GMT+3:00), a report on crude oil inventories will be published in the US.
Market Indicators
Yesterday, the aggressive sales were observed in the US stock market: #SPY (-1.67%), #DIA (-1.80%), #QQQ (-1.95%).
The 10-year US government bonds yield is declining. At the moment, the indicator is at the level of 2.46-2.47%.
The news feed on 2019.05.08:
– Publication of the ECB account monetary policy meeting at 14:30 (GMT+3:00).
Unless you were following our research, see below, and were already aware of the many warning signs we’ve been posting in our continued efforts to help traders and to help educate skilled investors, you were probably caught completely off guard by the news of near trade tariffs last Sunday, May 5th. Let’s face it, the short position in the VIX was an indication that institutional and retail investors had gone “all in” on this rally and had failed to even consider anything disrupting the narrow range price rally that had been in place over the past 45+ days. Well, all of that changed on Sunday night and many traders woke up Monday morning to the INDU down nearly -500 points.
The most incredible facet of this rotation was that the markets had already discounted the trade tariff news and began to rally almost immediately after the opening bell on Monday. Sure, we are not out of the woods at this time with the potential for continued price volatility and price rotation, but the fact that the US stock market was capable of rallying back from a very deep opening price shows just how resilient the US stock market and the economy really are. The issue this time, we feel, will be felt in the global market and in foreign currency rates. We’ll get into that more as we continue.
In case you missed our most recent research posts, we suggest you take a few minutes to review the following posts to bring you up to speed with our analysis/research. Reviewing these posts may help you to better understand the rest of this article and our expectations for the next 60 to 90 days.
Now that we’ve covered a bit of our past research, allow me to attempt to summarize things a bit.
_ First, we continue to expect new high prices to be established over the next 30+ days. Yes, volatility will be larger than it was 30 days ago, but we believe the “Shake-out” is just starting and we believe the US stock market will continue to push higher – at least for the next 3+ weeks.
_ Second, we are very cautious of the July/August 2019 Cycle Predictions, see above. We believe these cycles could be a warning of a major price trend change that prompts some type of “dynamic shift” in the global markets. Right now, it appears a “Shake-out” in China/Asia may be in play. But we believe a bigger “Shake-out” may be brewing somewhere else in the world.
_ Lastly, we believe any top formation in the US Stock market will result in a Pennant/Flag formation, rotational top formation, that will give traders ample time to reposition their trades and reduce risks.
Just a few days ago, we posted this research to help traders understand just how close the markets are to topping and what to expect – see below. We continue to believe this “Shake-out” is more about disrupting low volatility expectations and less about a major market top in the US stock market
The Chinese stock markets will likely continue to drop as new expectations are suddenly realized and trade issues, especially IP and future IP partnerships, become a major contention moving forward. Every step China takes, right now, is very fragile in terms of US expectations and the ability to show the world China is willing to become a responsible player in the technology field. If China fails to realize this, the world will clearly see that China’s intention is to take as much as they can from global technology leaders while stuffing their pockets full of foreign cash – it will not end well.
The Shockwave that has just started to unfold across the global stock market/financial world is that trade, economic expectations, and currency valuations will continue to “revalue” to address these ongoing concerns until some formal resolution works itself into place. In the meantime, any new issues that become present could further complicate these “revaluation” efforts. The concert just started, folks. We have a long way to go before this is all over with.
This Weekly YM chart showing our proprietary Fibonacci price modeling system is suggesting we have a “long way to go” before we could consider any downside price rotation a major risk. The recent price highs in this YM chart have prompted a Bearish Fibonacci Trigger Price near the December 2018 lows (see the RED line near the $21,450 level). You might be asking, “why so low?”. This “learning modeling system” attempts to learn from price and attempts to identify where key price levels are that MUST be reached for a confirmed trend change. As price has continued to rotate within a very wide range over the past 7+ months, the Fibonacci modeling system is suggesting that price could fall all the way back to near the December lows WITHOUT triggering a new “long term” bearish price trend.
In other words, the current price range that would constitute “normal price volatility” is anywhere between $21,450 and $26,950. When we said to expect increased volatility, we really meant it. This is a $5,500 range in the YM that could become a “normal volatility zone”.
The NQ Weekly chart, on the other hand, is providing us a much clearer Bearish Fibonacci Trigger level, near $7,393. Once the price is able to close below this level, then we would consider the NQ entering a new Bearish trend as long as price stays below the $7,393 level. If it was to rally back above this level, then the trigger is negated as long as it stays above the trigger level.
Pay very close attention to the YELLOW price channels that originate back in early 2018. Those levels are likely to play a very important role in going forward as price attempts to establish new price ranges/channels throughout this expected price rotation and volatility.
Lastly, we’ve been warning that the Financial Sector could come under some intense pressures over the next 5 to 16+ months as all of this “Shockwave” plays out. The reason we believe the Financial sector is vulnerable to this crazy volatility is that the exposure to multiple levels of capital risk could complicate the long-term earnings capabilities of this sector. Almost all of these firms are involved in Personal, Corporate/Business, Real Estate, Trade, Global financing, Currency, and Bond related business ventures. These firms are not remotely immune to any “Shockwave” – they are located right in the Bullseye/Target zone.
We believe the XLF may come under increased pressure over the next 3~6+ weeks as the Shockwave event continues to unfold. We believe issues with Personal/Consumer credit will be the first sign of a Shockwave event and further pressures from Corporate/Business/Global/Currencies would likely be the second shoe to drop over the next 8+ months. We believe a rotation in the XLF to near $25 is very likely over the next 3~6 months and that this move could be the result of extended risk factors originating from the “Shockwave event” we’ve been suggesting is currently unfolding.
Skilled traders should be watching technology stocks, the NASDAQ, the INDU, the Financial Sector and commodity prices over the next 4+ months for any signs that the Shockwave event is increasing in amplitude. Additionally, pay very close attention to how currencies are moving and where the US Dollar is moving in relation to other currencies. Gold and Silver should also be on your radar over the next few months as well. Lastly, prepare for the major cycle event in July/August 2019.
The past four tradings sessions with volatility has kept us busy check out our most recent index trades on the SP500
Our advice continues to be to look for opportunities as the volatility increases and continue to expect an upside price bias in the US stock market – at least until we have any strong evidence that price trend has changed. Don’t buy into the doom-sayers just yet. In our opinion, this US upside price move is not over yet.
If you want to become a technical trader and pull money from the markets during times when most others cannot be sure to join the Wealth Trading Newsletter today. Plus, for a few days only I’m giving away and shipping Free Silver Rounds to subscribers who join our select membership levels.
On Tuesday the 7th of May, trading on the EURUSD pair closed down. The bulls couldn’t withstand the safe haven retreat for long. In the US session, the pair dropped to 1.1167.
The euro tumbled in response to the European Commission downgrading its economic outlook for the Eurozone, as well as to the escalation of the US-China trade dispute.
The European Commission downgraded its GDP forecast for this year from 1.3% to 1.2%. The forecast for 2020 was revised downwards from 1.6% to 1.5%. This took the euro down to 1.1185 against the dollar.
US Trade Representative Robert Lighthizer and Secretary of the Treasury Steven Mnuchin confirmed that tariffs on Chinese good will go up on Friday.
The dollar also got support from comments by the Fed’s Vice Chairman Richard Clarida, who said that the Fed is in a good place and now is not the time to cut interest rates.
Day’s news (GMT+3):
11:15 UK: BoE’s Ramsden speech.
11:45 Eurozone: non-monetary policy ECB meeting.
14:30 Eurozone: ECB President Mario Draghi’s speech.
15:15 Canada: housing starts (Apr).
15:30 US: Fed’s Brainard speech.
17:30 US: EIA crude oil stocks change (3 May).
Current situation:
The pair has rebounded from the 45th degree. The majors are all trading up against the greenback except for the Kiwi dollar, which has dropped in response to the RBNZ slashing the cash rate to 1.5%.
The 45th degree is at the 1.1220 mark. This level is bolstered by the resistance drawn from the highs of 1.1219 (2nd of May) and 1.1218 (7th of May). It’s highly doubtful that the bulls will be able to break through this at the first attempt given the increased tensions in the US-China trade conflict.
Today’s economic calendar is relatively empty. The euro could fluctuate a bit during Draghi’s speech at 14:30 (EET). In order to move towards 1.1245, we’ll need another bounce from the LB. The stochastic should reenter the buy zone while the pair drops to 1.1197.
Donald Trump’s tweets increasing tension around the ongoing trade war and John Bolton’s words about a possible war with Iran are successfully killing the mood on the market, shifting trader attention towards the safe haven assets. In this piece, we will look at USDCHF, representing two safe heaven currencies together and we will try to evaluate which one has a better chance of mid-term success.
The fundamentals in terms of the global situation are pretty much the same for both assets. The countries’ economies are in two different positions, however. Switzerland is not thinking about increasing interest rates. USA is in this cycle and has already raised them a few times. This difference can be easily seen on the chart, as the pair is in a healthy bullish trend, with an opportunity for more. The latest buy signal was triggered here in the middle of April when the price broke the dynamic and the horizontal resistances. According to the rules of price action, a broken resistance should be tested as a support. This test happened on the first day of May and resulted in a beautiful hammer on the daily chart. Such a candle in such a place is always a good omen and can be treated as a buy signal. Today, the positive sentiment is strengthened by the fact that the pair is trying to draw a bullish engulfing pattern, which is going pretty well so far.
The positive sentiment will be cancelled if the pair comes back below the green line. The chances of that are rather low. A proper buy signal will be triggered with a breakout of the small blue downwards trend line, which is currently limiting the bearish correction. That option looks much more probable at the moment.
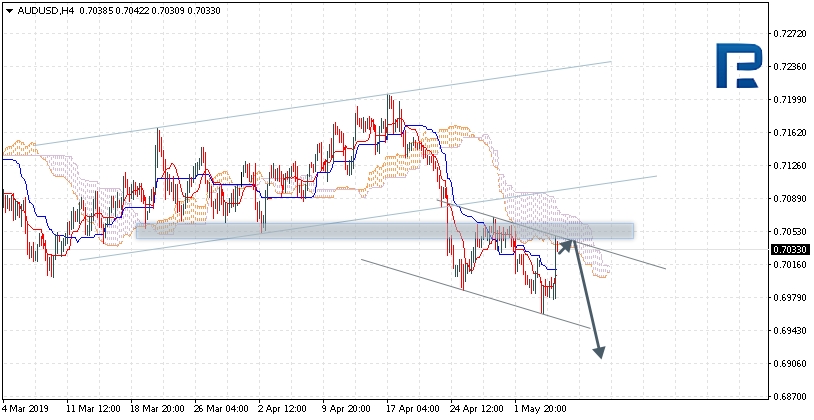
AUDUSD is trading at 0.7033; the instrument is moving below Ichimoku Cloud, thus indicating a descending tendency. The markets could indicate that the price may test the downside border of the cloud at 0.7045 and then resume moving downwards to reach 0.6905. Another signal to confirm further descending movement is the price’s rebounding from the channel’s upside border. However, the scenario that implies further decline may be cancelled if the price breaks the upside border of the cloud and fixes above 0.7075. In this case, the pair may continue growing towards 0.7145.
NZDUSD, “New Zealand Dollar vs US Dollar”
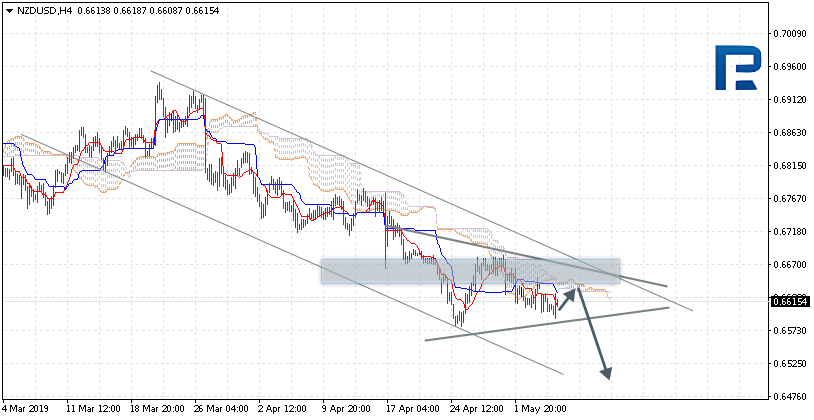
NZDUSD is trading at 0.6615; the instrument is moving below Ichimoku Cloud, thus indicating a descending tendency. The markets could indicate that the price may test the downside border of the cloud at 0.6620 and then resume moving downwards to reach 0.6475. Another signal to confirm further descending movement is the price’s rebounding from the channel’s upside border. However, the scenario that implies further decline may be cancelled if the price breaks the upside border of the cloud and fixes above 0.6675. In this case, the pair may continue growing towards 0.6745. After breaking the downside border of the Triangle pattern and fixing below 0.6570, the price may continue moving downwards.
USDCAD, “US Dollar vs Canadian Dollar”
USDCAD is trading at 1.3427; the instrument is moving inside Ichimoku Cloud, thus indicating a sideways tendency. The markets could indicate that the price may test the downside border of the cloud at 1.3420 and then resume moving upwards to reach 1.3570. Another signal to confirm further ascending movement is the price’s rebounding from the channel’s downside border. However, the scenario that implies further growth may be cancelled if the price breaks the downside border of the cloud and fixes below 1.3410. In this case, the pair may continue falling towards 1.3325. After breaking the upside border of the Triangle pattern and fixing above 1.3500, the price may continue moving upwards.
Attention! Forecasts presented in this section only reflect the author’s private opinion and should not be considered as guidance for trading. RoboForex LP bears no responsibility for trading results based on trading recommendations described in these analytical reviews.
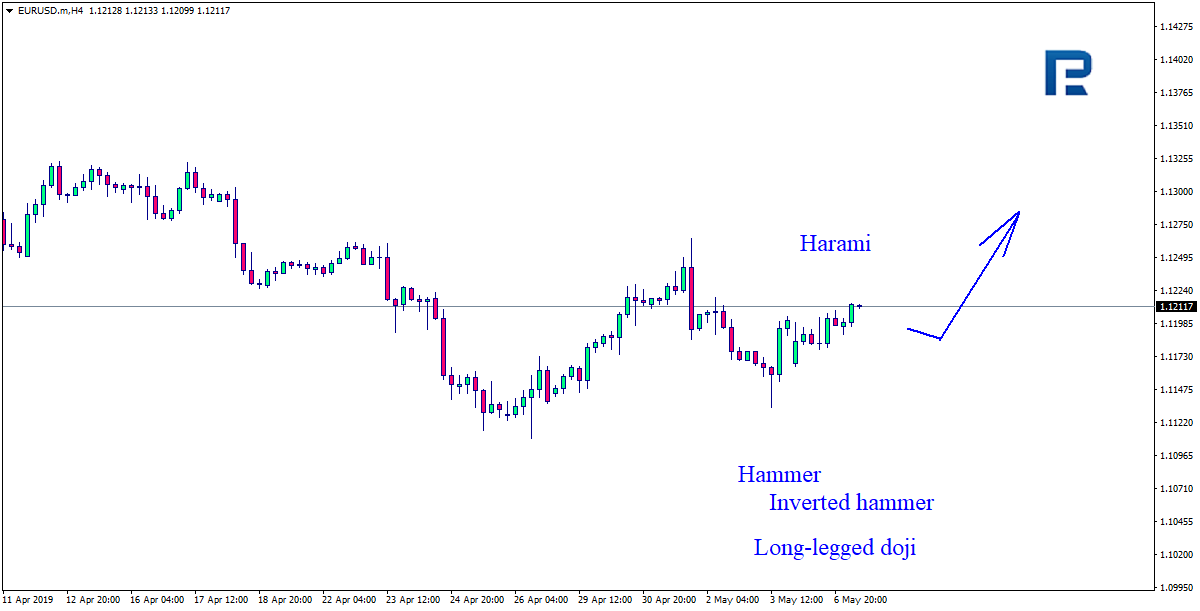
As we can see in the H4 chart, EURUSD has rebounded from the support level and formed Harami, Hammer, Long-Legged Doji, and Inverted Hammer reversal patterns. Judging by the previous movements, at the moment it may be assumed that the instrument may resume moving to the upside.
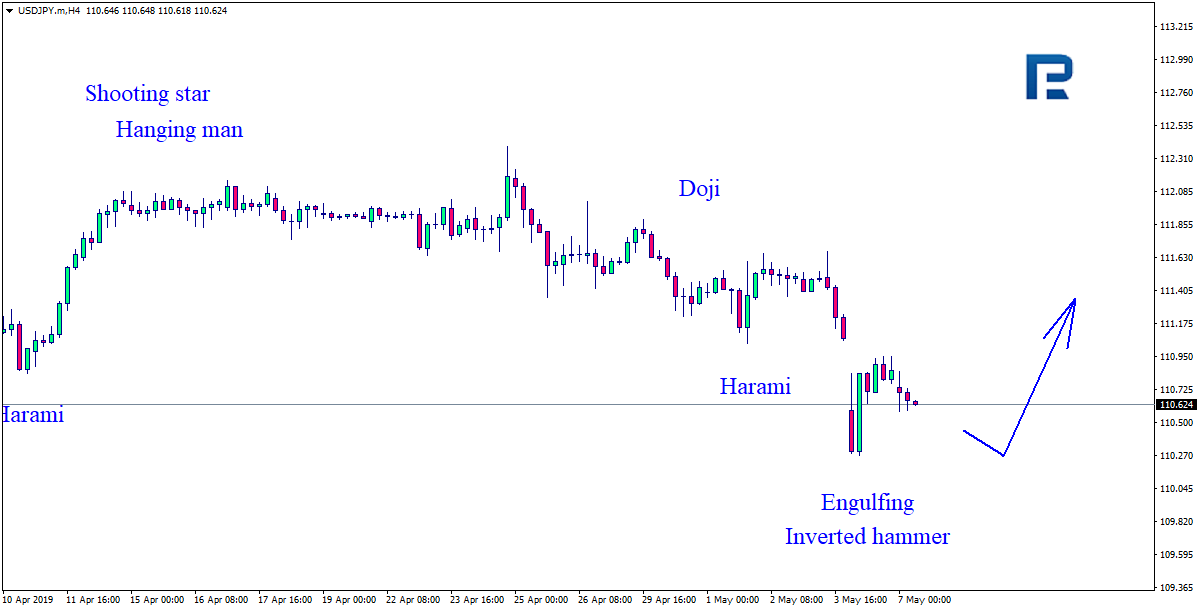
USDJPY, “US Dollar vs. Japanese Yen”
As we can see in the H4 chart, USDJPY is testing the support level and forming Engulfing and Inverted Hammer reversal patterns. Judging by the previous movements, at the moment it may be assumed that after completing its sideways movement the instrument may continue its ascending tendency.
Attention! Forecasts presented in this section only reflect the author’s private opinion and should not be considered as guidance for trading. RoboForex LP bears no responsibility for trading results based on trading recommendations described in these analytical reviews.