Finally, fundamental analysts have something to write about. The price has been moving very technically recently. We haven’t heard much from Downing Street (Brexit), Donald Trump (trade wars etc.) or Mario Draghi. Last several hours changed that and we received series of events that triggered risk off mode on the market. In this piece, we will write about bitcoin. I do not really know if BTC can be perceived as a safe heaven asset yet, but the fact is that this cryptocurrency is currently gaining traction.
From a technical point of view, the recent price action is precisely what I’ve been waiting for for quite a long time – BTC finally reached the horizontal resistance at around 5,900 USD (yellow). That resistance was a crucial long-term support, respected repeatedly in 2017 and 2018. The idea that we should reach this area was born in the middle of March when the price broke the long-term downwards trend line (blue) and the upper line of the symmetrical triangle pattern. After this, the price surged, waking up hopeless bitcoin bulls.
OK, we reached the resistance but what now? Well. This looks like a good place for a bounce but the simple fact that the price is there is not enough for us to open short position. A sell signal will be triggered when the price breaks the black line, which in this case would be the neckline of the triple top formation. On the other hand, closing the day above the yellow area would be a legitimate signal to go long on this crypto.
USD remains under pressure due to the escalating US/China trading conflict. Earlier Donald Trump stated that he plans to increase the import fees on the Chinese ware worth more than 200 billion USD from 10% to 25%. The US representative Rober Lighthighser explained that such a sharp increase is caused by the attempts of Beijing to rewrite an already approved agreement. Keep an eye on this issue. The EUR/USD quotes are consolidating around 1.11900-1.12200. You should open positions from these levels.
At 17:00 (GMT+3:00) the US will publish the JOLTS report.
The indicators do not provide precise signals: 50 MA started to cross 200 MA.
The MACD histogram is in the positive zone and above the signal line which gives a signal to buy EUR/USD.
The Stochastic Oscillator started to leave the overbought zone, the %K line is below the %D line which points to the bearish mood.
Trading recommendations
Support levels: 1.11900, 1.11650, 1.11400
Resistance levels: 1.12200, 1.12500
If the price fixes above 1.12200, expect further growth toward 1.12500-1.12700.
Alternatively, the quotes can descend toward 1.11650-1.11500.
The GBP/USD currency pair
Technical indicators of the currency pair:
Prev Open: 1.31371
Open: 1.30954
% chg. over the last day: -0.40
Day’s range: 1.30871 – 1.31313
52 wk range: 1.2438 – 1.3631
GBP/USD is consolidating after a long rally since the end of April. The local support and resistance levels are 1.31000 abd 1.31400. The financial market participants are evaluating the new Brexit information. Also, this week the UK will publish important economic releases. You should open positions from the key levels.
The Economic News Feed for 07.05.2019 is calm.
The price fixed above 50 MA and 200 MA which points to the power of the buyers.
The MACD histogram is in the postive zone and keeps rising which gives a strong signal to buy GBP/USD.
The Stochastic Oscillator started to leave the overbought zone, the %K line is below the %D line which points to the bearish mood.
Trading recommendations
Support levels: 1.31000, 1.30450, 1.29900
Resistance levels: 1.31400, 1.31750, 1.32000
If the price fixes above 1.31400, expect further growth toward 1.31750-1.32000.
Alternatively, the quotes can correct toward 1.30600-1.30500.
USD/CAD started to descend and updated the local minimums. The CAD is supported by the oil price recovering. The USD/CAD quotes are consolidating around 1.34150-1.34450 and have a tendency to descend further. You should open positions from these levels.
The Economic News Feed for 07.05.2019 is calm.
The indicators do not provide precise signals, 50 MA has crossed 200 MA.
The MACD histogram is in the negative zone and below the signal line which gives a strong signal to sell USD/CAD.
The Stochastic Oscillator is in the neutral zone, the %K line is above the %D line which points to a bullish mood.
Trading recommendations
Support levels: 1.34150, 1.33800
Resistance levels: 1.34450, 1.34750, 1.34900
If the price fixes below 1.34150, consider selling USD/CAD. The movement will tend toward 1.33800-1.33600.
Alternatively, the quotes can grow toward 1.34700-1.34900.
The USD/JPY currency pair
Technical indicators of the currency pair:
Prev Open: 110.598
Open: 110.713
% chg. over the last day: +0.15
Day’s range: 110.542 – 110.847
52 wk range: 104.97 – 114.56
USD/JPY shows an ambiguous technical picture. The trading instrument is consolidating around 110.550 and 110.850. The demand for the safe currencies remains high due to the escalation of the US/China trading conflict. You should open positions from the key levels.
The Economic News Feed for 07.05.2019 is calm.
The price fixed below 50 MA and 200 MA which points to the power of the buyers.
The MACD histogram is in the negative zone and keeps falling which gives a strong signal to sell USD/JPY.
The Stochastic Oscillator is in the neutral zone, the %K line is below the %D line which points toward a bearish mood.
Trading recommendations
Support levels: 110.550, 110.300, 110.000
Resistance levels: 110.850, 111.100, 111.400
If the price fixes below the lcoal support level of 110.550, expect the quotes to fall toward 110.300-110.000.
Alternatively, the quotes can recover toward 111.100-111.300.
The Triangle Drama of the United States, Iran, and China
By Dan Steinbock
Starting in May, the White House hopes to extinguish Iran’s oil exports. However, any destabilization may prove counter-productive and cause long-term damage to the United States, the region and global prospects.
For three years, the nuclear accord (JCPOA) offered Iran relief from the multilateral sanctions on energy, financial, shipping, automotive and other sectors.
The shift in the U.S. policy began in late 2016, when the Congress extended the Iran Sanctions Act for a decade. That emboldened Trump’s unipolar stance.
But what are the immediate economic and strategic implications?
Implications of three-step destabilization
Regionally, Trump’s stance leans on Saudi Arabia for economic and geopolitical support, as evidenced by the $110 billion arms deal with Riyadh in 2017, and reinforced security ties with Israel. The increasing convergence of the U.S., Saudi and Israeli interests in the Middle East reflects a quest for regional primacy.
Initially, John Bolton, Trump’s neoconservative national security advisor, urged Trump to bury the JCPOA and push for a regime change before February 2019; the 50th anniversary of the Iranian revolution. The new timeline is more flexible, but the old objectives remain. The three-step destabilization was started with the rejection of JCPOA (juridical pressure), which was followed by sanctions (to cause economic pain) that would provide the pretext for regime change (military intervention in the name of “peace and democracy”).
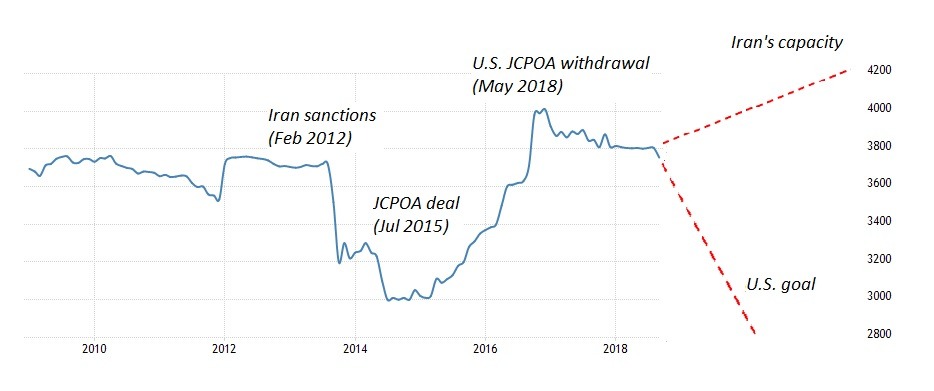
Despite deficiencies, data on Iran’s crude oil indicates some trends. According to OPEC, Iran’s crude oil production remained around 3.8 million barrels per day until the 2012 sanctions, which caused the capacity to plunge to 3 million. Following the JCPOA, Iran’s production soared rapidly back to 4 million barrels. With Trump’s electoral triumph and the concerted effort at regime change, the capacity has steadily decreased to less than 3.7 million barrels (Figure1).
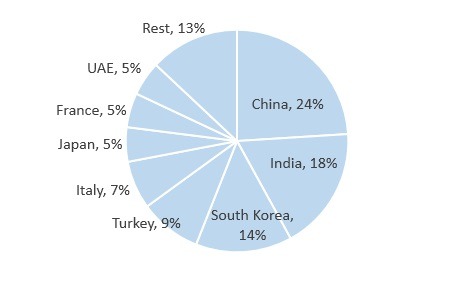
If Iran’s production capacity takes a hit, that will penalize particularly its biggest importers; that is, China, India, South Korea and Turkey which accounted for two-thirds of all Iranian exports in 2017, along with Japan, Turkey, Europe (Italy, France), and UAE (Figure 2). Consequently, the strategic responses to U.S. sanctions by Iran’s major export destinations matter. Available data on oil purchases in the past 6-12 months indicate that China, India and Turkey have reduced their buys by about 25%, respectively; Japan by 20% and South Korea almost entirely. Yet, the role of “unknown sources” in Iran’s oil exports has quadrupled.
Figure 2 Iran’s Oil Exports by Countries, 2017 (% share of total)
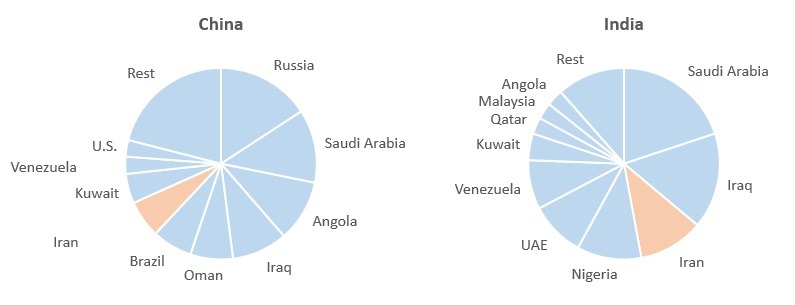
Conversely, import diversification tells something about their degree of reliance on Iran. Last year, China’s largest crude oil importer was Russia, followed by Saudi Arabia, Angola and Iraq. These top-4 suppliers accounted for half of China’s total oil imports. Among them, Iran ranked seventh accounting for 6.3% of the Chinese total. In turn, India’s largest suppliers featured Saudi Arabia, Iraq, Iran and Nigeria, which accounted some 60 percent of the total. Among these, Iran was third, accounting for 11% of the total – that is, twice as much as to China in relative terms (Figure 3).
Figure 3 Key Oil Importers of China and India, 2018 (% share of total)
Last year, global purchases of imported crude oil totaled $1.2 trillion reflecting robust demand from 129 countries. Asian countries accounted for more than half of the total. The largest oil importer was China (20.2% of total crude oil importers), followed by the U.S. (13.8%), India (9.7%) and Japan (6.8%) (Figure 5).
Figure 4 World’s Leading Oil Importers, 2018 ($ billion, % of total)
Obstacles to the regime change ploy
In May 2018, Trump had the U.S. withdraw from the JCPOA, while pledging to reimpose U.S. secondary sanctions by November 2018. The reinstatement drove Iran’s economy into mild recession as major companies exited the Iranian economy rather than risk being penalized by the U.S. Iran’s oil exports have decreased significantly, and the value of Iran’s currency has declined sharply.
The EU and some other countries are trying to sustain the economic benefits of the JCPOA flowing to Iran hoping to keep Tehran in the accord. From Iran’s viewpoint, these efforts have been promising, but remain far from adequate.
Geopolitically, the destabilization of Iran is designed to foster the regional supremacy of America’s key allies in the region, particularly Saudi Arabia and the Gulf states. Strategically, the Iran sanctions serve major oil exporters which just happen to be among the key suppliers of both China and India, respectively – that is, Saudi Arabia, Iraq, and the Gulf (Oman, Kuwait, UAE, Qatar).
Nevertheless, the Trump hawks’ Iran plans are based on misguided assumptions. Saudi Arabia and UAE can boost higher production levels some of the time, but not all of the time. A protracted effort could destabilize markets further. More importantly, Saudi Arabia (and the U.S.) can offer mainly “light crude oil,” but not “heavy oil,” which many countries need for refined oil products – and which Iran can offer.
Furthermore, China and Turkey, which oppose U.S. unilateralism, along with possibly India and some EU allies, will try to work around U.S. sanctions for economic, geopolitical and development reasons. While China is not critically reliant on Iranian oil, it vehemently opposes unipolar bullying.
There is also the last-resort scenario. If the White House will push Iran against the wall, it could close the Strait of Hormuz – which none of oil exporters and importers want.
The Trump administration believes that America’s military superiority, economic clout and energy dominance suffice to undermine the JCPOA and achieve regime change. Yet, U.S. shale oil is not adequate to dictate unipolar terms to the rest of the international community. Moreover, most Americans see U.S. involvement against Iran as an unnecessary risk. Finally, U.S. economic power is overshadowed by its $22 trillion sovereign debt and the end of the expansionary cycle.
Global repercussions
The JCPOA fostered Iran’s economic development, which would have had a constructive effect on its regional role. U.S. efforts at regime change have not played out expectedly even in Venezuela; and Iran is far more capable and determined to defend its rights in the international arena, with the support of much of the international community.
Economically, sanctions against any major oil exporter will diminish total capacity worldwide and boost crude prices. Before the 2008 global crisis, oil prices soared to almost $150 per barrel. After a severe plunge to $40, they returned to $100 in the early 2010s. As the Fed’s rate hikes caused the U.S. dollar to strengthen, oil prices, which remain denominated in dollars, plunged to mid-$20s. Since then, Fed hikes have normalized and U.S. dollar steadied, which supports rising prices (Figure 5).
Figure 5 Oil Prices, 2000-2019
Until the late 1960s, America was still an oil exporter. In the past half a century, it has been an importer, which has constrained its geopolitical aspirations. That is now changing. To President Trump, America’s “energy dominance” means not just economic, but geopolitical muscle. That explains much of recent U.S. assertiveness and regime change plans in Iran (and Venezuela). Yet, U.S. production accounts for barely 15% of global output, which limits its ability to move global oil markets.
Despite its vocal threats, the Trump White House is in a double-bind. If it does not deliver regime change in Iran, it will be seen as a paper tiger, which will further erode U.S. credibility in the Middle East. If it executes its violent plans, the result could be years of violent turmoil, destabilized region, derailed global prospects – and oil prices exposed to new supply shocks.
About the Author:
Dr. Dan Steinbock is an internationally recognized strategist of the multipolar world and the founder of Difference Group. He has served at India, China and America Institute (US), Shanghai Institutes for International Studies (China) and the EU Center (Singapore). For more, see https://www.differencegroup.net/
The original version was released by China-US Focus on May 3, 2019
The US dollar slightly strengthened against a basket of major currencies during yesterday’s trading. However, the US currency is under pressure due to news of the complicated relationship between the United States and China. The US Trade Representative, Robert Lighthizer, said that US duties of 10-25% on Chinese goods $200 billion worth would be introduced on Friday. He noted that the United States decided to raise duties since China tried to revise the almost ready trade agreement. The dollar index (#DX) closed in the positive zone (+0.10%).
The Australian dollar strengthened significantly against the US currency after the publication of optimistic data from Australia. The Reserve Bank of Australia left the interest rate unchanged at 1.50%, as experts expected. Also, a report on retail sales was published, which rose by 0.3% in March, although experts expected growth by 0.2%.
It also became known that the British Prime Minister Theresa May prepared a “scenario” in case of second Brexit referendum. The official hopes that the UK will be able to exit the EU without an additional vote, but she is ready for the parliament to demand such an option.
The “black gold” prices are rising slightly. At the moment, futures for the WTI crude oil are testing the mark of $62.15 per barrel. At 23:30 (GMT+3) API weekly crude oil stock will be published.
Market Indicators
Yesterday, the bullish sentiment was observed in the US stock market: #SPY (-0.41%), #DIA (-0.26%), #QQQ (-0.61%).
The 10-year US government bonds yield is declining. Currently, the figure is at the level of 2.48-2.49%.
Late Sunday afternoon, President Trump surprised the global markets with the announcement of increased trade tariffs with China relating to the ongoing trade negotiations and delayed trade talks between the two global superpowers. The global markets reacted immediately upon the open Sunday night (Asian open). The VIX short position puts quite a bit of professional traders at risk of big losses today while those of us that were prepared for an increase in volatility and price rotation is poised for some incredible opportunities.
The US stock market is set up for a price move that will likely make many people very wealthy while frustrating many others over the next few months. We’ve recently posted many articles regarding the 2020 US Presidential election cycle and the fear cycle that comes from these major political events. In November 2016, we remember watching Gold rally $60 early in the election night, then fall $100 as news began reporting the surprise winner. There is so much capital, and future capital expectations that ride on these election cycles – it can actually drive the markets in one direction or another.
Right now, we have two things we want to alert you to regarding our proprietary Fibonacci price modeling utility. First, the current trend is Bullish and the chance of a downside price move is still valid. Remember, one of the primary price rules within Fibonacci price theory is that price must ALWAYS attempt to seek out new highs and new lows – at all times. This means that once price establishes new price highs, any failure to continue establishing new price highs, through standard price rotation, will result in its price attempting to establish new price lows.
So, as we continue with our expectations, remember that any failure of price to continue the push higher means it WILL rotate lower and attempt to establish new price lows.
Taking a look at this IWM Monthly chart shows a very clear price rotation near the end of 2018 and that the current price has yet to rally above the October 2018 highs. In this instance, we have a FAILURE to establish new price highs within the current price move. We also have a new price low established in December 2018. This high and low sets up the range of $173.99 and $125.80. Fibonacci price theory tells us that PRICE WILL attempt to establish a new price high or new price low from within this range. Therefore, the price WILL either continue to rally higher and break the $173.99 level or price WILL reverse lower, without reaching the $173.99 level and target the $125.80 level.
Our modeling system is currently telling us that price and trend is bullish and that the current price level has clearly rallied above the Fibonacci price trigger levels near $143.50. Should price rotate lower and breach these Fibonacci price trigger levels, then we would expect the price to move much lower. Right now, we don’t expect that to happen based on a strong US economy, employment and earnings.
This Monthly SPX chart shows a similar setup – yet the main difference is that the current HIGH PRICES are clearly above the October 2018 previous highs. Thus, in this instance the SPX has reached “new price highs” as a component of Fibonacci price theory and, because of this fact, must continue to strive for new price highs or risk failing and rotating lower to establish new price lows.
In fact, the past three trading sessions are proprietary SP500 index trading system issued two quick winning trades for members. The two trades pulled 2.5% and 2% out of the market in less than 24 hours from the entry prices. This momentum and trend trading system are going to be a new trading weapon for us to follow and trade the markets once we implement this into the member’s area for viewing the charts and signals at any time.
Take a look at last weeks trade and today’s trade which both hit T1 (Target 1).
Take a look at the chart below then consider what that last statement really means. It suggests that we have already reached into new price high territory. Fibonacci theory suggests that “once new price highs are established, the trend MUST continue to attempt to establish new higher price highs – OR FAIL and attempt to establish a new price low. Well, a failure at this level could mean a price move all the way back towards recent lows near December 2018 – near $2346.58. Therefore, it is critical that we see other markets, like the IWM, continue to push higher in an attempt to support this broader upside price move for all the US major stocks.
The most important factor going forward is to be prepared to think and react very quickly to price rotations, news, and the election cycle process. Take a look at how volatile the market has become over the past 12 months and consider the fact that we could continue to see this type of volatility in the markets for the next 15+ months – at least through the election cycle process.
Remember also that the US economy is operating on very strong fundamentals, employment, and outputs. Disruption of future expectations could lead to a massive displacement of capital in the global markets. Watch Oil, Gold, Silver and other commodities for any signs of weakness. And pay attention to the levels we are suggesting in this research post. If the SPX falls below $2600 – be prepared. If the IWM falls below $142 – be prepared. Price is always seeking out new price highs and new price lows. If it can’t get one side, it will attempt to get the other.
The global market “Shake-out” that we wrote about weeks ago is just starting. Our expectations are that an increase in price volatility, as well as a minor price rotation, will take place in the US markets before a continued upside price bias will drive prices higher again. There are two main drivers that will become leaders of any bigger rotation in the global markets – Metals and Commodities. If we begin to see a collapse in commodity prices, pretty much across the board, while metals breakout into a rally, then we are setting up for a bigger downside price move. Until that happens, continue to expect an upside price bias to continue in the US stock market.
Secondly, should a massive currency revaluation event take place, where global currencies weaken as the US Dollar stays strong, then we could be setting up for a “slow unraveling” of foreign debt markets and foreign equity markets. This would be almost like a “slow bleed out” as a currency devaluation event prompt incredible pricing pressures on local foreign governments to support their economies. These devaluation events, if they happen, could prompt a hyper-inflation type of event that could disrupt weaker nations to such a degree that they could weaken world-leading economies that have exposure to these foreign nations – Think China/Russia.
Our advice continues to be to look for opportunities as the volatility increases and continue to expect an upside price bias in the US stock market – at least until we have any strong evidence that price trend has changed. Don’t buy into the doom-sayers just yet. In our opinion, this US upside price move is not over yet.
If you want to become a technical trader and pull money from the markets during times when most others cannot be sure to join the Wealth Trading Newsletter today. Plus, for a few days only I’m giving away and shipping Free Silver Rounds to subscribers who join our select membership levels.
After scanning all instruments available on our platform, there is one where the technical situation looks the most promising. This instrument is the USDCAD, where buyers have a huge chance of success. It doesn’t look bad from a fundamental point of view either. The current risk off mode favours buyers, so in this case, both dominant ways of analysing the market are positive.
For USDCAD, it all started in February when the pair bounced from the long-term upwards trend line (black) using the inverse head and shoulders pattern (red neckline). After this formation, we went higher and created a symmetrical triangle formation (green line). The triangle also resulted in a rise, giving us a buy signal. Most recently, the upper line of the triangle was tested as a support, giving us another bounce, and in other words – bullish confirmation.
To sum up, trend is bullish and two recent technical formations were bullish too. There’s currently no sign of a reversal, so objectively, we have a higher chance of an upswing than we do for a drop. The long-term buy signal is present here as long as the price is above the black line. Only USDCAD closing the day below this long-term upwards trend line will be an invitation to go short.
On Monday the 6th of May, trading on the EURUSD pair closed down by 1 pip on Friday’s value, although the day’s candlestick had a bullish body. This was made possible due to the price gap, as trading opened down on Friday’s closing price. An escalation to the trading conflict between the US and China has prompted a retreat to the safe havens.
US President Donald Trump announced that tariffs would be increased from 10% to 25% on 200bn USD of Chinese goods on Friday. This got a negative reaction from China.
Robert Lighthizer, the US Trade Representative, said that China’s backtracking on previous commitments was responsible for Trump’s tweet. China is expected to send a delegation to Washington for further talks.
The euro was the day’s biggest winner against the dollar with help from the crosses. Demand for the euro crosses surged after the release of Eurozone data and the pound’s drop. After closing the price gap, the pair hovered around 1.1190.
Day’s news (GMT+3):
17:00 Canada: Ivey PMI (Apr).
17:00 US: JOLTS job openings (Mar).
18:35 US: Fed’s Quarles speech.
19:30 UK: BoE’s Haldane speech.
22:00 US: consumer credit change (Mar).
Current situation:
The euro is recovering via a saw tooth model. Considering that many of the majors suffered a 0.5% decline yesterday, while the euro didn’t, I expect the single currency to drop to the LB in the first half of today’s European session. The technical picture still indicates a rise to 1.1280. The 67th degree is providing support, so considering how the stochastic is set up, it’s better to hold off on long positions until we get to the LB.
Last Friday’s trading session was pretty volatile for the major currency pair, although it was quite obvious that market players just wanted to “rock the boat”.
The numbers on the labor market published by the USA last Friday were mostly positive. The Non-Farm Employment Change showed 263K, which was better than market expectations of 181K. The Unemployment Rate went from 3.8% in March to 3.6% in April, although it wasn’t expected to change. The actual reading is the lowest over the last 49 years.
However, the Average Hourly Earnings in the USA added only 0.2% m/m against the expected reading of +0.3% m/m. This is what really attracted investors’ attention. In addition to that, they decided to focus on a minor indicator, the Participation Rate, which also got a little bit worse.
Most likely, it was just not a good day for the USD: investors were ignoring all positive reports and paid close attention to negative numbers. The same happened to the Services PMI from Markit and the ISM Non-Manufacturing PMI for April. The first indicator increased up to 53.0 points and went unnoticed, while the second one reduced to 55.5 points and put additional pressure on the American currency.
As we can see in the H4 chart, after breaking 1.1200 to the downside once again, EURUSD has returned to this level. Possibly, today the pair may form a narrow consolidation range below 1.1200. If the price breaks 1.1166 downwards, it may continue falling with the first target at 1.1085. However, this scenario may be cancelled if the pair breaks 1.1200 upwards. An alternative scenario implies that the instrument may continue the correction towards 1.1244. From the technical point of view, this is confirmed by Stochastic Oscillator, as its signal line is moving above 50.00.
In the H1 chart, EURUSD has completed the correctional structure; right now, now it is consolidating at its top. In the short-term, the pair may start a new decline. After breaking 1.1166, the price may start a new wave to the downside towards 1.1085. From the technical point of view, this potential decline is confirmed by MACD Oscillator, as its signal line is moving below 0.00 and may continue falling. An alternative scenario suggests that 0.00 may be broken to the upside. In this case, the correction may continue to reach 1.1244.
Disclaimer
Any predictions contained herein are based on the authors’ particular opinion. This analysis shall not be treated as trading advice. RoboForex shall not be held liable for the results of the trades arising from relying upon trading recommendations and reviews contained herein.
Precious Metals traders have been hanging on every turn in the markets over the past 2+ years. The upside price move in early 2016 setup a very strong expectation that further upside price moves were about to result in an upside price explosion in metals. Remember, 2016 was a very big US Presidential election year. 2020, being the next big US Presidential election year, is only about 7 months away and the rancor has already started in the news cycles.
Our proprietary Fibonacci price modeling system is suggesting that Silver has set up an ABC bottom in Oct/Nov 2018 and has already initiated an A/B upside price leg that should result in a C or C/D/E price advance over the next few months. Our Fibonacci price modeling system is suggesting an upside price target of $22 per ounce for this move, which breaks the previous July 2016 highs of $21.22. We believe the ultimate upside target of this next bullish move is bear $28 to $29 based on longer-term Fibonacci price modeling.
Initially, this upside move must break the $16.30 level, which represents immediate resistance. Then, it must push above the $18.66 level, which represents secondary resistance. Once Silver passes the $18.66 level, the last leg higher will attempt to break the $21.22 level and push up into new recent highs (higher than the 2016 highs).
We believe the current US Presidential election cycle will be full of twists and turns – most of which will be very public and explosive. We believe this election cycle will create a certain level of fear in the markets that are above and beyond what we have seen over the past 15+ months. In a method that is very similar to what happened in 2016, the public will become entrenched in the election cycle process and the global economy may suffer slightly as the political shenanigans continue to play out on our TVs, newspapers and web browsers.
The October/December 2018 lows were, most likely, the lowest price levels we will see going forward. Additionally, the current price levels, below $15 per ounce, may be the last time we’ll have the opportunity to see prices this low in a number of years. Our price modeling is suggesting that Silver and Gold will begin a Momentum Base Rally from these lows that may last many years.
If you want to know when we get long Silver next be sure to join our Wealth Trading Newsletter and get our trading signals. In fact, we are giving away and shipping FREE Silver rounds for select membership levels for the next few days.
EURUSD has completed the descending impulse at 1.1165 along with the correction towards 1.1195. If later the price breaks the range to the downside, the instrument may resume trading inside the downtrend with the target at 1.1111; if to the upside – choose an alternative scenario and continue the correction towards 1.1232.
GBPUSD, “Great Britain Pound vs US Dollar”
GBPUSD has rebounded from 1.2952 and finished another correctional structure; right now, it is trading downwards. The target is at 1.2987.
USDCHF, “US Dollar vs Swiss Franc”
USDCHF is consolidating above 1.0170. Possibly, today the pair may break the range to the upside and reach the target at 1.0199. However, if the price breaks the range to the downside, the instrument may continue the correction towards 1.0126.
USDJPY, “US Dollar vs Japanese Yen”
USDJPY has reached the first downside target. Today, the pair may grow to reach 110.62 and then form a new descending structure towards 110.46. If later the price breaks the range to the upside, the instrument may start a new correction with the target at 111.20; if to the downside – continue forming the first wave towards 109.90.
AUDUSD, “Australian Dollar vs US Dollar”
AUDUSD has broken 0.6996 and reached 0.6945. Possibly, today the pair may grow to return to 0.6996 and then start another decline with the first target at 0.6925.
USDRUB, “US Dollar vs Russian Ruble”
USDRUB has broken 65.22. According to the main scenario, the price is expected to continue falling with the target at 64.85. Later, the market may form one more ascending structure to reach 66.06 and then start another decline towards 64.65.
XAUUSD, “Gold vs US Dollar”
Gold has completed the ascending structure at 1294.36; right now, it is consolidating around 1281.70. If later the price breaks the range to the downside, the instrument may resume trading inside the downtrend with the first target at 1264.80.
BRENT
Brent has completed the correction at 70.00. Possibly, the pair may grow to reach 71.50. After that, the instrument may form a new descending structure towards 70.30. If later the price breaks the range to the upside, the instrument may resume trading inside the uptrend with the target at 76.50; if to the downside – continue the correction towards 68.50.
Attention! Forecasts presented in this section only reflect the author’s private opinion and should not be considered as guidance for trading. RoboForex LP bears no responsibility for trading results based on trading recommendations described in these analytical reviews.
 From a technical point of view, the recent price action is precisely what I’ve been waiting for for quite a long time – BTC finally reached the horizontal resistance at around 5,900 USD (yellow). That resistance was a crucial long-term support, respected repeatedly in 2017 and 2018. The idea that we should reach this area was born in the middle of March when the price broke the long-term downwards trend line (blue) and the upper line of the symmetrical triangle pattern. After this, the price surged, waking up hopeless bitcoin bulls.