From the technical point of view, the H4 chart of XAUUSD shows the correction that started after the convergence. The previous descending wave has reached the retracement of 50.0%. If the price breaks the low at 1266.28, the instrument may continue falling towards the retracement of 61.8% at 1253.87.
As we can see in the H1 chart, the pair is moving upwards and testing the retracement of 23.6%. The next upside targets may be the retracements of 38.2% and 50.0% at 1296.94 and 1306.47 respectively.
USDCHF, “US Dollar vs Swiss Franc”
In the H4 chart, USDCHF has broken the previous low; right now, it is still trading downwards. After completing the correction, the price is expected to break the high at 1.0236 and continue growing to reach the post-correctional extension area between the retracements of 138.2% and 161.8% at 1.0246 and 1.0307 respectively.
As we can see in the H1 chart, the current downtrend has reached the retracement of 23.6%. The next targets may be the retracements of 38.2%, 50.0%, and 61.8% at 1.0109, 0.0071, and 1.0032 respectively.
Attention! Forecasts presented in this section only reflect the author’s private opinion and should not be considered as guidance for trading. RoboForex LP bears no responsibility for trading results based on trading recommendations described in these analytical reviews.
On Friday US published mixed reports on the Labour Market for April. The non-agrarian industry created 263 000 workplaces which is much higher than expected. The unemployment lowered to 3.6% – the 49-year minimum. At the same time, the average hourly wage grew only by 0.2%, which is lower than expected 0.3%. The economically active population lowered from 63% to 62.8%. The ISM’s non-industrial business activity index slowed down from 56.1 to 55.5.
The trading conflict between Washington and Beijing in once again in the foreground. Donald Trump tweeted that on Friday the Chinese wares worth more than 200 billion USD will have their fees increased from 10% to 25%. Keep an eye on this issue.
EUR/USD is consolidating around 1.11650-1.12000. Open positions from these marks.
At 11:00 (GMT+3:00) we expect an array of economic releases from the EU.
The indicators do not provide precise signals: 50 MA started to cross 200 MA.
The MACD histogram is in the positive zone but below the signal line which gives a weak signal to buy EUR/USD.
The Stochastic Oscillator is in the neutral zone, the %K line is below the %D line which points to the bearish mood.
Trading recommendations
Support levels: 1.11650, 1.11400, 1.11200
Resistance levels: 1.12000, 1.12250, 1.12600
If the price fixes below 1.11650, expect further descend toward 1.11400-1.11200.
Alternatively, the quotes can grow toward 1.12250-1.12500.
The GBP/USD currency pair
Technical indicators of the currency pair:
Prev Open: 1.30276
Open: 1.31371
% chg. over the last day: +1.07
Day’s range: 1.31102 – 1.31706
52 wk range: 1.2438 – 1.3631
GBP/USD had shown agressive sales on Friday. GBP updated the key maximums. Jeremy Corbin, the leader of the British Labour party made a statement that the Parliament should just “deal with it” and reach an agreement on Brexit. These comments gave GBP remarkable support. The quotes are currently consolidating around 1.31000-1.31400. You should open positions from these levels. Further growth is not out of question.
The British markets are currently closed due to a holiday.
The price fixed above 50 MA and 200 MA which points to the power of the buyers.
The MACD histogram is in the positive zone but below the signal line which gives a weak signal to buy GBP/USD.
The Stochastic Oscillator started to leave the oversold zone, the %K line is above the %D line which points to the bullish mood.
Trading recommendations
Support levels: 1.31000, 1.30450, 1.29900
Resistance levels: 1.31400, 1.31750, 1.32000
If the price fixes above 1.31400, expect further growth toward 1.31750-1.32000.
Alternatively, the quotes can correct toward 1.30700-1.30500.
USD/CAD shows an ambiguous technical picture. The CAD keeps consolidating. The key support and resistance levels are 1.34550 and 1.34900. The pressure on the CAD is caused by the weak oil quotes. The trading instrument can grow further. You should open positions from the key levels.
Keep an eye on the statements made by the Head of the Bank of Canada.
The indicators do not provide precise signals, 50 MA has crossed 200 MA.
The MACD histogram is in the positive zone but above the signal line which gives a strong signal towards buying USD/CAD.
The Stochastic Oscillator is in the neutral zone, the %K line is crossing the %D line. There are no signals at the moment.
Trading recommendations
Support levels: 1.34550, 1.34100, 1.33800
Resistance levels: 1.34900, 1.35200
If the price fixes above 1.34900, consider buying USD/CAD. The price is supposed to move toward 1.35200-1.35400.
Alternatively, the qutoes can descend toward 1.34200-1.34000.
The USD/JPY currency pair
Technical indicators of the currency pair:
Prev Open: 111.488
Open: 110.598
% chg. over the last day: -0.37
Day’s range: 110.284 – 110.844
52 wk range: 104.97 – 114.56
USD/JPY is in the bearish mood. The trading instrument opened with a gap down by 50 points and updated the local minimums. The demand for the safe currencies has grown due to the escalation of the US/China conflict. Keep an eye on this issue and open positions from the 110.600-110.850 levels. The currency pair can descend further.
Japanese financial markets are closed due to the holidays.
The price fixed below 50 MA and 200 MA which points to the power of the sellers..
The MACD histogram is in the negative zone which gives a weak signal to sell USD/JPY.
The Stochastic Oscillator is in the neutral zone, the %K line is below the %D line which points to the bearish mood.
Trading recommendations
Support levels: 110.600, 110.300, 110.000
Resistance levels: 110.850, 111.100, 111.400
If the price fixes below 110.600, expect it to descend toward 110.300-110.000.
Alternatively, the quotes can recover toward 111.100-111.300.
On Friday, the US dollar weakened against a basket of major currencies due to mixed economic statistics. Thus, the number of people employed in the nonfarm sector increased by 263K in April, while investors expected growth by only 181K. Also, the unemployment rate fell to its lowest level within 49 years – 3.6%. However, experts were upset that the average hourly earnings rose by 0.2% in April instead of the expected increase by 0.3%. ISM non-manufacturing PMI counted to 55.5 in April, while experts forecasted 57.2. The dollar index (#DX) closed in the negative zone (-0.40%).
The US currency is under pressure due to the news that US President Donald Trump decided to sharply increase the pressure on China on Sunday. The President said he would raise US tariffs from 10% to 25% for Chinese goods $200 billion worth this week. It worsened relations between the United States and China seriously and dramatically. Beijing considers cancellation of trade talks this week in Washington because of Trump’s comments, which caught Chinese officials flatfooted.
Jeremy Corbyn, the leader of the British Labour Party, said on Friday that parliament should “negotiate” and break the impasse over Brexit. These comments have supported the British pound.
The “black gold” prices fell by more than 2% due to Donald Trump’s claims. At the moment, futures for the WTI crude oil are testing the mark of $60.60 per barrel.
Market Indicators
On Friday, the bullish sentiment was observed in the US stock market: #SPY (+0.98%), #DIA (+0.80%), #QQQ (+1.59%).
The 10-year US government bonds yield fell. Currently, the indicator is at the level of 2.51-2.52%.
The news feed on 2019.05.06:
At 11:00 (GMT+3:00) we expect important statistics on economic activity in the Eurozone.
We also recommend following up-to-date information regarding trade negotiations between the US and China, as well as paying attention to the speech by the Governor of the Bank of Canada, Poloz.
Last week, trading on most of the majors closed up against the US dollar. The biggest winner was the pound (+2.03%), followed by the euro (+0.55%), the yen (+0.41%), the Swiss franc (+0.32%), and the Canadian dollar (+0.26%). The only currencies to lose out were the Kiwi and Aussie dollars, which shed 0.20% and 0.22% against the greenback respectively.
On Friday the 3rd of May, the euro bulls recovered all their losses to close the day up against the dollar. After the NFP report came out, the euro dropped to 1.1135. The US employment report exceeded expectations, with the number of new jobs increasing, and the unemployment rate decreasing.
The dollar erased all its gains as traders turned their attention towards the negative components of the report. The rise in wages was modest, while the workforce participation rate decreased.
263k new jobs were added to the US economy outside the agricultural sector in April against a forecast of 190k (predictions ranged from 120k to 250k). The readings for the two previous months were revised upwards by 16k. The unemployment rate dropped from 3.8% to 3.6%. The participation rate slid from 63.0% to 62.0%. Average hourly earnings rose by 0.2% against a forecasted rise of 0.3%, while the year-on-year value came out at 3.2% (previous reading: 3.3%).
Further pressure was heaped on the dollar by the ISM report. The ISM non-manufacturing PMI for April posted a value of 55.5, down from 56.1 in March (forecast: 57.0). I don’t think this report was of much interest to speculators following the NFP report. They took advantage of it to cash in on their long positions and open shorts. The EURUSD then rose to 1.1205.
Day’s news (GMT+3):
10:50 France: Markit services PMI (Apr).
10:55 Germany: Markit services PMI (Apr).
11:00 Eurozone: Markit services PMI (Apr).
11:30 Eurozone: Sentix investor confidence (May).
12:00 Eurozone: retail sales (Mar).
16:30 US: Fed’s Harker speech.
20:45 Canada: BoC Governor Poloz speech.
Current situation:
On Monday the 6th of May, trading opened with a sharp drop on the euro. The Forex market is in the red as a result of news concerning the US and China. The major currencies suffered a decline following a tweet from American journalist Edward Lawrence, saying that Chinese Vice Premier Lui He has cancelled his trip to Washington following a recent tweet from Trump threatening to increase tariffs on Chinese goods.
The euro recovered its overnight losses. Our pair is trading around 1.1192 against a low of 1.1170. In my forecast, I expect the pair to go against Friday’s rally with a decline to the 45th degree at 1.1152. If today’s low of 1.1170 isn’t surpassed, we can expect the pair to recover to 1.1260.
Since 2001 I have been refining my index trading skills and strategies in the hope that one day I would provide a steady stream of trades and income and possibly even be able to automate the trading for me.
Now, 18 years later I have made most of these dreams/goals come true with a robust trading system that makes trading momentum drops and pops, swing trading, and trend following really simple. While it’s not 100% complete, and likely never will be as I’m always working on adapting things work with the everchanging markets, it is something I’m really proud of and excited to share with fellow traders. Over the next month or so I will be pushing to get this new application running for members to watch and receive the trade alerts.
Take a look at this year’s chart of the system which really is incredible, but the rally the market is experiencing is also not the norm in terms of price action.
The next chart shows the most recent trade taken this Thursday and the first momentum trade target was hit in less than 24 hours for a quick 2.5% profit on the SP500.
To make things even more exciting this strategy works well with high momentum stocks and the most recent trade we took on CPRX we locked in 10% from our entry price as shown below.
I am about to launch a new technology product to assist our members like this one explained above, where we can highlight our proprietary price modeling systems complete with all the trade signals (entry, stops, targets). This added analysis and trade signals are bonus value added for our loyal followers.
If you want to stay ahead of these markets moves and find greater success in 2019 and beyond, then Join www.TheTechnicalTraders.com today.
EXTRA UNIQUE OPPORTUNITY
First, we typically see stocks sell-off and as the old saying goes, “Sell in May and Go Away!”
So what does this mean? It means we should start to see money flow into the safe-haven assets like the Utility sector, bonds, and most importantly precious metals.
Second, my birthday is this month, and I think its time I open the doors for a once a year opportunity for everyone to get a gift that could have some considerable value in the future.
For May I am going to give away and ship out silver rounds to anyone who buys a 1-year, or 2-year subscription to my Wealth Trading Newsletter for the first 25 subscribers. You can upgrade to this longer-term subscription or if you are new, join one of these two plans, and you will receive:
1-Year Subscription Gets One 1oz Silver Round FREE (Could be worth hundreds of dollars)
2-Year Subscription Gets TWO 1oz Silver Rounds FREE (Could be worth a lot in the future)
I only have 25 silver rounds I’m giving away so upgrade or join now before its too late!
The FX trading environment has become a little slower in Q2 and although trades continue to present, they have a much lower in profit range – just means working a touch harder. However, it also presents an opportunity as we can now use variable filters with a smoother and more effective output compared to those periods of high volatility– look at Brexit for example and the effect it had on the GBP.
Thus a variable filter I enjoy using is central bank differentials and with central bank speak in full swing policy differential are becoming clearer and more defined, which is why EUR/USD is flashing at me.
First and foremost, I need to address the European GDP read that was well ahead of market expectations. It created a snap back in EUR crosses, and some have even gone as far to say the fears around a European growth decline have been overblown and that Europe will march on. However, April flash PMIs were once again disappointing to say the least. German manufacturing figure missed again – in fact they have missed every month since July 2018. April PMIs also suggested that there might be renewed weakness in Italy and Spain which where drivers of European Q1 GDP.
This is opening the door for the European Central Bank (ECB) to add additional monetary easing most likely in the form of LTRO loans or some other form of European QE. There is also growing though that the Deposit Rate is also being eyed for further cuts – this change would be a direct FX influence as it will continue to make the EUR a carry trade funding source over the short term as it force funds into the system.
Across the Atlantic however the Fed has (as expected) closed down speculation that it was on the verge of cutting rates. The fact Chairman Powell referred to inflation concerns as ‘transient’ rather than ‘persistent’ means the Fed’s dual-mandate of full employment and inflation at 2% has not broken down enough to cause a cut trigger. In fact, the Fed I believe has no intention of cutting rates in the coming 6 months unless some seriously untoward eventuates – EURUSD reaction to this news can been seen here:
(Source Refinitiv)
Thus the trade: Target: Expect EUR/USD grind lower over the coming 3 months looking to target $1.10 as the central bank differential develops further. Entry: at or above $1.12 Stop: $1.13
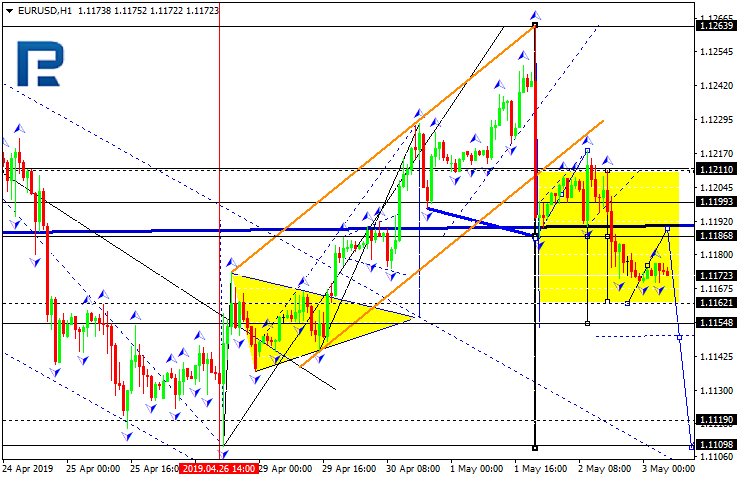
EURUSD is still forming the second descending impulse. Today, the pair may reach 1.1162 and then start another growth towards 1.1188. After that, the instrument may form a new descending structure with the short-term target at 1.1154.
GBPUSD, “Great Britain Pound vs US Dollar”
GBPUSD is still forming the second descending impulse. Possibly, today the pair may reach 1.2992 and then form one more ascending structure towards 1.3033. After that, the instrument may start a new decline with the short-term target at 1.2977.
USDCHF, “US Dollar vs Swiss Franc”
USDCHF is consolidating around 1.0185. Today, the pair may break the range upwards and then resume growing with the target at 1.0245.
USDJPY, “US Dollar vs Japanese Yen”
USDJPY is consolidating around 111.44. Possibly, today the pair may form one more ascending structure to reach 111.44 and then resume falling with the target at 110.70.
AUDUSD, “Australian Dollar vs US Dollar”
AUDUSD has completed another descending structure. Today, the pair may consolidate around 0.6996. Possibly, the price may grow towards 0.7033 and then trade downwards to break 0.6955. After that, the instrument may continue trading inside the downtrend with the target at 0.6925.
USDRUB, “US Dollar vs Russian Ruble”
USDRUB has broken 64.85 and reached 65.47. Possibly, today the pair may fall to return to 64.85 and start a new growth towards 66.02. After that, the price is expected to resume trading inside the downtrend with the target at 63.03.
XAUUSD, “Gold vs US Dollar”
Gold has completed another descending impulse. Possibly, today the pair may be corrected towards 1274.28 and then start another decline with the target at 1261.40.
BRENT
Brent has broken 71.60 and reached 70.30. Today, the pair may start a new growth with the target at 71.61. Later, the market may form a new descending structure towards 70.10 and then resume trading inside the uptrend to reach 73.73.
Attention! Forecasts presented in this section only reflect the author’s private opinion and should not be considered as guidance for trading. RoboForex LP bears no responsibility for trading results based on trading recommendations described in these analytical reviews.
As we can see in the H4 chart, after reaching the retracement of 38.2%, BTCUSD is trading upwards. However, the pair may yet resume falling toward the retracements of 50.0%, 61.8%, and 76.0% at 4753.00, 4538.00, and 4286.00 respectively. But if the price breaks the high at 5643.80, the instrument may grow to reach the post-correctional extension area between the retracements of 138.2% and 161.8% at 5918.00 and 6085.00 respectively.
In the H1 chart, the uptrend has reached the retracement of 76.0%. At the same time, there is a divergence on MACD, which may indicate a new pullback towards the short-term correctional retracement of 50.0% at 5284.00.
ETHUSD, “Ethereum vs. US Dollar”
As we can see in the H4 chart, the divergence made ETHUSD start a new correctional downtrend, which may break the low at 146.70 and then continue falling. The downside target is the retracement of 50.0% at 134.07.
In the H1 chart, ETHUSD is being corrected upwards and has already reached the retracement of 50.0%. The next upside targets may be the retracements of 61.8% and 76.0% at 165.34 and 169.66 respectively.
Attention! Forecasts presented in this section only reflect the author’s private opinion and should not be considered as guidance for trading. RoboForex LP bears no responsibility for trading results based on trading recommendations described in these analytical reviews.
Demand for USD remains high. The EUR/USD quotes updated the local minimums. Jerome Powell mentioned earlier that the regulator will keep the current monetary policy. This statement disproven the previous idea that the Central Bank is willing to review the lowering of the key interest rates. USD is additionally supported by the growth of the US Treasury obligations. The quotes are currently consolidating around 1.11600-1.11850. The investors are waiting for he US labour report
The Economic News Feed for 03.05.2019:
– Consumer Price Index (EU) – 12:00 (GMT+3:00);
– Labour Market Report (EU) – 15:30 (GMT+3:00);
– Business Activity in the US non-Industrial Sector (EU) – 17:00 (GMT+3:00);
The price fixed below 50 MA and 200 MA which points to the power of the buyers.
The MACD histogram is in the negative zone and keeps falling which gives a strong signal to sell EUR/USD.
The Stochastic Oscillator is in the neutral zone, the %K line is below the %D line which points to the bearish mood.
Trading recommendations
Support levels: 1.11600, 1.11400, 1.11200
Resistance levels: 1.11850, 1.12100, 1.12350
If the price fixes below 1.11600, expect further fescend toward 1.11200-1.11000.
Alternatively, the quotes can grow toward 1.12000-1.12300.
The GBP/USD currency pair
Technical indicators of the currency pair:
Prev Open: 1.30518
Open: 1.30276
% chg. over the last day: -0.13
Day’s range: 1.30152 – 1.30438
52 wk range: 1.2438 – 1.3631
GBP/USD started to descend after a long rally. The demand for USD has significantly grown. The Bank of England, as expected, kept the key monetary policy parameters at the same level. Right now GBP is consolidating. The key support and resistance levels are 1.30100 and 1.30450. The trading instrument can correct further. Keep an eye on the US labour report for April. You should open positions from the key levels.
At 11:30 the UK has published a business activity index in the Service industry.
The indicators do not provide precise signals, the price fixed between 50 MA and 200 MA.
The MACD histogram is in the negative zone and keeps falling which gives a strong signal to sell GBP/USD.
The Stochastic Oscillator is near the oversold zone, the %K line is below the %D line which also points to a bearish mood.
Trading recommendations
Support levels: 1.30100, 1.29750, 1.29400
Resistance levels: 1.30450, 1.30750, 1.31000
If the price fixes below 1.30100, expect further descend toward 1.29750-1.29500.
Alternatively, the quotes can grow toward 1.30700-1.31000.
This article reflects a personal opinion and should not be interpreted as an investment advice, and/or offer, and/or a persistent request for carrying out financial transactions, and/or a guarantee, and/or a forecast of future events.
The USD/CAD technical picture is ambiguous. CAD is consolidating around 1.34450-1.34750. An additional pressure is caused by agressive sales on the oil market. The US trading report for April is in the spotlight. You should open positions from the key levels.
The Economic News Feed for 03.05.2019 is calm.
The indicators do not provide precise signals: 50 MA started to cross 200 MA.
The MACD histogram is in the positive zone but below the signal line which gives a weak signal to buy USD/CAD.
The Stochastic Oscillator is in the neutral zone, the %K line is crossing the %D line. There are no signals at the moment.
Trading recommendations
Support levels: 1.34450, 1.34000, 1.33750
Resistance levels: 1.34750, 1.35000, 1.35200
If the price fixes above 1.34750, consider selling USD/CAD. The price will move toward 1.35200-1.35500.
Alternatively, the quotes can fall toward 1.34200-1.34000.
The USD/JPY currency pair
Technical indicators of the currency pair:
Prev Open: 111.380
Open: 111.488
% chg. over the last day: +0.09
Day’s range: 111.407 – 111.542
52 wk range: 104.97 – 114.56
USD/JPY keeps consolidating. There is no defined trend. The trading instrument is testing the local support and resistance levels at 111.400 and 111.650. The market participants are waiting for additional drivers. Keep an eye on the US Treasury bonds’ yield. You should open positions from the key levels.
The Japanese markets are closed due to holidays.
The indicators do not provide precise signals: the price fixed between 50 MA and 200 MA
The MACD histogram is close to 0.
The Stochastic Oscillator is in the neutral zone, the %K line is crossing the %D line. There are no signals at the moment.
Trading recommendations
Support levels: 111.400, 111.100
Resistance levels: 111.650, 111.900, 112.150
If the price fixes below 111.400, expect further descend toward 111.000.
Alternatively, the quotes can grow toward 111.900-112.150.
The US dollar continued to strengthen against a basket of major currencies after the Fed announced that it did not plan to consider the issue of lowering interest rates in the near future. Fed Chairman, Jerome Powell, said that the regulator did not see compelling reasons to increase or decrease the interest rate. The Fed believes that the slowdown in inflation and consumer demand in the first quarter were temporary. In fact, Powell did not agree with the demands by US President, Donald Trump, to reduce the interest rate. The dollar index (#DX) closed in the positive zone (+0.18%). Investors have taken a wait-and-see attitude before the publication of a report on the US labor market for April.
As expected, the Bank of England left the interest rate unchanged at 0.75% yesterday. The regulator also made it clear that the market underestimated the prospects for raising rates in the next three years. The base rate will probably be raised only once – up to 1% – by 2021. However, the Bank of England Governor, Mark Carney, believes that more than one interest rate increase may be needed. The Central Bank lowered inflation forecasts for 2019 and 2020, but kept the forecast for 2021.
The “black gold” prices significantly decreased after it became known that oil production in the US reached a new record high of 12.3 million barrels per day. At the moment, futures for the WTI crude oil are testing the mark of $61.70 per barrel.
Market Indicators
Yesterday, the bearish sentiment was observed in the US stock market: #SPY (-0.22%), #DIA (-0.48%), #QQQ (-0.43%).
The 10-year US government bonds yield is recovering. Currently, the indicator is at the level of 2.55-2.56%.
The news feed on 2019.05.03:
– UK services PMI at 11:30 (GMT+3:00); – Eurozone consumer price index at 12:00 (GMT+3:00); – Labor market statistics in the US at 15:30 (GMT+3:00); – ISM non-manufacturing PMI at 17:00 (GMT+3:00).