On Thursday the 2nd of May, trading on the euro closed down. The US dollar made gains against most of the world’s major currencies. The greenback was boosted by comments from Fed Chair Jerome Powell regarding inflation. He said that the factors currently lowering inflation are probably temporary, and so there’s no need to lower interest rates. According to the futures market on interest rates, the probability of a rate hike this year is 47%.
The pound dropped after the BoE meeting. The central bank revised its GDP figures upwards while downgrading inflation figures. The regulator is in no hurry to raise interest rates amid unease as Brexit talks continue.
Day’s news (GMT+3):
11:30 UK: Markit services PMI (Apr).
12:00 Eurozone: CPI (Mar), PPI (Mar).
15:30 US: unemployment rate (Apr), nonfarm payrolls (Apr), average hourly earnings (Apr), average weekly hours (Apr), labor force participation rate (Apr).
16:45 US: Markit services PMI (Apr).
17:00 US: ISM non-manufacturing PMI (Apr).
20:00 US: Baker Hughes US oil rig count.
Current situation:
Yesterday’s expectations were met in full. The pair rose to the 22nd degree before dropping below the 67th degree. At the time of writing, the euro is trading at 1.1168 against the dollar. In the Asian session, the bears shifted yesterday’s low to 1.1167. The immediate target is 1.1159.
There’s no forecast on today’s chart because the payrolls report comes out at 15:30 (GMT+3). It’s expected that the US economy added 181k jobs last month, and that the unemployment rate will remain at 3.8%.
I don’t think that this month’s NFP report will be particularly interesting for markets following the FOMC meeting. Jerome Powell said at his press conference that the Fed isn’t planning to change interest rates either way.
In the hunt to find asset classes and/or sectors that are ripe to provide multi-year, multi-bagger opportunities, with the potential to outperform the major indices. It helps if you can find an investment that has been decimated from a massive boom, more recently has gone through a number of years of recent pains and for investors, and with only a few investors still paying attention to it.
Commodities as a whole, are one of the few assets today that meets the criteria of providing long-term value opportunities early in a cycle:
Being decimated from a boom.
Few investors pay attention to it = Unloved and Under owned.
Money has been slowly coming back into commodities.
New discoveries are being made in materials and energy but only niche investors are paying attention.
Since the commodity the washout in 2015, the Bloomberg Commodity Index is up only 14% from the lows of 2015. This is a far cry from the index generating a 222% return in the past commodities bull market.
PAST BOTTOMS IN COMMODITIES
When we look at the Bloomberg Commodity Index today versus in past cycles, we can see that there are a number of similarities to the past cycle
Tech Bubble in 2000 to Today
Flight to non-earnings generating IPOs is higher than in the 2000 bubble
Accelerating twin deficits in the U.S.
Bloomberg Commodity Index hits lows in the current cycle similar to the bottom in 1999.
The peak in U.S. Dollar Cycle.
QE Bubble in the 1930s to Today
S. Federal Reserve QT Tightening causes problems in the markets after a multi-year low-interest rate environment.
Rise in Populism in the 1930s.
HOW TO PLAY THE COMMODITY BOOM
In the Bloomberg Commodity Index, there are 6 types of commodities in the basket and a total of 23 types of commodities that are in the index. As the commodities cycle unfolds in the coming years, we would expect as a whole, the basket will lift all commodities in the index, with some doing better than other over the course of the cycle. In the last commodity cycle, energy and precious metals outperformed the index. Will they repeat the same outperformance to the index this time around? Time will tell. Oil (Crude Oil & Brent) and natural gas are the top of being the most consumed commodities in terms of dollar value. In order to get the commodities benchmark moving, we would expect energy to lead the way followed by grains.
The Biggest Venture Space for Commodity Stocks is Still Early
When we look at the S&P/TSX Venture Composite, the largest index in the world that focuses on venture capital type companies related to commodities (exploration, development, production) is up only a paltry 25.5% from the 2015 lows. This includes a boost from cannabis stocks, which the index classifies as Healthcare, which has been popular in the past few years. One could say that many of these cannabis stocks are basically farmers that grow cannabis, which you could put them in the agriculture space, and the larger commodity asset classes. This makes the index having commodity exposure on the low 55.8% (Energy (16.5%) and Materials (39.3%)), potentially as high of 75.5% if we include a basket of the healthcare cannabis stocks. But not all health care stocks are cannabis related, so the commodities exposure isn’t up to the full 75.5%.
COMMODITY PRICES STILL WELL OFF THE LAST HIGHS
Prices of major commodities are at the low end of their price ranges over the past 10 years. If we take a 20-year historical time horizon, commodity prices would be down even further as many of the commodities peaked in 2007 and 2008.
WHAT FACTORS COULD DRIVE HIGHER COMMODITY PRICES?
What catalysts could we see as we go down the list of key commodity classifications that will spark higher prices? Much will be focused on the supply and demand fundamentals.
ENERGY – (Oil & Natural Gas)
Oil and natural gas disruptions
Geopolitical events in the Middle East, Africa, and/or South America reduces supply.
Canadian energy projects get delayed even as energy prices rise.
Weather causes increased demand for natural gas in North America and Europe.
Accelerated natural gas demand growth from Asia.
AGRICULTURE – Grains, Softs, & Livestock
Weather-related issues that impact crop planting and/or harvesting.
Drier conditions that reduce crop growth.
Pest issues, where pests become resilient to crop pesticides and herbicides.
Higher feed prices because of supply issues, resulting in higher livestock prices.
Livestock diseases that reduce the size of herds.
INDUSTRIAL METALS
Demand growth for copper and nickel because of increased usage of these metals in electric vehicle production by the large auto manufacturers and new EV only manufactures
PRECIOUS METALS
Demand from central bank purchases.
Commercial banks allowed to count gold as part of their reserve calculation.
US DOLLAR CYCLE
A weaker US because of accelerating US twin deficits will push the commodity cycle higher in the coming years.
Commodities present a rare risk-reward situation for those investors that are willing to hold on because it will take 2-3 years to generate multi-bagger returns. There will be numerous commodities that investors will be able to choose, and we suggest investors focus on the 2-3 commodities that you know best, otherwise buy the basket of commodities. Great fortunes have been made if you identify the commodities cycle correct, and when looking at the FMC Commodity Hype Cycle, we are in the early stages of the commodity cycle. With interest in commodities well off from the highs set in 2008, when the last boom peaked.
Commodities Are the Big Winners If Inflation is Dead.
What we know as of today:
A few commodities since the washout in 2015 have made huge moves since then (Palladium, Cobalt, Lithium). These few commodities have started to bring back capital to commodities.
The Bloomberg Commodity Index is not even up 25% from the lows set in 2015.
Most commodities are down between 50-90% from their highs set in the last commodity cycle.
Investor interest in commodities is down from the highs of 2008 but increasing from the lows in 2017 (See Google Trends Chart) = Unloved and under-owned.
New world-class deposits in both mining and energy are being discovered reigniting interest in the sector.
The political backlash against commodities makes them even more hated, because of climate change concerns, which could delay new supply coming online.
With calls for inflation being dead, this may be the bottom of inflation, which commodities end up being big winners.
Paul Farrugia, BCom. Paul is the President & CEO of First Macro Capital. He helps his clients take advantage of cycle opportunities across all sectors and asset classes, for the long-term. He provides a checklist to find winning gold and silver mining producer stocks, to take advantage of the commodity cycle.
Disclaimer:
The information contained herein is obtained from sources believed to be reliable, but its accuracy cannot be guaranteed. It is not designed to meet your financial situation – we are not investment advisors, nor do we give personalized investment advice. The opinions expressed herein are those of the publisher and are subject to change without notice. It may become outdated, and there is no obligation to update any such information.
As the spotlight has been on Japan’s new Emperor Naruhito, the economy is coping with half a decade of Abenomics, monetary injections, huge debt – and a proposed sales tax that could make things a lot worse by the fall.
Ever since Shinzo Abe started his second stint as Prime Minister, Japan has focused on positive economic signals, which has sparked futile hopes, including a bad sales tax proposition.
Japanese officials vow to stick to the planned tax hike in October (it has been delayed twice), barring a big economic shock. With the 2019 budget, Abe hopes to offset adverse impact of the sales tax by returning much of the extra revenue to consumers via $18 billion of offsetting measures, instead of faster debt-reduction.
But recently, the Cabinet downgraded its headline economic assessment for the first time in three years. Manufacturing, housing and retail indicators reflect signs of weakness, while first-quarter figures, expected in May, could show a contraction – especially as the impact of Trump’s tariff wars is spreading in Asia,.
Half a decade of Abenomics
In December 2012, when the Liberal Democratic Party returned to leadership, Abe campaigned on renewed fiscal stimulus, aggressive monetary easing and structural reforms. The devaluation of the yen, critical to Japanese exporters, was the tacit denominator of the proposed changes.
In addition to a huge liquidity risk, Tokyo took another risk in timing, as I argued then. It sought to implement the fiscal stimulus in 2013, while consolidation would follow. Obviously, unease increased in 2014. As Abe went ahead with the sales tax hike that spring, it triggered a sharp slump. Instead of strong expansion, consumers were hit hard and Japan began its third lost decade.
Yet, recently, international observers have been remarkably optimistic. Last November, the International Monetary Fund (IMF) reported Japan has had an “extended period of strong economic growth.”
As the growth rate, supported by huge monetary injections and rapidly-rising debt, increased to 1.9 percent in the fourth quarter of 2018, upgraded from preliminary data, and inflation seemed to be strengthening in early fall, the Abe administration began to flirt with another tax hike, again. “The sales tax hike to 10 percent is needed the most to secure stable financial resources to pay for social security for all generations,” says Finance Minister Taro Aso.
That is a pipe-dream. Huge monetary injections and rapidly-rising debt will undermine Japan’s economic future.
Excessive monetary injections
More than half a decade ago, the new governor of Bank of Japan (BoJ), Haruhiko Kuroda, pledged to do “whatever it takes” to achieve the 2 percent inflation target. Under his reign, the BoJ boosted quantitative and qualitative easing with negative interest rate policy.
In 2018, BoJ’s bond and stock holdings topped 100 percent of GDP. Now the BoJ is adjusting the pace of bond purchases so that its holdings would not surpass 50 percent of the GDP, which is seen to herald the eclipse of monetary accommodation.
In 2018, foreigners held an all-time high of 12 percent share of outstanding debt, yet most debt is in Japanese hands and in yens. In turn, falling rates in the U.S. and elsewhere have made Japanese bonds attractive, as long as their yields are not expected to fall much because of BoJ policy.
But times may be changing. At year-end 2018, the BoJ reduced slightly its holdings to 43 percent of all issued Japanese government bonds. It was the first quarterly fall in almost seven years. In the past five years, Japan’s government debt has climbed to 255% to GDP. As long as interest rates remain ultra-low, servicing it is affordable. But nothing lasts forever.
Moreover, the original target – sustained 2 percent inflation – has proved elusive and some argue that the BoJ’s purchases of exchange-traded funds (ETFs) are distorting the stock market.
Toward the defining moment
Japan faces more urgently the same dilemma that today burdens most advanced economies: How to support high living standard with low or no growth?
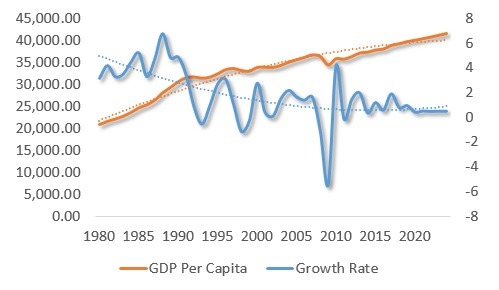
In the past three decades, Japanese living standard has increased from over $30,000 to nearly $45,000. Yet, Japan’s trend growth has plunged from 5 percent to less than 0.5 percent – over 90 percent (Figure).
FigureThe Japanese Dilemma
GDP per capita: Gross domestic product per capita, constant prices (PPP); 2011 international dollars. Growth Rate: Gross domestic product, constant prices, percent change. Trend: Dashed lines
Source: IMF/WEO Database, April 2019.
Nevertheless, the Organization for Economic Cooperation and Development (OECD), the advanced economies’ think-tank, is urging Japan to triple its tax to 26 percent to achieve a large primary surplus, by spending cuts, tax increases and curbing healthcare services. In reality, such austerity could derail remaining support structures for growth, inflation and average prosperity in Japan.
Japan is the first advanced economy in secular stagnation, but others remain in the same path. Penalizing the remaining middle-classes and working people, while sustaining the kind of privatization, liberalization and deregulation, which led to the income gap in the first place, is foolish.
To resolve structural challenges, a more realistic program is required to ensure fiscal sustainability, while raising productivity and reducing all unnecessary barriers to employment. But that’s only a start.
Japan needs a national drive to reduce its gender income gap (it ranks110th in the 2018 Gender Gap Index) and another to attract far more immigrants (with faster naturalization). In both cases, a change of magnitude is needed; policy nibbling will go nowhere. And instead of rearmament, militarization and conflicts, Japan needs accelerated job-creation, economic development and regional cooperation.
As the world’s third-largest economy and the second-largest debt market, Tokyo’s future choices will have repercussions across the world – in good and bad.
About the Author:
Dr Steinbock is the founder of the Difference Group and has served at India, China, and America Institute (USA), Shanghai Institutes for International Studies (China) and the EU Center (Singapore). For more information, see http://www.differencegroup.net/
The original version was released by South China Morning Post on May 1, 2019.
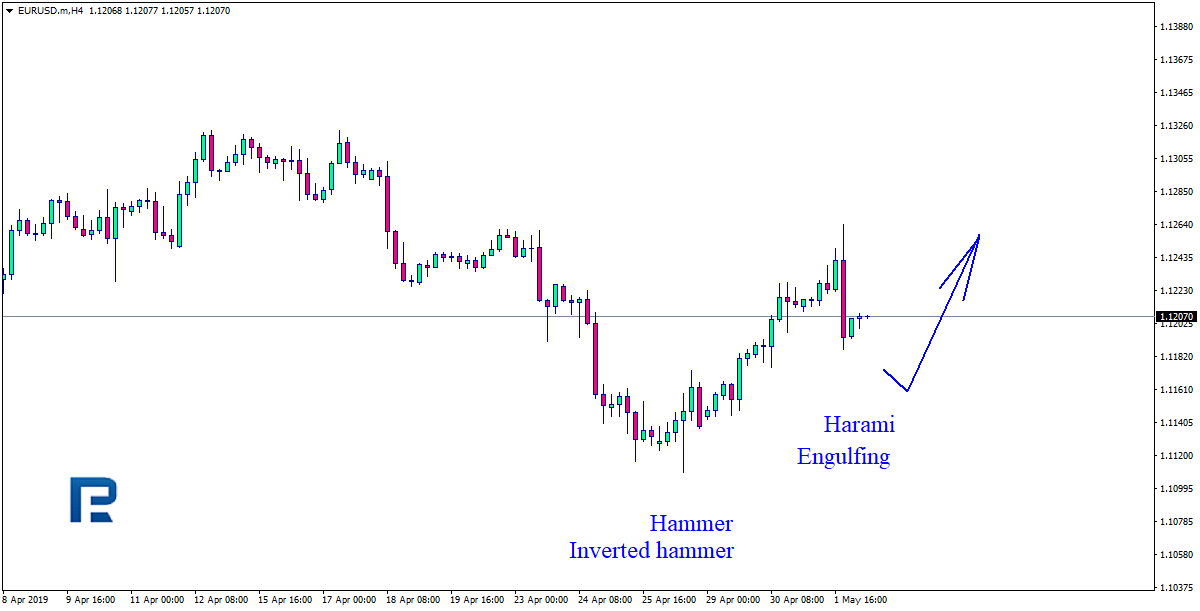
As we can see in the H4 chart, EURUSD has rebounded from the support level; right now, it is forming another correction with Engulfing and Harami reversal patterns. Judging by the previous movements, at the moment it may be assumed that the instrument may resume moving to the upside.
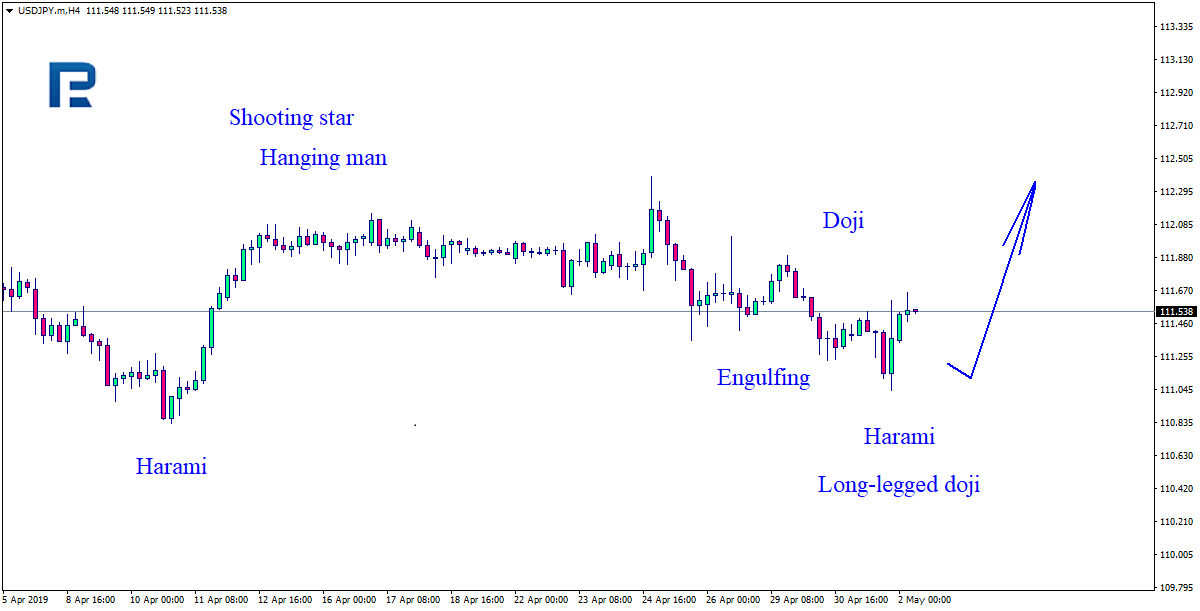
USDJPY, “US Dollar vs. Japanese Yen”
As we can see in the H4 chart, USDJPY is still trading sideways close to the resistance level and forming Doji, Long-Legged Doji, and Harami reversal patterns. Judging by the previous movements, at the moment it may be assumed that after completing its sideways movement the instrument may continue its ascending tendency.
Attention! Forecasts presented in this section only reflect the author’s private opinion and should not be considered as guidance for trading. RoboForex LP bears no responsibility for trading results based on trading recommendations described in these analytical reviews.
Along with Bitcoin’s fall from grace in 2018, the other bad-luck story of the previous year must surely have been the fate of the beleaguered binary option. Once the remit of the savvy OTC trader, this financial instrument was abused by scammers to the point where British authorities have proposed a blanket ban. And despite the current war being waged by the UK and the rest of Europe over trade tariffs and other financial complications of Brexit, it seems that the EU may be set to follow the UK with their own total binary option ban.
Following the decision by the European Securities and Markets Authority, ESMA, to put a temporary restriction on the trading of binary options, it appears that, taking a lead from the Financial Conduct Authority (FCA) in the UK, the EU may also push for a total ban on trading binary options. Binary options comprise an open bet on whether the price of a share, currency, commodity, or an index will go up or down within a specified period of time.
ESMA had halted trading in the derivative instrument on a number of occasions, but various forces had prevented the authority from pushing for a complete ban. According to the Markets in Financial Instruments Regulation (MiFIR), ESMA was only obliged to enforce three-month bans on the trading of questionable commodities.
In addition to the ban on binary options, the FCA has also proposed a ban on the Contracts for Differences, or CFDs. These contracts operate in a similar fashion to binary options in that the seller is contracted to pay the buyer the difference between the current and future value of a particular asset. If the difference is negative, then the buyer pays the difference to the seller. Originally developed in London in the 1990s as a legitimate method of position hedging, CFDs quickly became popular as a way for non-professionals to place quick bets on the market direction of a broad range of financial assets. The CFD’s fall from favor began in 2009 when the instruments were used in place of underlying stock as a means of hiding them from standard disclosure rules relating to insider trading. In addition to its ban on binary options trading, the UK’s FCA has also imposed a broad range of restrictions on the trading of CFDs.
The measures proposed by the FCA in late March are essentially identical to those that have already been put in place by ESMA, but with the restrictions becoming permanent and not open to further legislation. Following the FCA decision, it is only a matter of time before ESMA will follow suit and make its own ban on binary options permanent. While ESMA’s decision is by no means automatic, it does look likely that they will vote to ban binary options trading. This will still leave the trading of CFD a legitimate mechanism, which will likely boost trading in that financial instrument. However, as the scams are likely to continue, it would be surprising if CFDs were also not ultimately banned from trading on Continental Europe.
About the Author:
AmramMargalit is a professional writer who has worked in a wide range of settings, including technology companies, nonprofits, and the entertainment industry. Within these positions, Amram has provided quality content and advertising services and is currently the Content Manager at Leverate.
The US Federal Reserve announced today they are leaving rates unchanged based on their latest meeting. The markets should take this as a sign of relief. Yet, hear all-time highs and expecting the Fed may actually decrease rates a bit, the market reacted with quiet price rotation near these highs.
The US Fed could have shaken up the markets even more, but we believe this move by the Fed will be interpreted as “Fed Uneasiness” with regards to the overall US and global economy at the moment. A failure to prompt a rate increase could be seen as weakness by the Fed and uneasiness over the fragility of the US and Global economies. Once this shake-out settles, the markets will go back to doing what the markets always do – interpreting future fair values.
The $INDU rotated much lower today, ending the day almost exactly at a key support channel level (the YELLOW line). Further price weakness could push the $INDU below $26,000 fairly easily if the current high price level is fragile and weak. Price rotation is one of the most basic aspects of all price activity. The price must rotate in order to establish new price highs or lows. As volatility decreased over the past 30+ days, it would not be unexpected to see price retest the $26,000 level, or lower, in an attempt to resume a price trend or re-establish price support before attempting another move higher.
The move in the NQ today was much broader than the move in the $INDU. The Technology heavy NASDAQ 100 rotated downward, below the historical price support channel, and is currently resting just above the previous all-time price high near $7724. Again, the Fed’s inaction may be interpreted as an expectation of market weakness over the next few months. Thus, traders reacted to this move by interpreting this weakness in the Fed to raise rates by selling.
Overall, leaving rates unchanged may be very healthy for the US and global economies. The US Dollar continues to strengthen and this shake-out may be just what is needed before the Summer season for the price to continue trending.
We’ve recently warned that the US major Indexes are nearing our Fibonacci upside price targets and that we believe the upside price move may continue for another 20+ days still. This current rotation may be very short-lived – possibly only 5~10 days of lower/sideways price action before trends resume an upside price bias. Time will tell.
Overall, our prediction that a shake-out was about to happen appears to be unfolding just days after we made the claim. Our longer-term analysis is still the same – continued upside price bias as earnings and fundamentals drive prices closer to our Fibonacci price targets before any bigger price reversal may set up sometime in July/Aug 2019.
UNIQUE OPPORTUNITY
First, we typically see stocks sell-off and as the old saying goes, “Sell in May and Go Away!”
So what does this mean? It means we should start to see money flow into the safe-haven assets like the Utility sector, bonds, and most importantly precious metals.
Second, my birthday is this month, and I think its time I open the doors for a once a year opportunity for everyone to get a gift that could have some considerable value in the future.
For May I am going to give away and ship out silver rounds to anyone who buys a 1-year, or 2-year subscription to my Wealth Trading Newsletter for the first 25 subscribers. You can upgrade to this longer-term subscription or if you are new, join one of these two plans, and you will receive:
1-Year Subscription Gets One 1oz Silver Round FREE (Could be worth hundreds of dollars)
2-Year Subscription Gets TWO 1oz Silver Rounds FREE (Could be worth a lot in the future)
I only have 25 silver rounds I’m giving away so upgrade or join now before its too late!
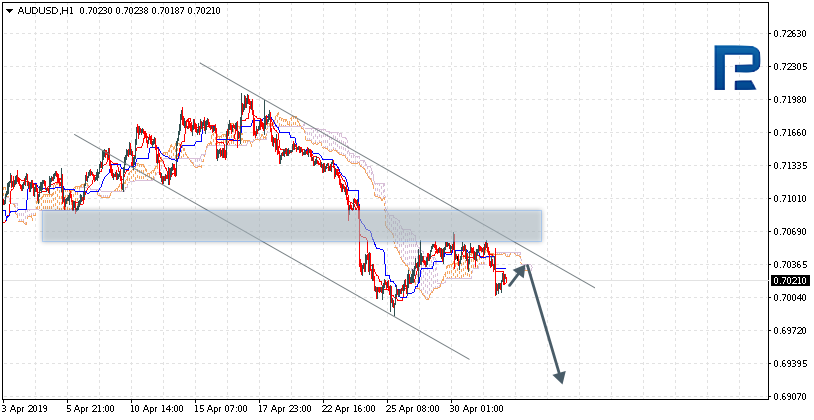
AUDUSD is trading at 0.7021; the instrument is moving below Ichimoku Cloud, thus indicating a descending tendency. The markets could indicate that the price may test the downside border of the cloud at 0.7035 and then resume moving downwards to reach 0.6925. Another signal to confirm further descending movement is the price’s rebounding from the channel’s upside border. However, the scenario that implies further decline may be cancelled if the price breaks the upside border of the cloud and fixes above 0.7075. In this case, the pair may continue growing towards 0.7155.
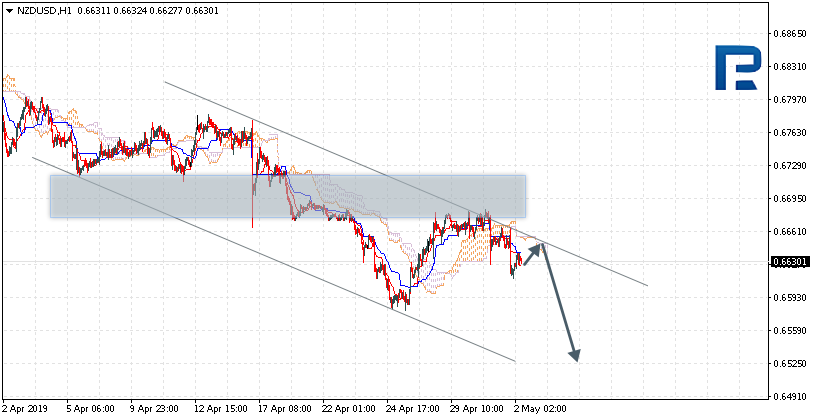
NZDUSD, “New Zealand Dollar vs US Dollar”
NZDUSD is trading at 0.6630; the instrument is moving below Ichimoku Cloud, thus indicating a descending tendency. The markets could indicate that the price may test the upside border of the cloud at 0.6640 and then resume moving downwards to reach 0.6525. Another signal to confirm further descending movement is the price’s rebounding from the channel’s upside border. However, the scenario that implies further decline may be cancelled if the price breaks the upside border of the cloud and fixes above 0.6690. In this case, the pair may continue growing towards 0.6775.
USDCAD, “US Dollar vs Canadian Dollar”
USDCAD is trading at 1.3435; the instrument is moving above Ichimoku Cloud, thus indicating an ascending tendency. The markets could indicate that the price may test the downside border of the cloud at 1.3425 and then resume moving upwards to reach 1.3555. Another signal to confirm further ascending movement is the price’s rebounding from the support level. However, the scenario that implies further growth may be cancelled if the price breaks the downside border of the cloud and fixes below 1.3390. In this case, the pair may continue falling towards 1.3305. After breaking the “neckline” of the Head & Shoulders reversal pattern and fixing above 1.3465, the price may continue moving upwards.
Attention! Forecasts presented in this section only reflect the author’s private opinion and should not be considered as guidance for trading. RoboForex LP bears no responsibility for trading results based on trading recommendations described in these analytical reviews.
EUR/USD retreated from the local maximums. The demand for USD has grown after the comments by the Federal Reserve. The regulator saved the key interest range at the previous 2.25-2.50%. Central Bank noted a stable economy growth, the labour market stability and optimistic expectations regarding the inflation. Right now the quotes are consolidating around 1.11850-1.12100. The trading instrument has a tendency for further correction. You should open positions from the key levels.
The Economic News Feed for 02.05.2019:
– Industrial PMI (GER) – 10:550 (GMT+3:00);
– Number of Primary Jobless Claims (US) – 15:30 (GMT+3:00);
The indicators do not provide precise signals, the price has crossed 50 MA and 200 MA.
The MACD histogram is in the negative zone and below the signal line which gives a strong signal to sell EUR/USD.
The Stochastic Oscillator is in the neutral zone, the %K line is below the %D line which points to the bearish mood.
Trading recommendations
Support levels: 1.11850, 1.11600, 1.11400
Resistance levels: 1.12100, 1.12350, 1.12600
If the price fixes below 1.11850, expect further correction toward 1.11600-1.11400.
Alternatively, the quotes can grow toward 1.12350-1.12600.
The GBP/USD currency pair
Technical indicators of the currency pair:
Prev Open: 1.30284
Open: 1.30518
% chg. over the last day: +0.15
Day’s range: 1.30383 – 1.30691
52 wk range: 1.2438 – 1.3631
GBP/USD is in an overall bullish mood. The demand for GBP is supported by the positive results of Theresa May’s negotiations with the main opposition party. Right now GBP/USD is consolidating around 1.30350-1.30750 range. The investors are waiting for the Bank of England to announce the new key interest rate. It is expected that the regulartor will keep the current monetary policy at the previous levels. Keep an eye on the Central Bank’s comment and rhetorics and open positions from the key levels.
The Economic News Feed for 02.05.2019 is calm.
The price fixed above 50 MA and 200 MA which points to the power of the buyers.
The MACD histogram is in the positive zone but below the signal line which gives a weak signal to buy GBP/USD.
The Stochastic Oscillator is in the neutral zone, the %K line is above the %D line which points to the bullish mood.
Trading recommendations
Support levels: 1.30350, 1.30000, 1.29600
Resistance levels: 1.30750, 1.31000
If the price fixes above 1.30750, expect further growth toward 1.31250-1.31400.
Alternatively, the quotes can correct toward 1.30000.
This article reflects a personal opinion and should not be interpreted as an investment advice, and/or offer, and/or a persistent request for carrying out financial transactions, and/or a guarantee, and/or a forecast of future events.
USD/CAD has been very active the last couple of days. There is no defined trend. Right now CAD is consolidating around 1.34200-1.34500. The trading instrument has a tendency to fall. Keep an eye on the oil quotes dynamics and open positions from the key levels.
The Economic News Feed for 02.05.2019 is calm.
The indicators do not provide precise signals, 50 MA has crossed 200 MA.
The MACD histogram is in the positive zone but below the signal line which gives a weak signal to buy USD/CAD.
The Stochastic Oscillator is in the neutral zone, the %K line has crossed the %D line. There are no signals at the moment.
Trading recommendations
Support levels: 1.34200, 1.33900, 1.33650
Resistance levels: 1.34500, 1.34750, 1.35150
If the price fixes above 1.34500, consider buying USD/CAD. The movement will tend toward 1.34750-1.35000.
Alternatively, the quotes can descend toward 1.33900-1.33700.
The USD/JPY currency pair
Technical indicators of the currency pair:
Prev Open: 111.414
Open: 111.380
% chg. over the last day: -0.03
Day’s range: 111.350 – 111.665
52 wk range: 104.97 – 114.56
USD/JPY has an ambiguous technical picture. The trading instrument is consolidating. The USD/JPY quotes are testing the local support and resistance levels at 111.350 and 111.650. The investors are waiting for additional drivers. The demand for the USD remains high after the Federal Reserve comments. You should open positions from the key levels.
The Economic News Feed for 02.05.2019 is calm. The markets are closed due to the national holiday.
The indicators do not provide precise signals, the price fixed between 50 MA and 200 MA.
The MACD histogram is in the positive zone and above the signal line which gives a strong signal to buy USD/JPY.
The Stochastic Oscillator is in the positive zone and above the signal line which indicates a bearish mood.
Trading recommendations
Support levels: 111.350, 111.100
Resistance levels: 111.650, 111.900, 112.150
If the price fixes below 111.350, expect the quotes to fall toward 111.000.
Alternatively, the quotes can grow toward 111.900-112.150.
The US dollar recovered some of its losses against a basket of major currencies. Yesterday, the Fed, as expected, kept the range of the key interest rate at the same level of 2.25-2.50%. The Central Bank noted the steady growth of the economy, the stability of the labor market and optimistic expectations regarding the acceleration of inflation. The dollar index (#DX) closed in the positive zone (+0.22%).
In addition, important economic data from the UK and the US were published yesterday. Thus, the UK manufacturing PMI counted to 53.1 in April, while experts expected 53.2. ADP nonfarm employment change increased to 275K in April, although investors forecasted 181K. However, ISM manufacturing PMI dropped to 52.8 in April instead of 55.0. Today, financial market participants took a wait-and-see attitude before the Bank of England interest rate decision. It is expected that the regulator will leave the rate at the same level of 0.75%.
The “black gold” prices are consolidating. At the moment, futures for the WTI crude oil are testing the mark of $63.35 per barrel.
Market Indicators
Yesterday, there was the bearish sentiment in the US stock market: #SPY (-0.75%), #DIA (-0.62%), #QQQ (-0.32%).
The 10-year US government bonds yield is recovering. Currently, the indicator is at the level of 2.52-2.53%.
The news feed on 05.02.2019:
– German manufacturing PMI at 10:55 (GMT+3:00); – UK construction PMI at 11:30 (GMT+3:00); – Bank of England interest rate decision at 14:00 (GMT+3:00); – Initial jobless claims in the US at 15:30 (GMT+3:00).
On Wednesday the 1st of May, trading on the euro closed down. With low market liquidity due to May Day celebrations taking place across Europe, the day turned out to be very volatile.
Ahead of the FOMC’s interest rate decision, the euro rose to 1.1250 on the back of strong Eurozone GDP figures for Q1, as well as a German inflation report for April. The dollar’s decline then gathered pace after a weak ISM manufacturing PMI in the US for April, which fell short of expectations, posting its lowest value since November 2016. This increased nerves ahead of the FOMC meeting.
The FOMC decided to keep interest rates within their current range of 2.25% – 2.5%. This decision was unanimous among all FOMC members. The next meeting in penciled in for the 18th – 19th of June. The euro continued its rise to reach 1.1265 before dropping to 1.1188.
The dollar rose across the board in response to Fed Chair Jerome Powell’s remarks that the regulator doesn’t see any strong arguments either way in terms of changing interest rates.
20:30 Germany: German Buba President Weidmann speech.
Current situation:
The drop from 1.1265 amounted to 67 degrees. The pair broke through the trend line at 1.1219 before breaking out of the upwards channel made up of higher highs. The euro is currently trading 0.13% up at 1.1208.
What can we expect after the dollar’s rise overnight? I see two potential scenarios.
Scenario 1: a rebound from the 22nd degree with a subsequent drop below the 67th degree to 1.1180. The 22nd degree is right next to the LB. The rebound from here will tell us pretty much what to expect from the US session. The pair is rising without volume at the moment, which increases bearish sentiment.
Scenario 2: a slow price recovery below the lower boundary of the channel heading towards the 45th degree. Potentially a small decline as trading opens in Europe since the stochastic is looking down. If the pair stays around 1.12 for 12 hours, this signal will fade and buyers can continue towards 1.1230. The LB balance line will provide resistance.
I’m leaning more towards the first scenario. I can’t see the pair falling too far since a reversal model has been forming since the 18th of April that should see the pair rise above 1.13.
 Current situation: