Article By RoboForex.com
XAUUSD, “Gold vs US Dollar”
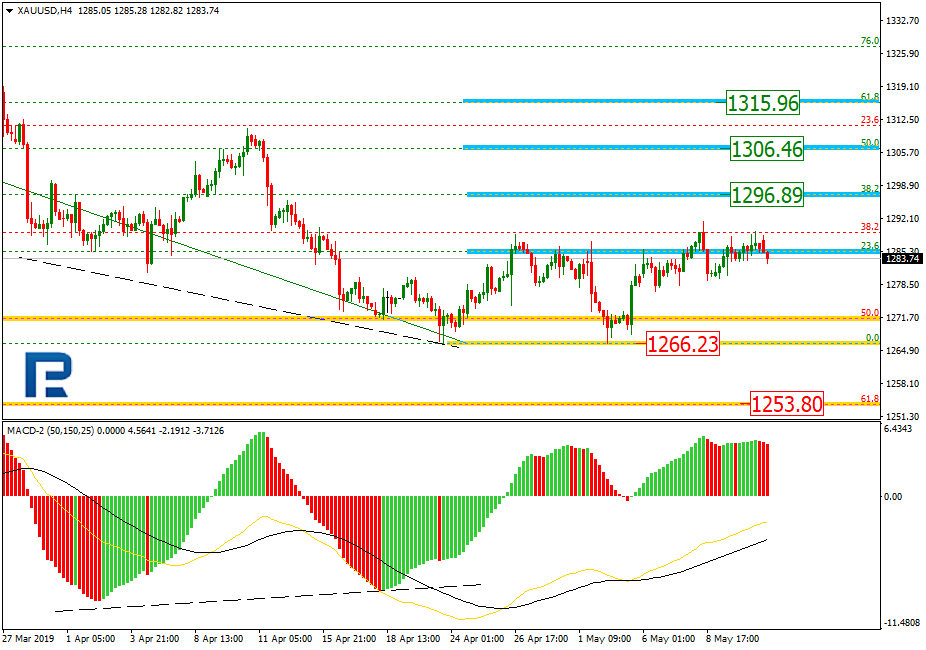
The H4 chart of XAUUSD shows the correction that started after the convergence. By now, it has already reached the retracement of 23.6%. The next upside targets may be the retracements of 38.2%, 50.0%, and 61.8% at 1296.89, 1306.46, and 1315.96 respectively. If the price breaks the low at 1266.23, the instrument may continue falling towards the mid-term retracement of 61.8% at 1253.80.

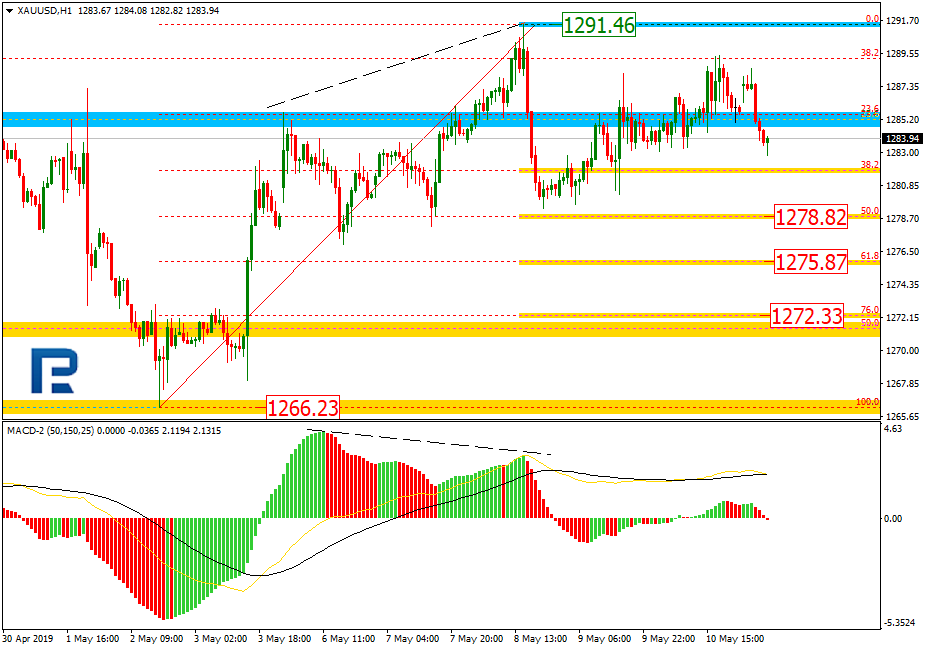
As we can see in the H1 chart, the divergence made the pair start a new short-term correction, which has already reached the retracement of 38.2%. The next downside targets may be the retracements of 50.0%, 61.8%, and 76.0% at 1278.82, 1275.87, and 1272.33 respectively. If the price breaks the high at 1291.46, the instrument may continue its mid-term correction.
USDCHF, “US Dollar vs Swiss Franc”
In the H4 chart, USDCHF is still trading downwards; it has already reached the retracement of 38.2%. The next downside targets may be the retracements of 50.0% and 61.8% at 1.0065 and 1.0025 respectively. After completing the correction and breaking the previous high at 1.0236, the instrument may continue growing to reach the post-correctional extension area between the retracements of 138.2% and 161.8% at 1.0246 and 1.0306 respectively.
Free Reports:
 Get Our Free Metatrader 4 Indicators - Put Our Free MetaTrader 4 Custom Indicators on your charts when you join our Weekly Newsletter
 Get our Weekly Commitment of Traders Reports - See where the biggest traders (Hedge Funds and Commercial Hedgers) are positioned in the futures markets on a weekly basis.

As we can see in the H1 chart, there is a divergence on MACD, which may indicate a possible pullback. The targets of this pullback may be the retracements of 23.6, 38.2%, and 50.0% at 1.0116, 1.0134, and 1.0149 respectively. The support is the low at 1.0087.

Article By RoboForex.com
Attention!
Forecasts presented in this section only reflect the author’s private opinion and should not be considered as guidance for trading. RoboForex LP bears no responsibility for trading results based on trading recommendations described in these analytical reviews.