Facebook’s jump into cryptocurrencies is another nail in the coffin for traditional banks, says the CEO of one of the world’s largest independent financial advisory organisations.
Nigel Green, the founder and chief executive of deVere Group, is speaking after the social media giant this week set out details of Libra, its own digital currency, to be launched next year.
Mr Green affirms: “Facebook’s launch into cryptocurrencies tells us two things.
“First, the role of traditional banks will decline at a quicker rate than many had previously predicted. Facebook’s Libra cryptocurrency will be able to transact across traditional payment rails. They have partnered with PayPal, Mastercard, Visa and Stripe, amongst others to fuel merchant acceptance of the digital currency.
“If you have cryptocurrency on these payment methods, the purpose of and use for traditional banks will surely shrink.
“Cryptocurrencies and fintech [financial technology] solutions are already taking business away from banks. They are filling a gap left by the traditional way of doing things as the world speeds up and becomes increasingly globalised and digitalised.
“The jump into cryptocurrencies – which are the future of money – by Facebook which already has 2.7 billion users can really only be seen as another nail in the coffin for banks.”
He continues: “Second, tech giants entering the cryptocurrency sector indicates that digital money, as a concept, is fully mainstream and inevitably the way the world is going. This is something we have been arguing for a long time now – despite protestations from financial traditionalists.
“Where Facebook leads, others will inevitably follow, and this will quicken the pace of mass adoption of cryptocurrencies.”
The deVere CEO concludes: “This is a major development in the crypto-verse and it is surely just the beginning. This is set to revolutionise how people access, manage and use money across the world and it will positively disturb the wider banking sector. Banking as we have known it until now is coming to an end.”
About:
deVere Group is one of the world’s largest independent advisors of specialist global financial solutions to international, local mass affluent, and high-net-worth clients. It has a network of more than 70 offices across the world, over 80,000 clients and $12bn under advisement.
EUR/USD stabilized after rapid growth. Right now the trending instrument is consolidating. The local support and resistance levels are 1.12700-1.13100. USD remains under pressure due to the dowish Fed policy. The regulator is willing to lower the rates at the next few meetings. Review several releases from the EU and the US and open positions from the key levels.
The Economic News Feed for 21.06.2019:
– Business Activity Report (EU) – 10:30 (GMT+3:00);
– Secondary Real Estate Sales (EU) – 17:00 (GMT+3:00);
The price fixed above 50 MA and 100 MA which points to the power of the buyers.
The MACD histogram is in the positive zone but below a signal line which gives a weak signal to buy EUR/USD.
The Stochastic Oscillator is in the neutral zone, the %K line is below the %D line which points towards correctino of EUR/USD.
Trading recommendations
Support levels: 1.12700, 1.12400, 1.12100
Resistance levels: 1.13100, 1.13400
If the price fixes above 1.13100, expect further growth towards 1.13400-1.13600.
Alternatively, the quotes can fall towards 1.12500-1.12300.
The GBP/USD currency pair
Technical indicators of the currency pair:
Prev Open: 1.26408
Open: 1.27033
% chg. over the last day: +0.53
Day’s range: 1.26903 – 1.27247
52 wk range: 1.2438 – 1.3631
GBP/USD is moving sideways. There is no defined trend. GBP is testing the key support and resistance levels are 1.26750-1.27250. The Bank of England kept the monetary policy at the same level. The regulator has worsened the economy growth forecasts for the country. The Central Bank is also worried about the high-stress environment in the world trade and the Brexit ambiguousness. Keep an eye on the US economic reports and open positions from the key levles.
The Economic News Feed for 21.06.2019 is calm.
The price fixed above 50 MA and 200 MA which points to the power of the buyers.
The MACD histogram is in the positive zone but below the signal line which gives a weak signal to buy GBP/USD.
The Stochastic Oscillator is in the neutral zone, the %K line is below the %D line which points towards a correctino of GBP/USD.
Trading recommendations
Support levels: 1.26750, 1.26300, 1.26000
Resistance levels: 1.27250, 1.27600
If the price fixes above 1.27250, expect further growth towards 1.27600-1.27800.
Alternatively, the quotes can descend towards 1.26400-1.265200.
The USD/CAD currency pair
Technical indicators of the currency pair:
Prev Open: 1.32787
Open: 1.31897
% chg. over the last day: -0.72
Day’s range: 1.31622 – 1.31960
52 wk range: 1.2727 – 1.3664
USD/CAD is consolidating after a rapid fall since the beginning of the week. The key support and resistance levels are 1.31600 and 1.32200. USD remains under pressure. A technical correction is possible soon. We expect important report from Canada. Keep an eye on the oil quotes dynamics and open positions from the key levels.
At 15:30 (GMT+3:00) Canada will publish a retail sales report.
The price is fixed below 50 MA and 200 MA which points to the power of the buyers.
The MACD histogram is in the negative zone but above the signal line which gives a weak signal to sell USD/CAD.
The Stochastic Oscillator is in the neutral zone, the %K line is above the %D line which points towards a correction of USD/CAD.
Trading recommendations
Support levels: 1.31600, 1.31300, 1.31000
Resistance levels: 1.32200, 1.32500, 1.33000
If the price fixes below 1.31600 local support, expect further descend towards 1.31300-1.31000.
Alternatively, the quotes can correct towards 1.32500-1.32800.
The USD/JPY currency pair
Technical indicators of the currency pair:
Prev Open: 108.099
Open: 107.288
% chg. over the last day: -0.74
Day’s range: 107.049 – 107.370
52 wk range:: 104.97 – 114.56
USD/JPY remains in a bearish mood. Right now the trading instrument is testing the key minimums. The local support and resistance levels are 107.000 and 107.400. The demand for USD remains low after the Federal Reserve meeting. The USD/JPY quotes have prospects for further descend. Keep an eye on the US Treasury bonds’ yield and open positions from the key levels.
The Economic News Feed for 21.06.2019 is calm.
The price fixed below 50 MA and 100 MA which points to the power of the buyers.
The MACD histogram is in the negative zone but above the signal line which gives a weak signal to sell USD/JPY.
The Stochastic Oscillator is in the neutral zone, the %K line is above the %D line which points towards a recovery of USD/JPY.
Trading recommendations
Support levels: 107.000, 106.500
Resistance levels: 107.400, 107.600, 107.850
If the price fixes below 107.000, epxect further growth towards 106.600-106.400.
Alternatively, the quotes can grow towards 107.600-107.850.
The US dollar has reached a low for three months against the basket of major currencies after the Fed meeting. The US currency is still under pressure since the regulator may reduce the key interest rate in the near future. The US dollar index #DX closed in the negative zone (-0.59%) yesterday.
Yesterday, the Bank of England left a key interest rate unchanged at 0.75%, as investors forecasted. At the same time, the regulator lowered the UK economic growth forecast to zero in the second quarter of 2019 and pointed out the risks associated with growing fears of no-deal Brexit. Also, a rather weak report on retail sales in the UK for May was published.
Mixed economic data from the US were published yesterday. Philadelphia Fed manufacturing index increased by only 0.3% in June, while experts expected growth by 10.6. However, initial jobless claims counted to 216K instead of 220K. Today we expect a report on existing home sales in the US, as well as a number of indicators on economic activity in the Eurozone.
The “black gold” prices are rising. At the moment, futures for the WTI crude oil are testing the mark of $57.25 per barrel.
Market Indicators
Yesterday, the bullish sentiment was observed in the US stock market: #SPY (+0.96%), #DIA (+0.95%), #QQQ (+0.93%).
The 10-year US government bonds yield has become stable after a significant collapse the day before. Currently, the indicator is at the level of 2.02-2.03%.
The news feed on 2019.06.21:
– Statistics on economic activity in Germany and the Eurozone at 10:30 (GMT+3:00) and 11:00 (GMT+3:00); – Core retail sales in Canada at 15:30 (GMT+3:00); – Existing home sales in the US at 17:00 (GMT+3:00).
Last Wednesday, the eyes of the market were on the Fed rate decision and their projection for the US economy, as well as the proposed monetary policy decisions from the Fed.
While the US central bank did not cut rates, markets found several hints in the Fed statement for several cuts in the second half of 2019 (e.g. in the Fed Dot plot), starting with the next meeting in July where the Fed Watch Tool now shows market participants expecting a cut with a 100% probability.
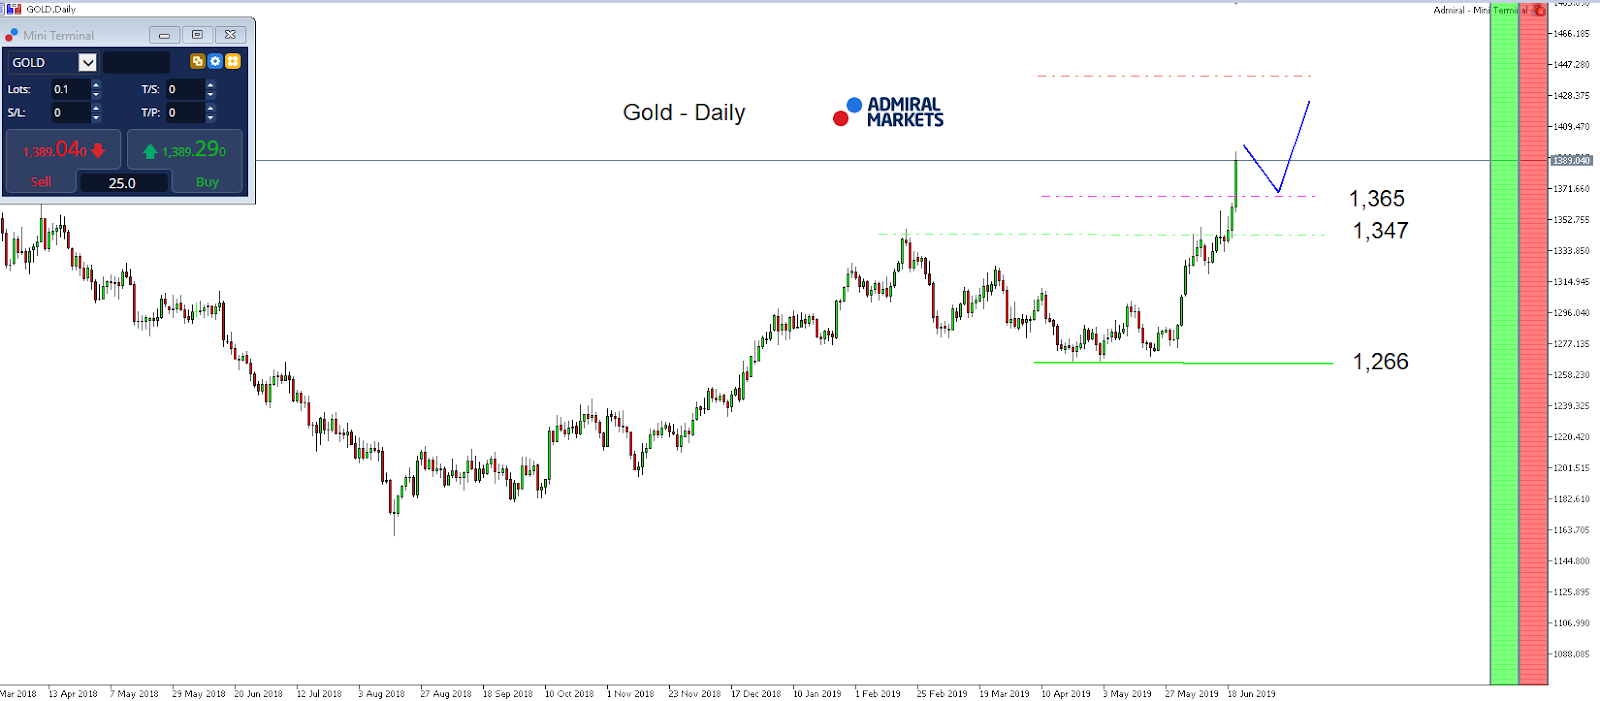
As a result, Gold pushed already to new yearly highs on Wednesday and took out the multi-year-resistance zone around 1,360/365 in the early hours of trading on Thursday.
As we discussed in our weekly market outlook last Monday, […]A break higher and above 1,360/365 can be considered a strong mid-term buy-signal which sees a projected target somewhere around 1,700 USD, and possibly even higher.[…]
That said, under the given fundamental and technical outlook, the current device in Gold seems clearly to be ‘Buy the dip’, with finding an interesting first long-trigger around 1,360/365 USD.
In general, the bullish picture in Gold on a daily time-frame stays active as long as we trade above 1,266 USD:
Source: Admiral Markets MT5 with MT5-SE Add-on Gold Daily chart (between March 19, 2018, to June 20, 2019). Accessed: June 20, 2019, at 10:00pm GMT – Please note: Past performance is not a reliable indicator of future results, or future performance.
In 2014, the value of Gold fell by 1.7%, in 2015, it fell by 10.4%, in 2016, it increased by 8.1%, in 2017, it increased by 13.1%, in 2018, it fell by 1.6%, meaning that after five years, it was up by 6.4%.
Investing in Forex with Admiral Markets
Admiral Markets offers professional traders the ability to trade with a custom, upgraded version of MetaTrader 5, allowing you to experience trading at a significantly higher, more rewarding level. Experience benefits such as the addition of the Market Heat Map, so you can compare various currency pairs to see which ones might be lucrative investments, access real-time trading data, and so much more. Click the banner below to start your FREE download of MT5 Supreme Edition!
Disclaimer: The given data provides additional information regarding all analysis, estimates, prognosis, forecasts or other similar assessments or information (hereinafter “Analysis”) published on the website of Admiral Markets. Before making any investment decisions please pay close attention to the following:
This is a marketing communication. The analysis is published for informative purposes only and are in no way to be construed as investment advice or recommendation. It has not been prepared in accordance with legal requirements designed to promote the independence of investment research, and that it is not subject to any prohibition on dealing ahead of the dissemination of investment research.
Any investment decision is made by each client alone whereas Admiral Markets shall not be responsible for any loss or damage arising from any such decision, whether or not based on the Analysis.
Each of the Analysis is prepared by an independent analyst (Jens Klatt, Professional Trader and Analyst, hereinafter “Author”) based on the Author’s personal estimations.
To ensure that the interests of the clients would be protected and objectivity of the Analysis would not be damaged Admiral Markets has established relevant internal procedures for prevention and management of conflicts of interest.
Whilst every reasonable effort is taken to ensure that all sources of the Analysis are reliable and that all information is presented, as much as possible, in an understandable, timely, precise and complete manner, Admiral Markets does not guarantee the accuracy or completeness of any information contained within the Analysis. The presented figures refer that refer to any past performance is not a reliable indicator of future results.
The contents of the Analysis should not be construed as an express or implied promise, guarantee or implication by Admiral Markets that the client shall profit from the strategies therein or that losses in connection therewith may or shall be limited.
Any kind of previous or modeled performance of financial instruments indicated within the Publication should not be construed as an express or implied promise, guarantee or implication by Admiral Markets for any future performance. The value of the financial instrument may both increase and decrease and the preservation of the asset value is not guaranteed.
The projections included in the Analysis may be subject to additional fees, taxes or other charges, depending on the subject of the Publication. The price list applicable to the services provided by Admiral Markets is publicly available from the website of Admiral Markets.
Leveraged products (including contracts for difference) are speculative in nature and may result in losses or profit. Before you start trading, you should make sure that you understand all the risks.
On Thursday the 20th of June, trading on the euro closed up. The euro made gains against the dollar on the back of a rising EURGBP cross and a broadly weaker dollar, which slid over expectations of a rate slash by the US Fed. Rising oil prices provided additional support to the majors via commodity currencies. The EURUSD pair reached the 1.1316 mark, after which it underwent a correction to 1.1271.
Brent oil rose by 3.8% to 64.78. This occurred in response to Iran shooting down a US drone, along with America’s response, increasing tensions in the Middle East.
At the time of writing, the euro is trading at 1.1284. Buyers are having a difficult time in today’s Asian session. After the drone incident, US President Donald Trump approved air strikes on Iran. He called them off later, but giving the order again at any moment would be very much his style. Details of this incident were reported by the New York Times.
Talk of interest rates has been replaced on the front pages by the situation in the Middle East. The ongoing retreat towards safe havens could trigger a big correction on the euro. As of now, I’m expecting a downwards correction to the 45th degree at 1.1263. If the pair drops faster than forecasted, it should fall as far as 1.1255/50.
The Federal Reserve announced they were leaving rates unchanged on Wednesday, June 19. The markets were expecting this or a quarter percent price decrease. Initially, the markets reacted to the news by moving to the downside recently. The markets immediately reversed the upside rather dramatically showing that investors believed that that may move into an easy stance within a few months.
The big movers after the bad news which we expected were in gold, silver, miners and the US dollar. Subscribers locked in another 17.4% winning trade on this fed news while the US dollar rotated lower on Tuesday, June 18 prompting a further downside move after the bad news. It is very likely that the US dollar will move lower an attempt to retest support near 96.50. A weakening US dollar will help to support the US stock market and precious metals prices. Additionally, a weaker US dollar will help support trade, economic growth, employment, and GDP output.
We believe the US stock market is nearing upper resistance. We still believe the US stock market will eventually attempt to move about the psychological levels of 3000 for the S&P, 30,000 for the Dow and 340 SPY. This move to new all-time highs will likely result in a ”scouting party” type of price pattern where price attempts to identify new resistance, slightly above the psychological levels, then reverses back below these levels to retest support.
Our continued belief that a large pennant/flag formation is unfolding has not changed. As technical analysts, we need to wait for the new price peak form before we can identify where the upper channel of the pennant/flag formation is trending. We would urge traders to be conscious that any outside move in the stock markets as a very limited upside potential from current levels. The SPY is trading at 293 and we believe upper resistance will be found slightly above 300. Thus, we really have about a $7 or $8 move to the upside from current levels – only about 3% to 4% more room to the upside.
The transportation index paints a very clear picture of price channels, support and resistance, and expected price rotation going forward. The current price channels indicate a high target area near 5250. This upward channel range is still only 3% or 4% higher from current levels.
After this peak level is reached the market should reverse downward attempting to retest support. We believe we are very close to a market top at this point and believe that the US stock market may attempt to move above the major psychological levels – as indicated above.
There are a few items which could change our outlook currently.
A. Positive news regarding trade issues with China
B. Renewing or new central bank easing policies
C. Any type of dramatic positive economic news
D. China attempting to resolve banking issues by taking the problems and addressing them with capital/gold reserves.
Ideally, there are quite a few opportunities for the stock market rally far beyond the psychological levels. Yet with only about 14 months to go before the US presidential elections and no indication that any of our four critical components for renewed price advance are anywhere close to being accomplished, we hold to the belief that the markets will complete the Pennant/Flag formation as we have originally been stating.
We urge traders to pay attention to precious metals and the US and foreign stock markets as we enter this critical phase of the market. We believe the US stock market will continue to rotate within the channels clearly on the transportation index chart. We believe any excessive fear will become evident in the bond markets and precious metals well before the US stock market rotates lower.
In our opinion, this is not the time to buy into technology or the US stock market expecting a massive breakout to the upside. We are urging our clients to be very cautious over the next 30 to 60 days and to trade with short profit targets in mind. There are a lot of moving components throughout the global economy and we are urging our members to be very aware of the larger patterns that are setting up.
Our super cycle research has given us a very clear picture as to what to expect over the next 16 months or longer.
We have a good pulse on the major markets and can profit during times when most others can’t which is why you should join my Wealth Trading Newsletter for index, metals, and energy trade alerts. Visit our website to learn how you can see what this research is telling us.
I am going to give away and ship out silver rounds to anyone who buys a 1-year, or 2-year subscription to my Wealth Trading Newsletter. You can upgrade to this longer-term subscription or if you are new, join one of these two plans listed below, and you will receive:
I can tell you that huge moves are about to start unfolding not only in metals, or stocks but globally and some of these super cycles are going to last years. These super cycles starting to take place will go into 2020 and beyond which we lay out in our new PDF guide: 2020 Cycles – The Greatest Opportunity Of Your Lifetime
I am going to give away and ship out silver rounds to anyone who buys a 1-year, or 2-year subscription to my Wealth Trading Newsletter. You can upgrade to this longer-term subscription or if you are new, join one of these two plans listed below, and you will receive:
1-Year Subscription Gets One 1oz Silver Round FREE (Could be worth hundreds of dollars)
2-Year Subscription Gets TWO 1oz Silver Rounds FREE (Could be worth a lot in the future)
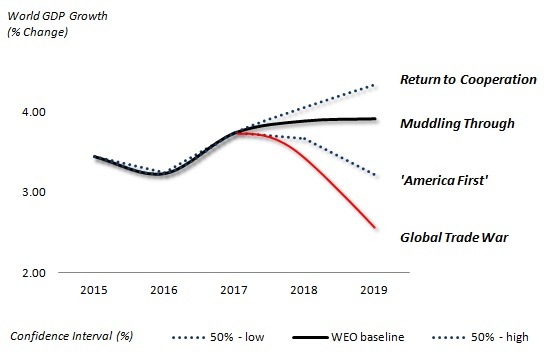
Compared to pre-2008 crisis levels, world economic growth has plummeted by half and is at risk of a long-term, hard-to-reverse stagnation. Returning to global integration and multilateral reconciliation could dramatically change the scenario
Since spring 2017, the US-led tariff wars have effectively undermined the global recovery. In the past years, global economy has navigated across several scenarios. Now it is approaching the edge.
I have been following four generic scenarios on the prospects of global economic growth since the U.S. 2016 election. The first two scenarios represent variants of “recoupling.” In these cases, global integration prevails, despite tensions. In the next two scenarios, global integration will fail, either in part and regionally or fully and globally.
What should worry us all is that, during the past few years, real global growth prospects have slowly but surely moved from the ideal and preferable scenarios toward the worst and darkest.
The Return to Cooperation Scenario
In this scenario, U.S. and China achieve a trade agreement. Both agree to phase out additional tariffs, renounce trade threats and establish working groups to defuse other friction areas in intellectual property rights, social and political issues, and military matters. Global growth prospects could – in the best scenario – even exceed the old OECD/IMF baselines at more than 4%.
This was always the least likely scenario to materialize. Today, its degree of probability is minimal. Yet, it is important to remember that, during the first Trump-Xi meeting, many observers saw the scenario still as possible, even probable.
The Muddling Through Scenario
In this scenario, the tariff’s economic impact would have been limited to 0.4% of Chinese GDP and 0.8% of U.S. GDP, respectively. U.S. and China develop a path to a trade agreement during the truce, but other friction areas, – particularly in advanced technology, result in new skirmishes.
Uncertainty decreases but fluctuates. Global economic prospects barely improve. Markets witness rallies and plunges. Global recovery fails. Global growth prospects remain close to 3.5%-3.9%.
Only half a year ago, this scenario was still seen as a viable one. Today, it feels like a bygone world.
The America First Scenario
In this scenario, the import-value stakes would be 10-fold relative to the start of the trade war, amounting to more than $0.5 trillion, with soaring collateral damage. In China, it could shave off 0.4% and in the U.S., 0.8% of the 2019 GDP, respectively. Neither the U.S. nor China would agree to phase out additional tariffs. Talks would linger, fail or lead to new friction. Uncertainty increases, volatility returns. Global prospects decline further. Markets linger.
In this scenario, global prospects would dampen as world GDP growth in 2019 would sink to 3% or worse.
The Global Trade War Scenario
In this scenario, all bets are off. U.S. and China fail to agree on a trade compromise. Additional tariffs are enacted and new trade threats declared. The White House escalates attacks against Chinese industries, in intellectual property rights, social and political issues, and military modernization. Volatility soars. Real GDP growth in the U.S. takes a severe hit. Chinese growth erodes.
Eventually, risks to global outlook overshadow world GDP growth, which could linger at 2%-2.5% or worse. World trade and investment plunges. Migration crises abound. The number of globally displaced, which has exceeded World War II figures since the mid-2010s, soars to record highs. A series of new geopolitical conflicts prove harder to contain.
Toward the Edge
So where are we today vis-à-vis these scenarios? A simple answer: Moving closer to the edge.
After trade frictions and the Trump tariffs undermined the global recovery momentum, the IMF finally woke up predicting global economic activity to slow notably. In early June, the World Bank estimated the world economy would only expand by 2.6%. The IMF has affirmed that the trade wars could wipe $455 billion off global GDP in 2020.
Worse, President Trump increased tariffs on $200 billion worth of Chinese goods exported to the U.S., and introduced an effective ban on American companies doing business with Chinese telecom giant Huawei in early May.
In brief, the status quo is shifting from the America First toward the Global Trade War scenario (see the red line in the Figure).
Figure Trade War Scenarios: Risks to Global Economic Outlook
Sources: Difference Group (WEO/IMF growth data)
In effect, multilateral banks’ estimates still downplay effective collateral damage. If the Trump administration will continue to expand trade wars and geopolitical ploys in multiple regions, their models ignore the impending adverse feedback of such measures – as evidenced by Morgan Stanley’s business conditions index that just took the worst one-month hit in its history.
To understand how much expectations have been revised, let’s recall that before the 2008 global crisis global growth rate was around 4% to 4.3%. The current growth rate has almost halved from its pre-crisis level.
In relative terms, something similar occurred in the 1970s, which saw the end of three “glorious decades” of solid growth in major advanced economies.
What we are witnessing now is a potentially fatal fall into secular stagnation. In part, it is structural, resulting from maturing economies and aging populations. But in part, it is self-induced and the effect of misguided trade policies and unilateral geopolitical aggression. In the absence of tariff wars and geopolitical destabilization, global growth rate could now be closer to 3.5%.
The longer it takes to achieve multilateral reconciliation, the more likely it is that falling secular long-term growth rates will prove harder to reverse.
About the Author:
Dr. Dan Steinbock is the founder of Difference Group and has served at the India, China and America Institute (US), Shanghai Institute for International Studies (China) and the EU Center (Singapore). For more, see http://www.differencegroup.net/
The original version was published by South China Morning Post on June 20, 2019
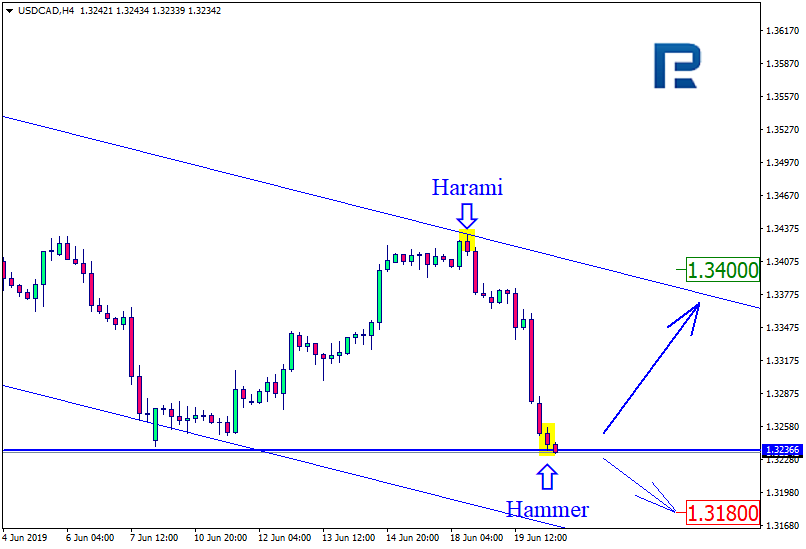
As we can see in the H4 chart, USDCAD has tested the support level while trading downwards and formed Hammer reversal pattern; right now, the pair is trying to break this level. The current situation implies that the reversal pattern may indicate a possible rebound from the horizontal line and a new growth with the target at 1.3400. However, we shouldn’t ignore a possibility that the instrument may break the support level and continue its decline to reach 1.3180.
AUDUSD, “Australian Dollar vs US Dollar”
As we can see in the H4 chart, AUDUSD has formed Hanging Man reversal pattern while testing the channel’s upside border. The current situation implies that the instrument may rebound and fall towards 0.6838. However, we shouldn’t ignore a possibility that the instrument may break the level and continue growing to reach 0.6950.
Attention! Forecasts presented in this section only reflect the author’s private opinion and should not be considered as guidance for trading. RoboForex LP bears no responsibility for trading results based on trading recommendations described in these analytical reviews.
We believe a unique Pennant/Flag formation is setting up in the US stock markets. We believe the Small Cap sector may provide a better technical reference to the price breakout we are expecting in late August or early September than the mid or large-cap sectors. The charts tell a very interesting story when comparing the different sectors to the SPY.
As most of you are well aware, the very deep selloff between October and December 2018 prompted a low price pivot point that most technical analysts are using as a reference to support. What we find interesting is that these Small Caps have really failed to mount any type of price recovery. We believe this is because of the continued capital shift where foreign investors and institutional investors are piling into mid-cap and large-cap equities chasing dividends and safety. The small-cap index chart may provide the best technical reference for the pennant formation and eventual breakout move.
This weekly chart of TNA highlights exactly what we are referencing in comparison to the mid-cap and large-cap charts. Pay very close attention to the support level near $53.50. Also, notice that define panic formation setting up after the December 2018 bottom. We believe the price rotation in the small-cap index is clearer and more identifiable than the rotation in the mid-And large-cap indexes. We also believe the small-cap index will show early warning signs of price weakness or strength after the apex of this move.
The mid-cap and large-cap weekly charts paint a very different picture than the small-cap chart. We can see the upward price slow after the bottom in December 2018 was much more aggressive. We can also see an upward sloping Pennant formation setting up between the lower, blue, price channel and the magenta upward sloping price channel from the recent lows. Please pay close attention to the upper and lower support zones we drawn on this chart. Any future break down in price will likely find support near the upper support zone and possibly pause near this level before attempting a breakdown further if needed.
This last SPY weekly chart highlights the similarities between the made In the large-cap indexes. The way price reacts to these channels as well as creates these Pennant formations in unison is rather interesting. Compared to the small chart, the TNA, it is clear that the main and large-cap prices are moving somewhat in tandem.
At this point in the process, we are waiting for wave 3 to end and wave 4 to begin of the pennant formation. As price continues to consolidate within the pennant range, we should take advantage of opportunities that exist within this rotation and prepare for a brief breakout to new all-time highs. After new all-time highs are reached, we believe an immediate downside price rotation will begin sometime in September 2019 and last possibly into October or November 2019 – possibly longer.
Pay attention to vertical line number 10 on this chart. This price cycle reference occurs on September 8, 2019. It also occurs right after the apex of the pennant formation between the red and magenta lines. Our researchers believe a washout high price rotation, targeting new price highs, will be the likely resulting breakout move. After the washout high exhausts, we believe an immediate downside move will likely begin and push prices back below the 282 to 270 level while attempting to find support. Ultimately this downside move may attempt to retest the 240 level or lower. Time will tell.
Our suggestion is to pay attention to the small-cap index in relation to the mid-cap and the large-cap symbols. We believe the small-cap sector will provide greater detail for technical analysts and researchers. Overall, every one of these charts paints a fairly clear picture. We believe our research is accurate and that the market will do exactly as we are suggesting. The only thing that we are unsure of, at this point, is where the new all-time high price level will peak.
Our ADL predictive modeling system is providing some guidance in regards to this peak level. We will continue to provide further guidance and research as these price swings continue. It would be wise to prepare to trade a tightening price channel as this pennant formation continues – then be prepared for some very big price swings in late August and all through September.
I can tell you that huge moves are about to start unfolding not only in metals, or stocks but globally and some of these super cycles are going to last years. These super cycles starting to take place will go into 2020 and beyond which we lay out in our new PDF guide: 2020 Cycles – The Greatest Opportunity Of Your Lifetime
I am going to give away and ship out silver rounds to anyone who buys a 1-year, or 2-year subscription to my Wealth Trading Newsletter. You can upgrade to this longer-term subscription or if you are new, join one of these two plans listed below, and you will receive:
1-Year Subscription Gets One 1oz Silver Round FREE (Could be worth hundreds of dollars)
2-Year Subscription Gets TWO 1oz Silver Rounds FREE (Could be worth a lot in the future)