Article By RoboForex.com
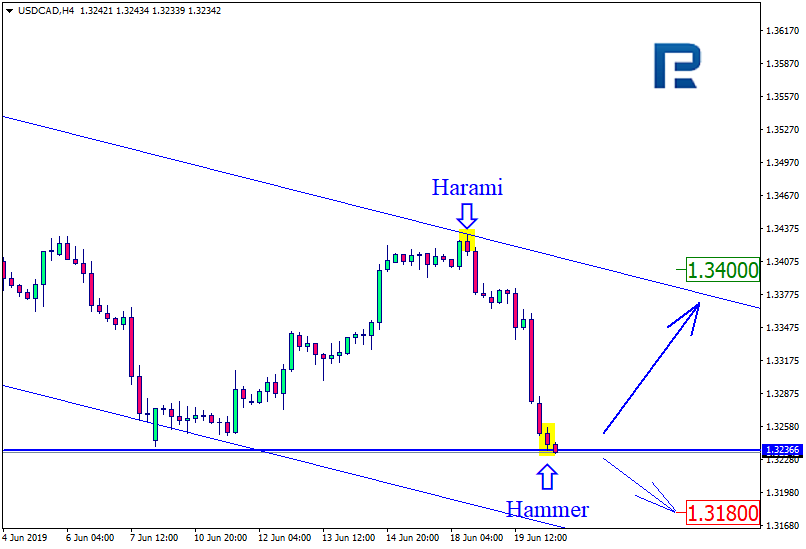
USDCAD, “US Dollar vs Canadian Dollar”
As we can see in the H4 chart, USDCAD has tested the support level while trading downwards and formed Hammer reversal pattern; right now, the pair is trying to break this level. The current situation implies that the reversal pattern may indicate a possible rebound from the horizontal line and a new growth with the target at 1.3400. However, we shouldn’t ignore a possibility that the instrument may break the support level and continue its decline to reach 1.3180.

AUDUSD, “Australian Dollar vs US Dollar”
As we can see in the H4 chart, AUDUSD has formed Hanging Man reversal pattern while testing the channel’s upside border. The current situation implies that the instrument may rebound and fall towards 0.6838. However, we shouldn’t ignore a possibility that the instrument may break the level and continue growing to reach 0.6950.

Article By RoboForex.com
Free Reports:
 Get Our Free Metatrader 4 Indicators - Put Our Free MetaTrader 4 Custom Indicators on your charts when you join our Weekly Newsletter
 Get our Weekly Commitment of Traders Reports - See where the biggest traders (Hedge Funds and Commercial Hedgers) are positioned in the futures markets on a weekly basis.
Attention!
Forecasts presented in this section only reflect the author’s private opinion and should not be considered as guidance for trading. RoboForex LP bears no responsibility for trading results based on trading recommendations described in these analytical reviews.